Key Findings:
- Taxes on sugar-sweetened beverages are proposed with the promise to improve public health outcomes, but they come with equity concerns because of their regressive nature.
- We use Nielsen consumption data to explore the relationship between household income and measures of sugar-sweetened beverage consumption by expenditures and fluid ounces.
- If a nationwide taxA tax is a mandatory payment or charge collected by local, state, and national governments from individuals or businesses to cover the costs of general government services, goods, and activities. were levied on sugar-sweetened beverages, about two-thirds of the revenues would be derived from middle-income households between $20,000 and $100,000, assuming these income groups would have similar behavioral adjustments to such a tax.
- For an excise taxAn excise tax is a tax imposed on a specific good or activity. Excise taxes are commonly levied on cigarettes, alcoholic beverages, soda, gasoline, insurance premiums, amusement activities, and betting, and typically make up a relatively small and volatile portion of state and local and, to a lesser extent, federal tax collections. based on fluid ounces, 78 percent of the tax collections would come from households with income under $100,000.
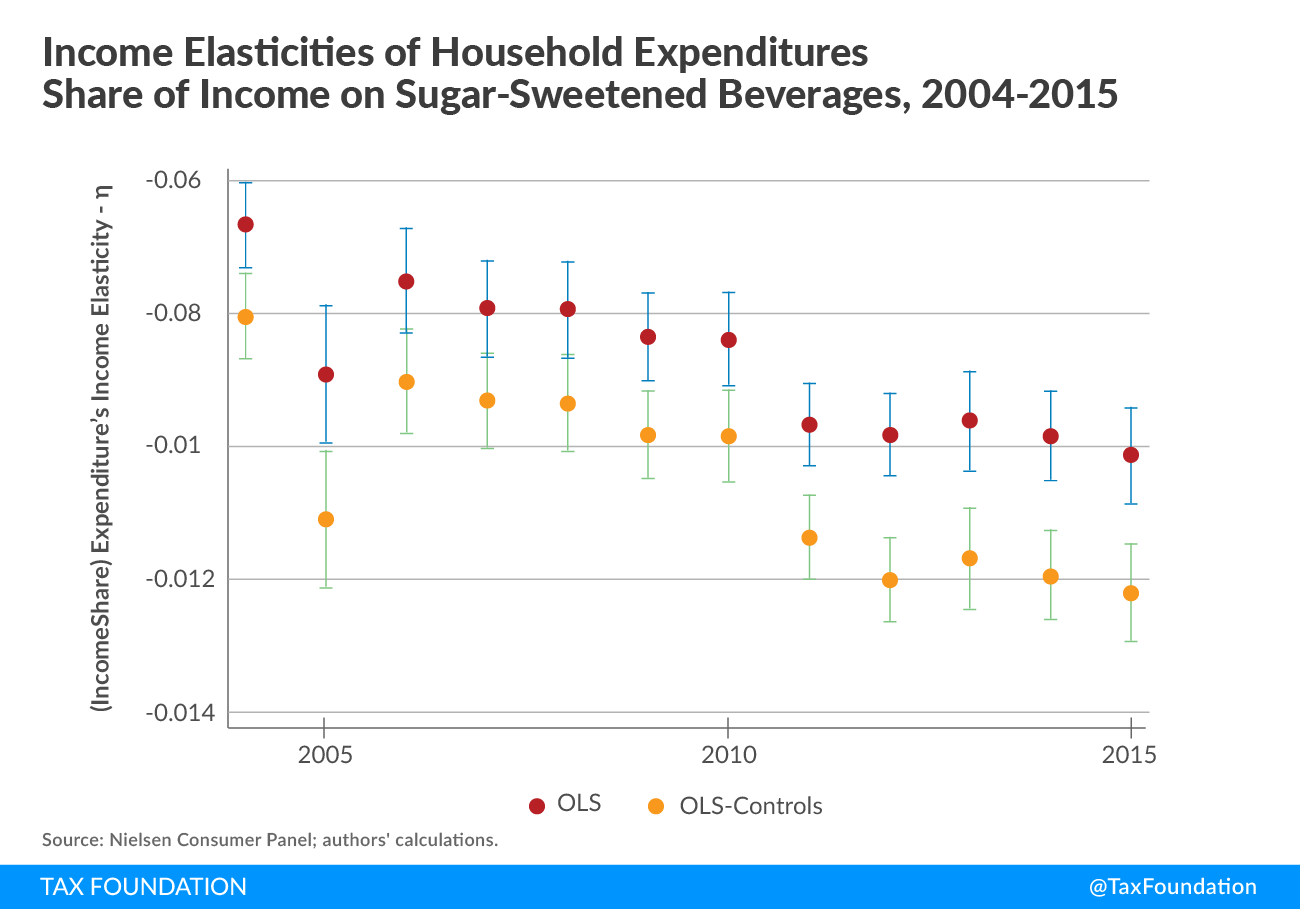
- The share of household income devoted to expenditures on sugar-sweetened drinks decreases by about 0.01 percent for every 1 percent increase in income, implying a regressive expenditure pattern.
Introduction
Several U.S. cities in recent years have sought to expand their portfolio of taxes to include sugar-sweetened beverages (SSB) as a means to combat obesity, diabetes, and other diet-induced health problems. These reforms join the legacy of movements in behavior-correcting beverage taxes on alcohol and other “sin” products. Perhaps the most common complaint of these taxes, however, is their anticipated regressivity. For instance, Sen. Bernie Sanders (I-VT) presumed this in a 2016 op-ed against Philadelphia’s SSB tax, calling it “a regressive grocery tax that would disproportionately affect low-income and middle-class Americans.”[1] The views of these taxes stem from expectations of consumer expenditure patterns, and it seems likely that the spending on beverages as a percentage of income is likely to decline among high-income households. To the extent both these claims are true, taxes on SSBs perhaps represent the quintessential trade-off in tax policy between efficiency and equity.[2]
However, estimates on these expenditure profiles are lacking, and if regressivity is a concern it would be helpful to have some understanding of how regressive these taxes might be. This report seeks to contribute information on the income profiles of household expenditures and ounces of beverage for SSBs to better inform the public debate. More specifically, household purchases of sugar-sweetened beverages from 2004 to 2015 are examined for levels and trends according to their income profiles. Assuming that at least some share of such taxes would be passed on to consumers in the form of higher prices, the analysis demonstrates that any form such a tax may take will be regressively distributed among the consumers. Furthermore, the trends suggest that these expenditure profiles have become more regressive over recent years.
Section 2 of this report provides background on the recent studies on taxing SSBs. Section 3 explains the underlying data source used in the paper and informs the reader of important caveats associated with it. Section 4 provides a geographic overview of state consumption of SSBs as measured by household retail expenditures. Section 5 looks at average consumption patterns by income groups in the most recent year of the data, while the penultimate section explores income-consumption correlations over time. Section 7 summarizes the findings and conclusions.
Background on Sugar-Sweetened Beverage Taxation
Excise taxes levied on goods that are considered socially undesirable (that is, gambling, alcohol, drugs, etc.) are sometimes called “sin” taxes. Among economists, one proposed advantage of sin taxes is that they can reduce overconsumption of goods that impose harm on others, such as through higher health-care costs or unwanted behaviors. Another proposed advantage occurs when people struggle in making the choice they would prefer with perfect information and/or self-control. In both cases, the rationale is embedded in the theoretical framework of a “Pigouvian” price correction whereby a tax forces the individual to internalize the broader costs of the available choices, and react accordingly by reducing their consumption.
Using taxes to encourage healthier eating choices is a fairly recent tax policy development at the subnational level. Berkeley, California, voters passed a per-ounce tax on sugar-sweetened beverages in 2015 that has been followed by Philadelphia, San Francisco, Oakland, and Cook County (Illinois), though Cook County quickly repealed the tax after consumer backlash. In some cases, the motivations for the taxes were tied towards reducing the costs of health care. In 2014, U.S. local governments spent $88.5 billion for noncapital hospital functions and $45.5 billion in public health services, which represented about 8 percent of total local expenditures.[3] State governments spent nearly the same amount at $66.9 billion and $44.2 billion for hospital and health services, respectively. For comparison, state and local governments spent a combined $220.7 billion on police, corrections, and judicial administration for the same period, nearly $25 billion less than those health and noncapital hospital outlays. According to some proponents, meaningful impacts on individual consumption choices might represent long-run cost savings on items that are otherwise difficult for public decision-makers to influence.
The recent academic research has focused on estimating the behavioral responses of the individuals targeted by these policies. Two recent articles have focused on the implementation in Berkeley. Falbe et al. (2016) used a repeated cross-sectional design comparing the pre- and post-changes in sweetened and unsweetened consumptions for different individuals. Their study concluded that SSB consumption decreased 21 percent in Berkeley and increased 4 percent in comparison cities, while water consumption increased 63 percent in Berkeley and 19 percent in comparison cities. In a separate study, Silver and colleagues (2017) used scanner data to assess pre- and post-changes in prices, spending, and consumption of SSBs and near substitutes by comparing Berkeley stores to control stores from different locations. Silver and colleagues found that the tax pass-through varied depending on retailers’ characteristics and beverage type. However, they also found that spending and consumption of SSBs decreased in Berkeley and increased in the comparable neighboring stores, whereas consumption of nontaxable beverages increased in Berkeley.
Other studies have shown that increased taxes on SSBs tend to increase the consumption of other substitutes. Wansink and colleagues (2014) found that taxes on calorie-dense foods (including SSBs) are associated with higher consumption of beer, potentially trading one public health problem for another. Fletcher and colleagues (2010) found that higher taxes on SSBs are associated with higher consumption of other high-calorie drinks among adolescents, which completely offsets any reductions in caloric intake from reduced SSB consumption.
In contrast, this study focuses on the potential distributional effects of prospective taxes on SSBs. We use expenditures on SSBs as a share of income, which would be most informative of a selective ad valorem tax. The early adopters of this policy levy the tax on a per ounce basis, which we also examine.
About the Data
One of the difficulties of expenditure incidence questions is in obtaining data refined enough to indicate the types of purchases that are applicable to the tax of interest. For this report, we employ the Nielsen Consumer Panel Data provided by the Kilts Center for Marketing (“the Nielsen data”).[4] The Nielsen data comprises a representative panel of households that use in-home scanners to record UPC codes for all their purchases intended for personal consumption. We pull product UPC codes that are likely to be subject to a tax on SSBs.[5] This provides data on product characteristics and expenditures for the households’ purchases. This allows us to perform analysis of purchasing patterns measured by expenditures and total ounces for SSBs.[6]
The data has some limitations that are important to consider. First, the data only provides information about household purchases from retailers, and does not include expenditures at other types of establishments. Furthermore, households might consume foods they did not purchase or purchase foods they do not ultimately consume. A second limitation concerns underreporting described in Oster (2017), who states that not all the purchases subject to be scanned are reported to the Nielsen Consumer Panel. She compares purchases of food and beverages from Nielsen with those reported in the National Health and Nutrition Examination Survey (NHANES), concluding that Nielsen information represents 80 percent of the calorie intake reported in the NHANES. Finally, the information on expenditures is available at the household level and not at the individual level. It would be desirable to assess individual sugar consumption patterns to link consumption to within household heterogeneity in individual characteristics.
Ultimately, it is likely that the sources of underreporting and missing expenditures consequently understate the level of expenditures and sugar consumption. However, our analysis emphasizes comparisons across groups. The implicit assumption is that these underreporting differences are not systematically correlated with the groups of study to a degree significant enough to alter the substantive inferences drawn. Unfortunately, there is no means of testing this assumption.
The Geography of Sugar-Sweetened Beverage Consumption
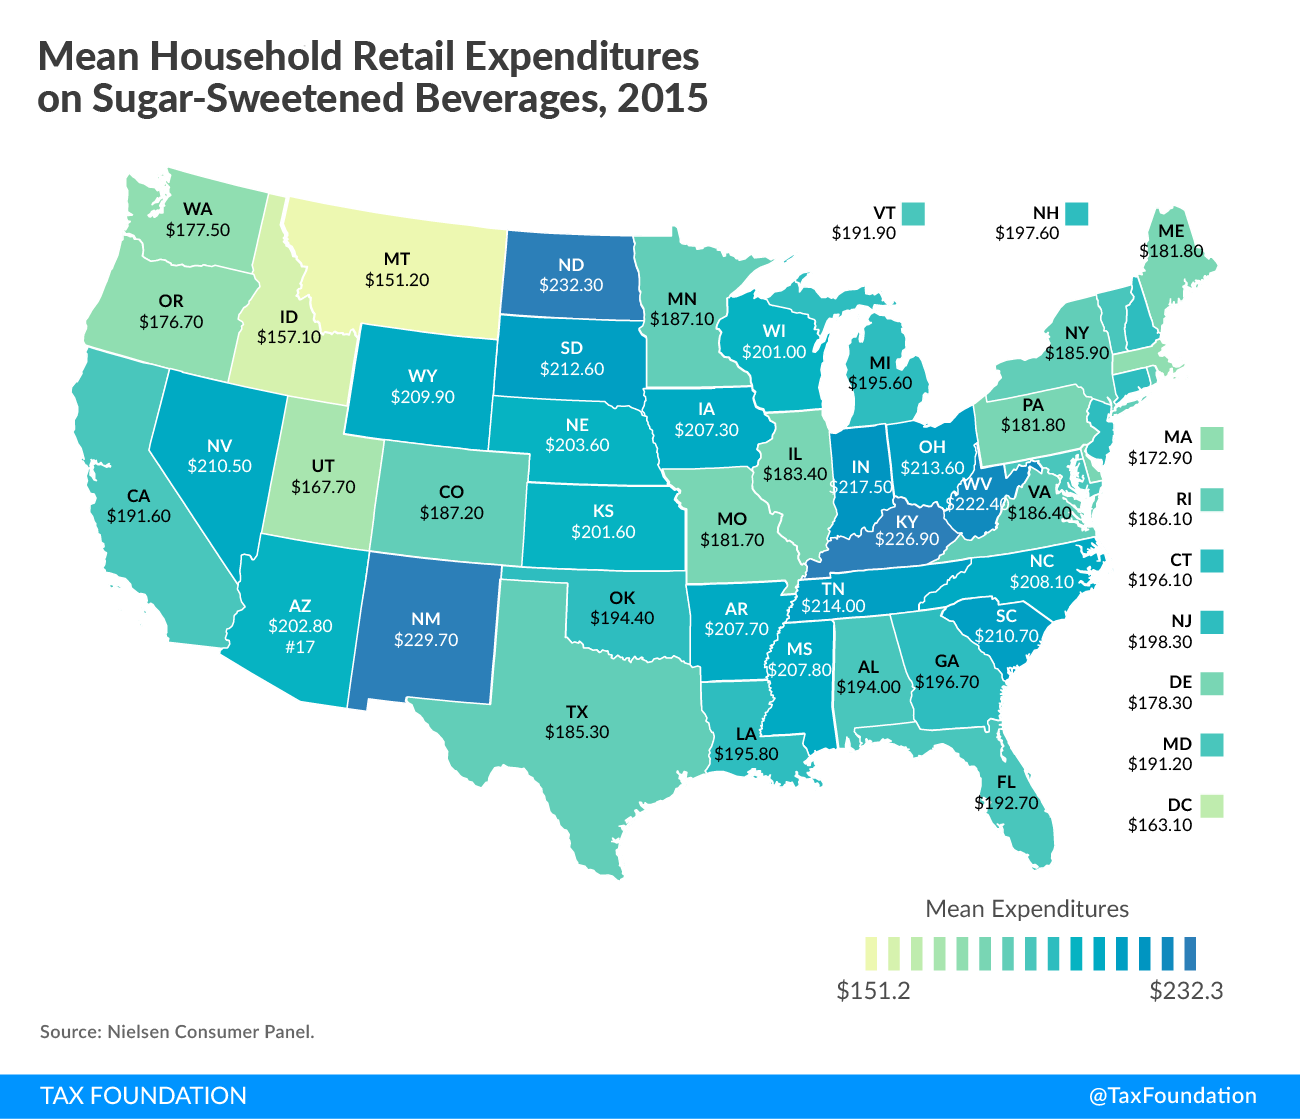
Depending on the political unit interested in the taxation of SSBs, the geographic distribution of the incidence may be a relevant consideration if it is not uniform. One way to observe this is by examining average consumption levels by state. Figure 1 provides some sense of this by providing the mean level of household retail expenditures on sugar-sweetened beverages for 2015. This is the mean of all households surveyed in the state, for which there are many low or no consumers of each.[7] In other words, a small percent of the population can drive the mean with very heavy expenditures, so a caveat to the mean is that it might in some cases have substantively lower expenditures if the average was represented with the median. Nevertheless, the mean serves the purpose of illustrating the relative differences in geographic intensity, as the shade darkens with the state’s average expenditure level.
Figure 1 provides a color-coded state map of average expenditures on sugar-sweetened beverages. The Midwest features prominently in the highest levels of sugar-sweetened beverage expenditures with North and South Dakota, Indiana, Ohio, Kentucky, Tennessee, and West Virginia in the top set. Joining the group is New Mexico and Nevada from the Southwest. From this group North Dakota leads in SSB expenditures, averaging $232 in 2015, followed by New Mexico ($230) and Kentucky ($227). On the other extreme Montana spent only $151 per household on SSBs in 2015, followed by the District of Columbia ($163) and Idaho ($163). The average expenditure on SSBs in 2015 was $194, and among the states with that level of consumption we find Alabama ($194) and Florida ($193). The minimum and maximum average state consumption are separated by $81, higher than 50 percent difference using the expenditure in the state consuming the least (Montana) as a reference.
Figure 1.
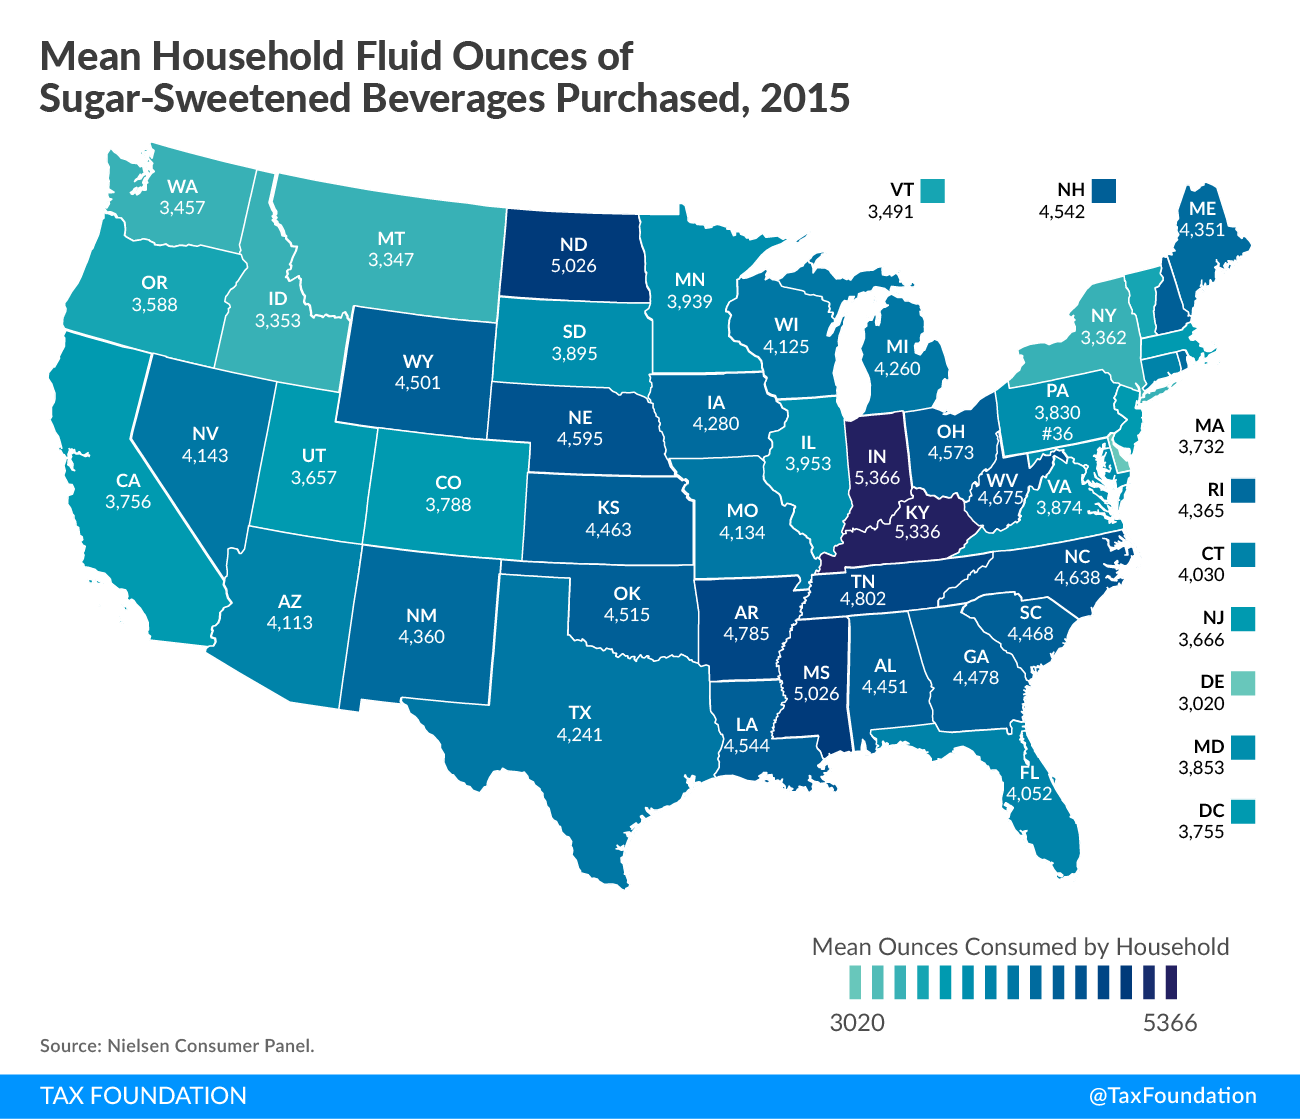
With Figure 2 we can examine purchases measured in total fluid ounces, and we see a similar regional cluster trailing the east side of the Mississippi River from Lake Michigan to the Gulf of Mexico. Indiana and Kentucky have the highest consumption level by this measure with an average household purchase of 5,366 and 5,336 fluid ounces of SSBs in 2015, respectively. Mississippi and North Dakota are the only other states to purchase over 5,000 fluid ounces per household.
Figure 2:
In income taxation, a tax is considered progressive if the average tax burden increases with income, which usually occurs when marginal tax rates are structured so that the last dollar of income is taxed at a higher rate than the first dollar. A regressive income tax is one where the opposite is true.
Taxes on consumption goods are not similarly structured, and so considering their vertical equity is approached somewhat differently by examining expenditure patterns with income. In response to a tax on a product, consumers can only respond to the degree to which they were spending on the good. Therefore, one approach is to examine how the spending changes incrementally as income increases.
For instance, low-income households probably allocate close to zero expenditures towards luxury boats while at least some of the very rich incur positive expenditures. This expenditure profile would imply that a sales tax on luxury boats would be progressive, at least to the extent that sales taxA sales tax is levied on retail sales of goods and services and, ideally, should apply to all final consumption with few exemptions. Many governments exempt goods like groceries; base broadening, such as including groceries, could keep rates lower. A sales tax should exempt business-to-business transactions which, when taxed, cause tax pyramiding. is passed to consumers in the form of higher prices. A second approach is to consider which income groups contribute what share of the total expenditures on the good, which gives some sense of where cumulative tax revenues would arise from in taxing the good when income groups vary in their population size. An implicit assumption to this second approach is that the behavioral responses to a SSB tax would be the same; that is, that all income groups would reduce their consumption in similar proportions in response to the tax.
Table 1 demonstrates some simple summary statistics for expenditures on sugar-sweetened beverages by income group in 2015.[8] Overall, the average annual expenditures on sugar-sweetened drinks were $194 in the Nielsen data in the mean. One will notice the median to be much lower at $136, which reflects the large presence of low to no consumption households. The skewness of the data is further reflected by a standard deviation larger than the mean at $209. These are useful caveats to looking at group averages because it illustrates that consumers somewhat bifurcate towards extremes on the decision to purchase sugar-sweetened beverages. This is similarly observed as we trace the expenditure patterns, mean or median, along the income groups. For households between $5,000 and $15,000, expenditures are decreasing with income. After $20,000 in income, expenditures begin increasing, but at a very slow pace relative to income. The $15,000 to $25,000 range is associated with mean expenditures in the $160-$168 range, and only increases by about $20 to $30 for incomes double the size. The highest closed group in the $70,000 to $100,000 range spends just over $200 at the mean. Roughly, these numbers imply that about $1 to $2 for every $1,000 of income is spent on sugar-sweetened beverages. This expenditure profile implies that a tax on these products would be regressive at very low incomes and essentially proportional beyond that.
| Retail Expenditures ($) | Liquid Ounces | ||||||
|---|---|---|---|---|---|---|---|
| Household Income | Mean | Median | Standard Deviation | Mean | Median | Standard Deviation | |
| <5K | 175 | 116 | 197 | 4,046 | 2,507 | 4,458 | |
| 5K-8K | 164 | 108 | 194 | 4,619 | 3,256 | 4,967 | |
| 8K-10K | 160 | 102 | 201 | 3,752 | 2,521 | 3,923 | |
| 10K-12K | 158 | 101 | 187 | 4,005 | 2,497 | 4,540 | |
| 12K-15K | 155 | 98 | 187 | 4,182 | 2,355 | 9,935 | |
| 15K-20K | 160 | 107 | 182 | 3,664 | 2,357 | 4,105 | |
| 20K-25K | 168 | 115 | 187 | 4,083 | 2,680 | 4,623 | |
| 25K-30K | 181 | 125 | 205 | 4,226 | 2,914 | 4,279 | |
| 30K-35K | 180 | 128 | 193 | 4,201 | 2,994 | 4,366 | |
| 35K-40K | 184 | 134 | 190 | 4,060 | 2,697 | 4,267 | |
| 40K-45K | 189 | 137 | 192 | 4,196 | 3,032 | 4,323 | |
| 45K-50K | 194 | 140 | 205 | 4,393 | 3,087 | 4,537 | |
| 50K-60K | 194 | 144 | 199 | 4,333 | 2,954 | 4,476 | |
| 60K-70K | 201 | 150 | 198 | 4,189 | 2,887 | 4,135 | |
| 70K-100K | 203 | 153 | 197 | 4,189 | 2,954 | 4,218 | |
| 100K< | 207 | 155 | 205 | 3,949 | 2,844 | 3,857 | |
| Total | 194 | 136 | 209 | 4,106 | 2,820 | 4,553 | |
Table 1 also reports the fluid ounces of SSBs purchased in 2015. Again, substantial skewness exists reflecting the tendency for households to divide into extremes as very low or very high consumers. At the mean for both measures, however, there is no apparent trend upward or downward as income rises. This suggests that the increase in expenditures over the $25,000 to $100,000 income range does not necessarily imply that more ounces of drink are being purchased, but perhaps that consumers are nevertheless substituting towards more expensive beverages as income rises.
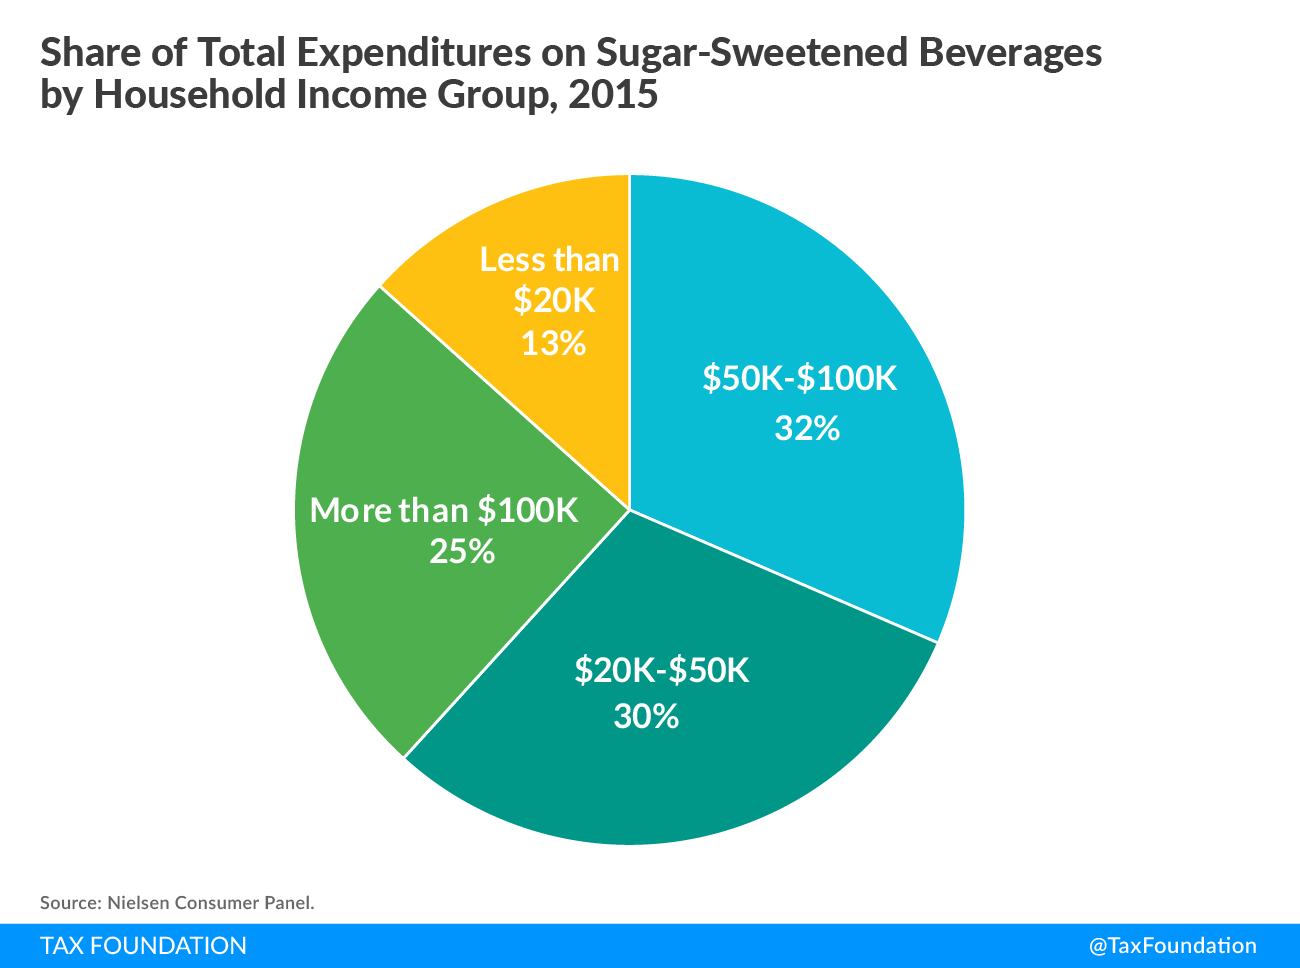
Figure 3 reports the share of total expenditures according to some conventional ranges for income groups. Households above $100,000 in income account for about 25 percent of the total expenditures on sugar-sweetened beverages, whereas those below $20,000 in income contribute about 13 percent. The remaining three-fifths of the expenditures come from those households in the middle of those two groups. From this perspective, the bulk of an ad valorem tax on sugar-sweetened beverages would be derived from middle-income groups, while the highest and lowest income groups would contribute somewhat lower shares.
Figure 3.
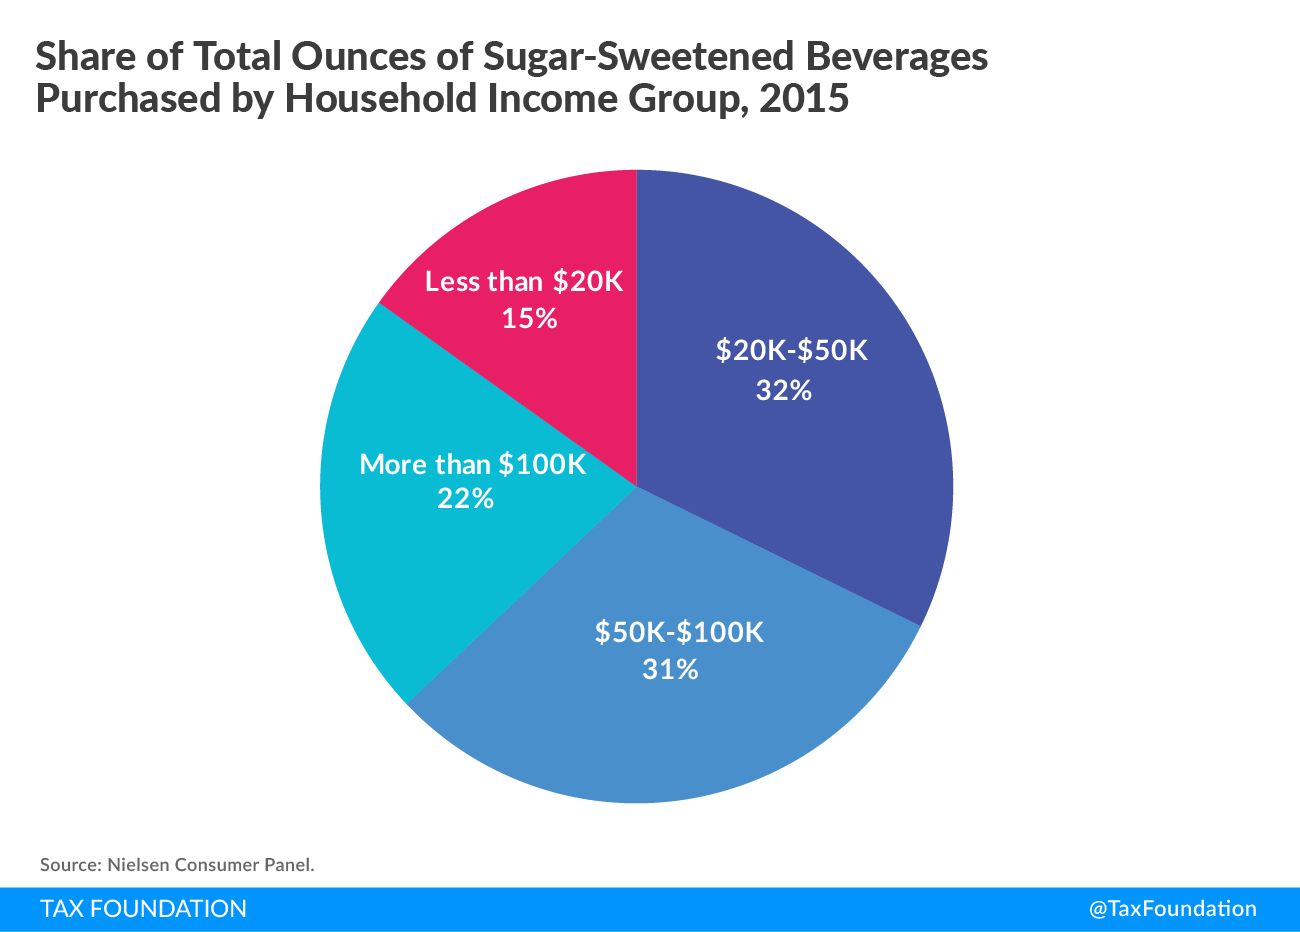
Figure 4 depicts the distribution of ounces consumed across the same income groups in 2015. If a one-cent tax per ounce was added to SSBs, this would be the statutory incidence distributed across the income groups, once again assuming their behavioral changes were identical across all groups. It would seem to be slightly more regressive than the ad valorem alternative as the share paid by those over $100,000 declines from 25 to 22 percent, while the share paid by those with less than $20,000 increases from 13 to 15 percent.
Figure 4.
Income-Consumption Profiles: Trends and Demographic Adjustments
Just as a progressive income tax system implies that average tax rates increase with income, a regressive consumption tax is one where average consumption decreases with income. It has already been demonstrated that the consumption profiles of these goods are regressive in the sense that their share of household consumption decreases with income. This section explores how annual expenditures on SSBs as a share of income are correlated with household income and how this correlation has evolved over time.
If expenditures increase with income then the correlation between the two is positive, and the more positive the correlation the more progressive it can be regarded. For instance, a progressive income tax system will have a more positive correlation between income and income tax burden among its households than an equivalent set of households that cumulatively contribute the same tax revenues with a flat income tax rate. Alternatively, if tax burdens were determined by a random number generator, the correlation with income would presumably be zero.
There are a couple of different ways in which trends of this type can be observed. One approach is to ask how expenditures on these beverages change across the population’s households according to their incomes. This correlation can be estimated using ordinary least squares (OLS) for each year and plotted by year along with a confidence interval that illustrates the precision of the correlation.[9] The advantage of the confidence intervals is that the noisier the relationship becomes, the confidence interval can illustrate this by expanding to include a larger range. From the perspective of the policymaker who is only concerned with the average regressivity of the tax for the population at hand, this conceptualization is the most desirable illustration. However, household composition changes over time as well, particularly in a time series that includes the Great Recession. Furthermore, the interest may be in comparing otherwise similar households that only differ by income in their beverage expenditures. This can also be accomplished using OLS by including control variables on household characteristics (OLS with controls). The control variables include household size, presence of children, age profiles of children, marital status, race and ethnicity, state identifiers, as well as the head of household’s employment status and educational attainment.
Figure 5 illustrates these correlations between income and annual sugar-sweetened beverage expenditures as a fraction of household income, showing both OLS and OLS with controls, expressed as elasticities.[10] Thus, the interpretation of the numbers on the y-axis can be read as the change in the annual share of income spent on SSBs associated with a 1 percent increase in household income.[11] Figure 5 demonstrates the point estimate around -0.008 in the OLS results from 2004 to 2007 and a bit larger than that if the regression controlled for other differences across households. These magnitudes suggest that a 10 percent increase in income would be associated with just a 0.1 percent increase in sugar-sweetened beverage expenditure share of income. The point estimates decline slightly in the 2010s to encroach on -0.01. So the point estimates have decreased slightly over time, but statistically the trend is essentially flat.
Figure 5.
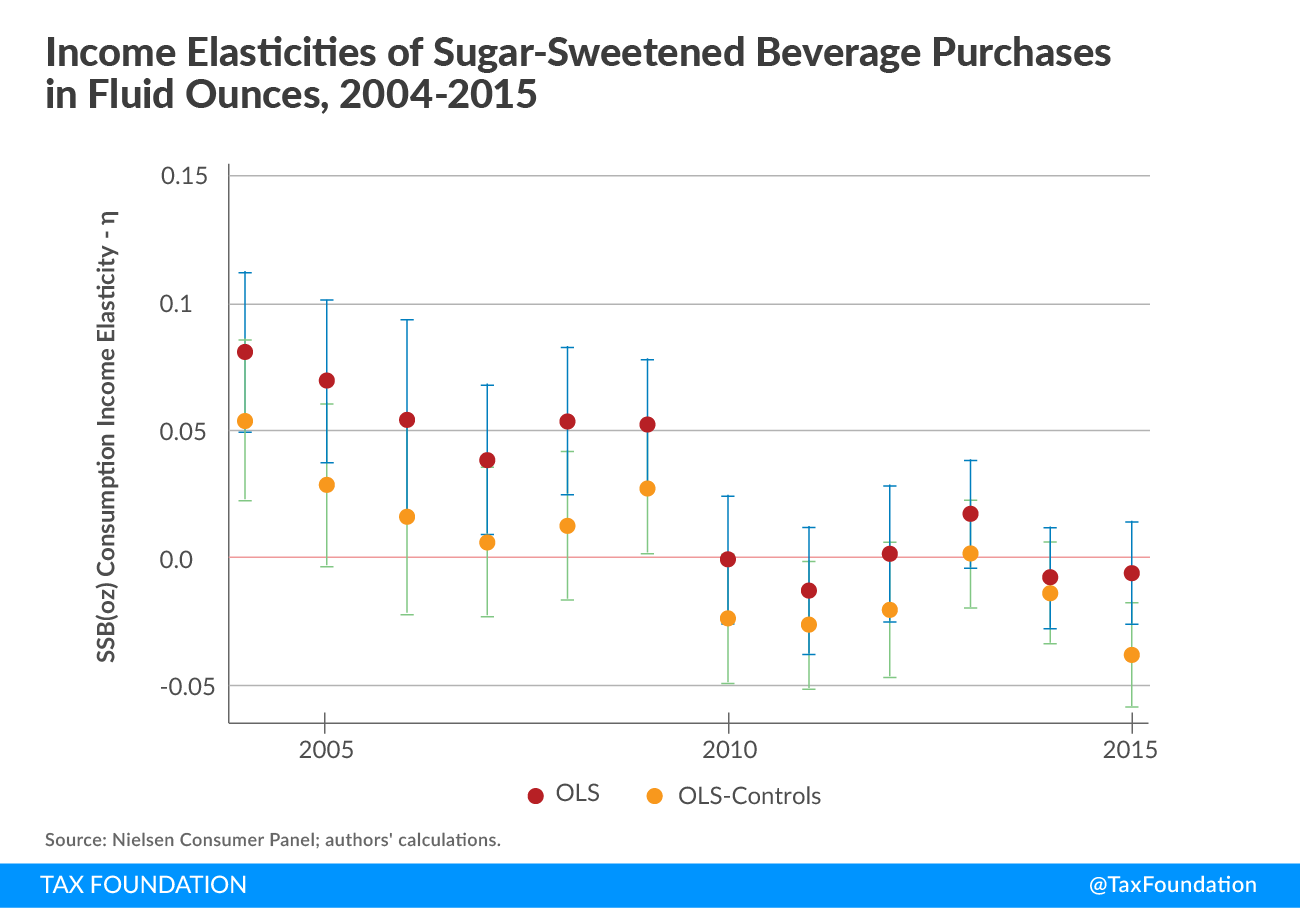
A similar pattern break in the middle of the data is similarly observed in fluid ounces of SSB purchases (Figure 6). Using controls for household characteristics made the estimates more negative than without, but between 2004 and 2009 the point estimates on elasticities ranged between 0.10 and just above zero. By 2010 to 2015, these point estimates were near zero or negative, with the household characteristic-adjusted estimates generally being near -0.025; this implied that a 10 percent increase in income was associated with a reduction in total fluid ounces of SSBs purchases by about -0.25 percent.
Figure 6.
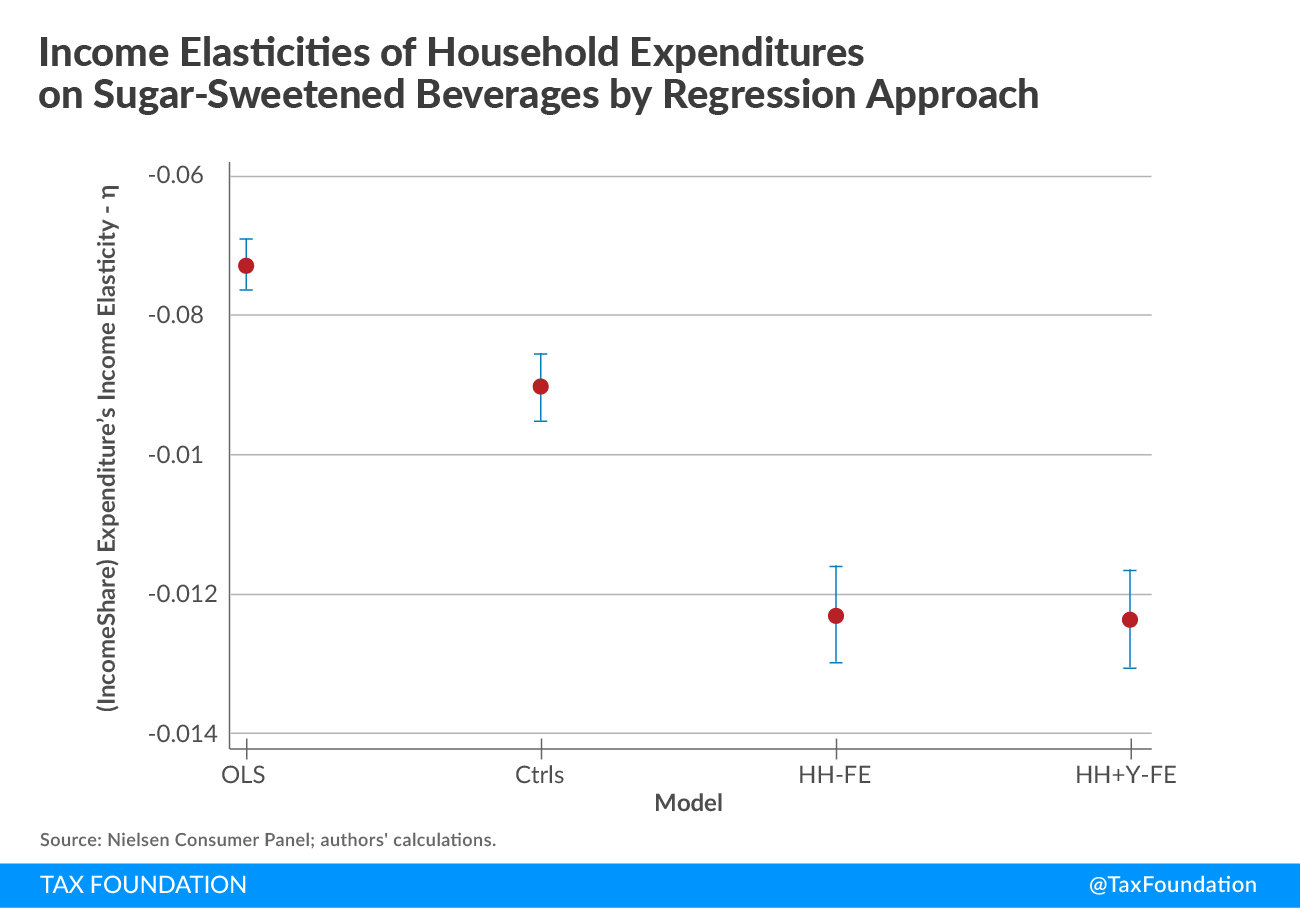
The above analysis explores the relationship between sugar-sweetened beverage consumption and household income across the population of households. An alternative way of viewing the income incidence question is to follow households over time as they experience income changes. In other words, to consider how the average household within the population changed its consumption patterns on SSBs as income also changed. This can be explored by allowing for a household level fixed effect (FE) into the regression. Since we are following households over time, we can introduce time as another control variable to sweep away the time trend altogether.
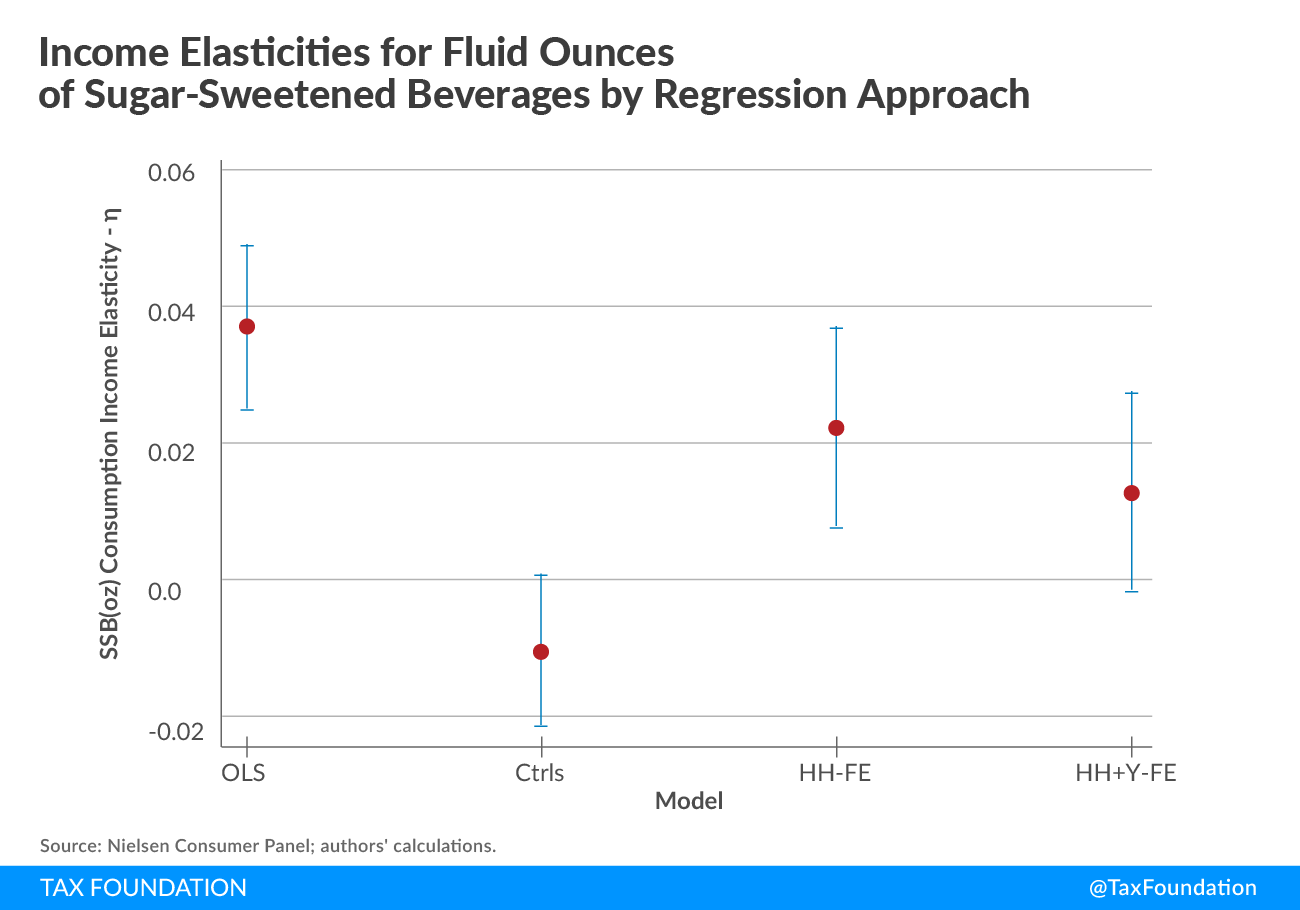
Figure 7 contrasts the OLS, OLS with controls, and three alternative FE approaches. The first approach includes only household fixed effects, whereas the second approach includes year fixed effects. The OLS and OLS with controls in the previous figures were estimated by each year, but in this figure they are estimated for the entire time period to be comparable with the FE model that follows households over time. In the case of each beverage, the increases in magnitude imply that unobserved household characteristics correlated with income mask how sensitive these households are to income changes.
Figure 7.
If we similarly consider fluid ounces of SSBs, Figure 8 demonstrates that income elasticities are positive within households over time on the order of near 0.02 percent. That is, on average a household whose income increases by about 10 percent is associated with a 0.2 percent increase in total fluid ounces of SSB beverages. So, while total expenditure share of the budget decreases within households, as evidenced by Figure 7, this was realized despite households taking in a larger volume of SSBs.
Figure 8.
Conclusion
Sugar-sweetened beverage taxes theoretically offer the potential for reducing externality health-care costs stemming from excessive sugar consumption, and in this way they may raise the prospect of efficiency gains by signaling to consumers these higher social costs. However, these taxes also raise equity concerns to the extent these goods represent a disproportionate share of the consumption among lower-income households.
This report explored the equity concern from several alternative perspectives to inform the policy debate surrounding these tax instruments. It is documented that retail level expenditures on sugar-sweetened beverages increase very little with income so that their share of the household budget decreases with income. Taxing such a product will therefore be regressive, as the average tax rateThe average tax rate is the total tax paid divided by taxable income. While marginal tax rates show the amount of tax paid on the next dollar earned, average tax rates show the overall share of income paid in taxes. would decrease with income. Within households, household income share of retail expenditures decreased with income at a rate of about 0.01 percent of income gains. Across the population, household retail expenditures increase with income at a rate of about 0.1 percent.
However, if a nationwide tax were levied on retail expenditures of sugar-sweetened beverages, about two-thirds of the revenues would be derived from middle-income households between $20,000 and $100,000, assuming these income groups would have similar behavioral adjustments to such a tax. For a tax per fluid ounce of SSB, as has been adopted in several cities recently, the pattern is even more regressive. Since 2010, the income elasticity for total fluid ounces of SSBs has been zero or negative.
Since there are large differences in household types, there is an argument to be made that the cross-population results are the more relevant to policymakers interested in how the policy affects the population at hand. In addition, at the national level there appear to be substantive geographic differences in consumption patterns. In particular, Midwestern states and southern states near the Mississippi river are consistently high consumers by any measure of SSB consumption.
References
Falbe, J., Thompson, H. R., Becker, C. M., Rojas, N., McCulloch, C. E., and Madsen, K. A. “Impact of the Berkeley Excise Tax on Sugar-Sweetened Beverage Consumption.” American Journal of Public Health 106, no. 10 (October 2016): 1865-71.
Fletcher, J., Frisvold, D., and Tefft, N. “The effects of soft drink taxes on child and adolescent consumption and weight outcomes.” Journal of Public Economics 94, no. 11-12 (December 2010): 967-974.
Oster, Emily. “Diabetes and Diet: Purchasing Behavior Change in Response to Health Information.” Brown University Working Paper (April 3, 2017). Retrieved May 15, 2017, from https://www.brown.edu/research/projects/oster/sites/brown.edu.research.projects.oster/files/uploads/Diabetes_and_Behavior_Change_FullPaper.pdf.
Sanders, Bernie. “A Soda TaxA soda tax is an excise tax on sugary drinks. Most soda taxes apply a flat rate per ounce of a sugar-sweetened beverage. Would Hurt Philly’s Low-Income Families.” Philadelphia, April 24, 2016. Retrieved June 7, 2017, from http://www.phillymag.com/citified/2016/04/24/bernie-sanders-soda-tax-op-ed/.
Silver, L. D., Ng, S. W., Ryan-Ibarra, S., Taillie, L. S., Induni, M., Miles, D. R., Poti, Jennifer M., and Popkin, B. M. “Changes in prices, sales, consumer spending, and beverage consumption one year after a tax on sugar-sweetened beverages in Berkeley, California, US: A before-and-after study.” PLOS Medicine 14, no. 4 (April 18, 2017): 1-19.
Wansink, Brian, Hanks, Andrew S., Cawley, John, and Just, David R. “From Coke to Coors: A Field Study of a Fat Tax and its Unintended Consequences.” Journal of Nutrition Education and Behavior 45, no. 4 (July 29, 2014). https://ssrn.com/abstract=2473623.
Appendix
| Interval | Value Used | Interval | Value Used | Comment | |
|---|---|---|---|---|---|
| Under $5000 | $2500 | $40,000-$44,999 | $42,500 | ||
| $5000-$7999 | $6500 | $45,000-$49,999 | $47,500 | ||
| $8000-$9999 | $9000 | $50,000-$59,999 | $55,000 | ||
| $10,000-$11,999 | $11,000 | $60,000-$69,999 | $65,000 | ||
| $12,000-$14,999 | $13,500 | $70,000-$99,999 | $85,000 | ||
| $15,000-$19,999 | $17,500 | $100,000 + | $125,000 | In 2004-2005, and again from 2010 onwards, this interval is the highest value and refers to anything $100,000 and above | |
| $20,000-$24,999 | $22,500 | $100,000 – $124,999 | $112,500 | This value applies to this range only in 2006-2009 | |
| $25,000-$29,999 | $27,500 | $125,000 – $149,999 | $137,500 | Value only present 2006-2009 | |
| $30,000-$34,999 | $32,500 | $150,000 – $199,999 | $175,000 | Value only present 2006-2009 | |
| $35,000-$39,999 | $37,500 | $200,000 + | $225,000 | Value only present 2006-2009 |
Notes
[1] Bernie Sanders, “A Soda Tax Would Hurt Philly’s Low-Income Families,” Philadelphia, April 24, 2016, retrieved June 7, 2017 from: http://www.phillymag.com/citified/2016/04/24/bernie-sanders-soda-tax-op-ed/.
[2] A counter perspective to this equity concern is that it signals lower-income groups to be at disproportionate threat to the health problems the tax attempts to diminish. This is a reasonable perspective; albeit the most conventional motivation for policy intervention is to remedy damages arising from spillover effects on others stemming from individual choice. In this case, there are fiscal externalities to the public arising from higher costs in providing health care supported by public revenues.
[3] Data source: Census of Government Finance, U.S. Census Bureau.
[4] Calculations based on data from The Nielsen Company (US), LLC and marketing databases provided by the Kilts Center for Marketing Data Center at The University of Chicago Booth School of Business. The conclusions drawn from the Nielsen data are those of the researchers and do not reflect the views of Nielsen. Nielsen is not responsible for, had no role in, and was not involved in analyzing and preparing the results reported herein. Information about the data and access are available at http://research.chicagobooth.edu/nielsen/.
[5] Nielsen categorizes UPC codes according to “groups” that indicate the type of product found by UPC code. For this analysis, we used “carbonated beverages,” “non-carbonated beverages,” “juice, drinks, canned, bottled,” and “non-carbonated soft drinks.” From these groups, there is a further subcategorization into “product modules.” We excluded the “bottled water” and “plant or vegetable juices” product modules. Note that we retained diet and other low-calorie carbonated beverages.
[6] Within the Nielsen data, ounces were the unit of measure for 90 percent of the associated UPCs, and another 8 percent were in another unit easily converted to ounces. The final 2 percent of observations represented eight UPCs that did not report a unit of measure, but for which we were able to obtain from the internet.
[7] This mean has been adjusted by the population sampling weight provided by Nielsen.
[8] The sample size is 61,378, and the Nielsen sampling weights for population representativeness are employed to calculate the summary statistics.
[9] The confidence intervals in this paper are derived from robust standard errors that are clustered at the state level.
[10] This was done by taking the natural log of household income, then performing the regression analysis on the ratio of household expenditures on SSBs to income.
[11] Nielsen reports yearly income data in intervals, the first interval groups being households whose income is below $5K; from there on intervals of $2K-$3K iterate until reported household yearly income reaches $20K; the following intervals group households in ranges of $5K until yearly income reaches $50K; in the range $50K to $70K, intervals of $10K are used; and another interval is used for the range $70K-$100K. The top income interval of $100K is used except for the years between 2006 to 2009, when four additional intervals were included for incomes above $100K: two additional intervals of $25K for up to $150K of income, an additional one between $150K and $200K, and a final one for households with yearly income beyond $200K. We use all the information provided by the income intervals report by using a midpoint in the interval as reported in the table in the appendix.
Share this article