Key Findings
- The future of funding for America’s highways has been the topic of much political discussion for decades. While many states have increased motor fuel taxA tax is a mandatory payment or charge collected by local, state, and national governments from individuals or businesses to cover the costs of general government services, goods, and activities. rates over the last decade, the federal government has not updated the gas taxA gas tax is commonly used to describe the variety of taxes levied on gasoline at both the federal and state levels, to provide funds for highway repair and maintenance, as well as for other government infrastructure projects. These taxes are levied in a few ways, including per-gallon excise taxes, excise taxes imposed on wholesalers, and general sales taxes that apply to the purchase of gasoline. since 1993.
- The motor fuel tax is a relatively well-designed tax which acts as a user feeA user fee is a charge imposed by the government for the primary purpose of covering the cost of providing a service, directly raising funds from the people who benefit from the particular public good or service being provided. A user fee is not a tax, though some taxes may be labeled as user fees or closely resemble them. by raising revenue to fund the highway system. The tax also aims to counter the negative side effects caused by driving petroleum-burning motor vehicles and their contribution to congestion.
- Tax revenues per vehicle mile traveled (VMT) are decreasing in real terms while expenditures are increasing in real terms. In 1994, a passenger car averaged 20.7 miles per gallon (MPG) and drivers paid 3.2 cents in state and federal tax per VMT. In 2018, a passenger car averaged 24.4 MPG and drivers only paid 2.1 cents per VMT.
- Discrepancies between tax revenues and highway expenditures will get worse as fuel economy improves, if tax rates are not indexed to inflationInflation is when the general price of goods and services increases across the economy, reducing the purchasing power of a currency and the value of certain assets. The same paycheck covers less goods, services, and bills. It is sometimes referred to as a “hidden tax,” as it leaves taxpayers less well-off due to higher costs and “bracket creep,” while increasing the government’s spending power. , or if share of electric vehicles (EVs) grows.
- One solution is to fund highways by taxing vehicle miles traveled. Rather than using taxes on cars or motor fuel as a proxy for transportation, a tax levied directly on miles gets closer to capturing the externalities and approximating the road maintenance cost of each vehicle.
- A federal VMT tax rate must average 1.7 cents per mile to cover the highway fund’s expenditures. The actual rate per vehicle should be differentiated based on weight per axle.
Table of Contents
- Introduction
- A Well-Designed Tax?
- Letting the Numbers Speak
- Taxing by Vehicle Miles Traveled
- — The “Simple” Solution
- — GPS Tracking
- — Privacy Concerns
- — What Can Be Done in The Short Term?
- Matching Federal Outlays Would Result in Federal Rate Increase
- How Roads Are Funded Today
- Conclusion
- Appendix: State VMT Tax Rates
Introduction
America’s highways are largely funded by state, local, and federal motor fuel taxes. States have levied these taxes since 1919, and by 1932, when the federal tax was introduced, the then-48 states and the District of Columbia were collecting taxes on motor fuel.[1] Today, a combination of increased fuel economy, growth in sales of electric vehicles (EVs), and inflation has raised questions about the sustainability of these taxes as a funding mechanism for the transportation system of the future.
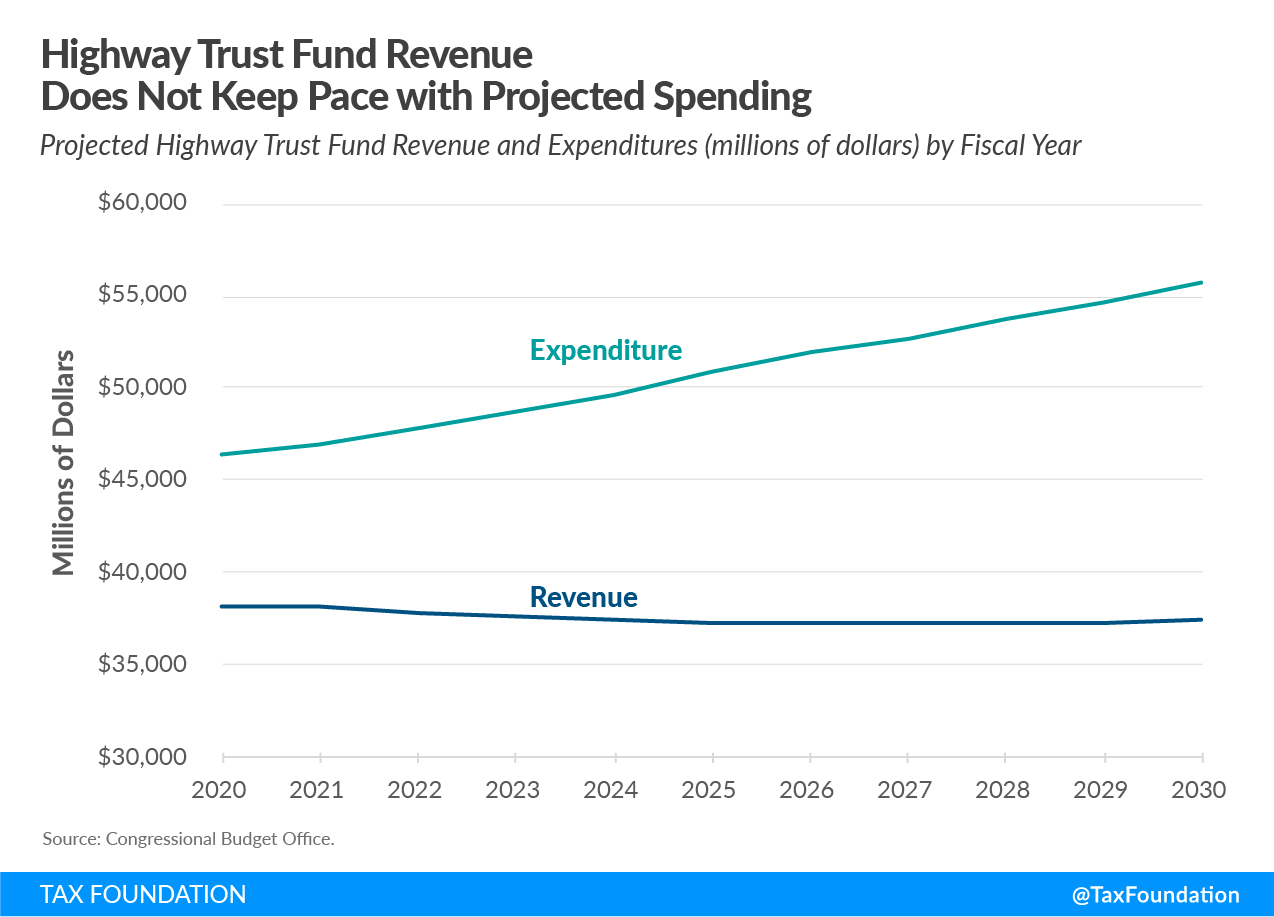
There has been strong political debate over funding for America’s highways, and it is likely to continue. While 36 states have increased motor fuel tax rates over the last decade, the federal government has not updated the gas tax since 1993.[2] With the current funding program, the Fixing America’s Surface Transportation Act (FAST Act), expiring this year, Congress must decide how to pay for the Highway Trust Fund in the years to come. Revenue from the federal motor fuel tax will not fund projected spending at the current tax rate, so the only options for lawmakers are to either appropriate general fund money or increase taxes. According to Congressional Budget Office (CBO) estimates, the Highway Trust Fund will run out of money by the end of 2021 and the deficit is projected to be almost $70 billion over the first years after the FAST Act funding expires.[3]
Ideally, funding should come from the beneficiaries of the system, which is another way of saying that the people who drive on the roads should fund the roads. This is no new idea; it simply represents a return to tradition. President Ronald Reagan once observed that “[o]ur country’s outstanding highway system was built on the user fee principle—that those who benefit from a use should share in its cost.”[4] The technological developments, mentioned above, mean the time may have come for lawmakers to revisit who should pay for the roads, and how they should do so.
If it is still policymakers’ aim to fund transportation with taxes levied on transportation, change is needed. Over the last dozen years highway funding has increasingly been paid for by the federal government’s general fund. Hence, everyone is paying for the roads—even if they do not drive on them. One potential solution that would reestablish the user fee system is to levy a tax on vehicle miles traveled (VMT).
This paper explores a potential long-term solution for redesigning transportation taxes to embody the user fee principle once again.
A Well-Designed Tax?
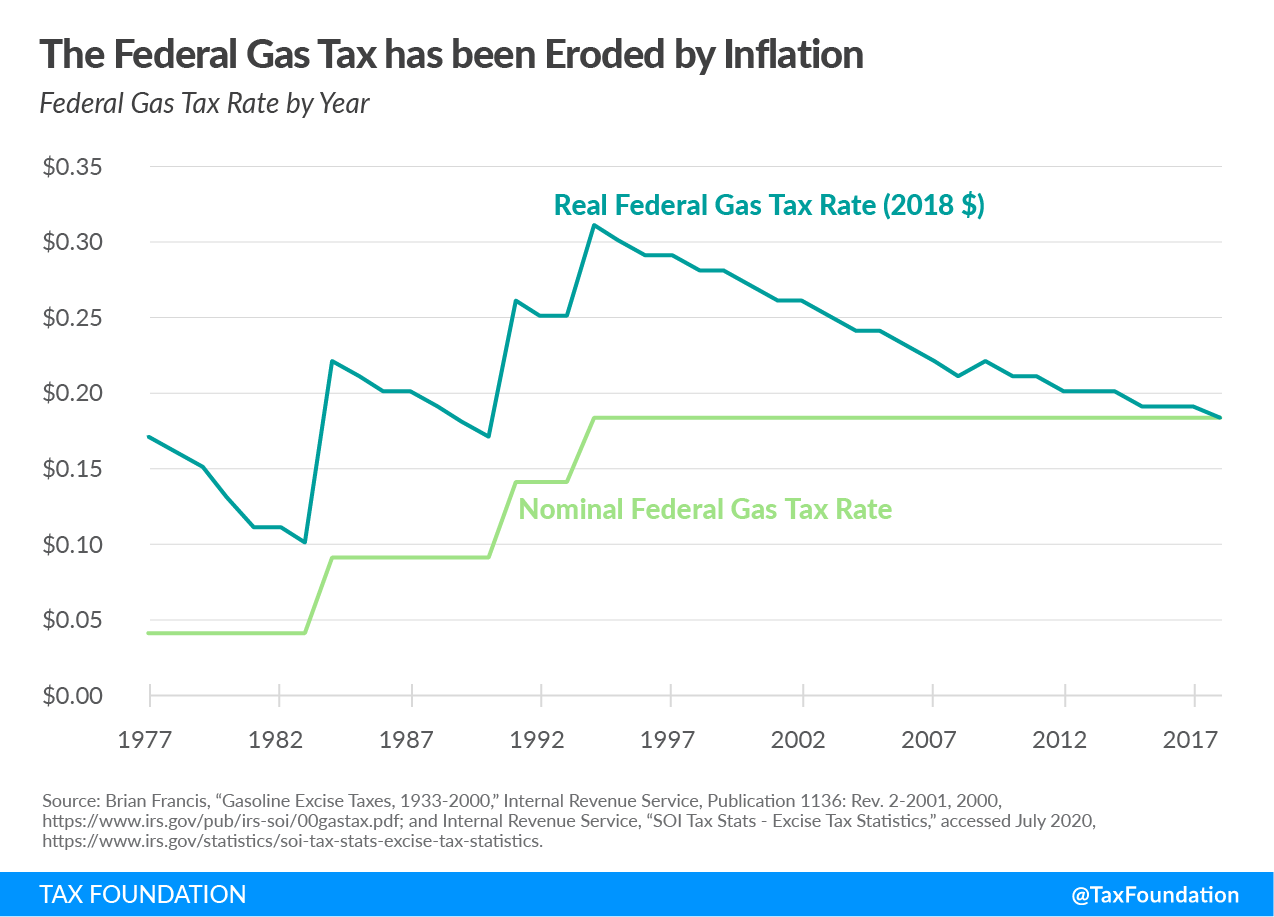
The federal motor fuel excise tax has been levied since 1932. The first levy was 1 cent per gallon and was originally a deficit-reduction measure following the Great Depression. In 1941 the rate was increased to 1.5 cents to help fund World War II, and increased again, to 2 cents, during the Korean War. In 1956, the rate was increased to 3 cents and the Highway Trust Fund was established to fund the new Interstate Highway System. Since then, the rate has increased five times to today’s 18.4 cents (including 0.1 cent reserved for the Leaking Underground Storage Tank Fund). Some states have levied motor fuel taxes since 1919, and all states (including the then territories Alaska and Hawaii) and the District of Columbia had implemented a motor fuel tax by 1946.[5] The average state excise taxAn excise tax is a tax imposed on a specific good or activity. Excise taxes are commonly levied on cigarettes, alcoholic beverages, soda, gasoline, insurance premiums, amusement activities, and betting, and typically make up a relatively small and volatile portion of state and local and, to a lesser extent, federal tax collections. rate in 2020 is 25.6 cents, but gasoline is taxed at an average rate of 36.4 cents per gallon when other taxes are included.[6]
Diesel fuel is taxed at 24.3 cents per gallon at the federal level and at a combined (all state and local taxes) rate of 37.5 cents at the state level. The rate is slightly higher to reflect the fact that diesel-powered vehicles are often larger and thus responsible for more road damage than gasoline-powered vehicles.[7]
The motor fuel tax is relatively well-designed and aims to capture the negative externalities caused by driving petroleum-powered vehicles, internalizing the costs of contributions of road wear-and-tear, traffic congestion, and pollution. Taxes targeting market activity that generate negative externalities are called Pigouvian taxes. From the Pigouvian perspective, the motor fuel tax is one of the best policy options used to mitigate the externalities associated with automotive transportation.[8]
Internal combustion engines can be loud and dirty, and a motor fuel tax aims to offset their cost to society. Motor fuel taxes also act as a user fee where the amount of fuel purchased acts as a rough proxy for a driver’s contribution to road wear-and-tear. By layering an additional price to driving, the tax can encourage drivers to take road utilization into account when deciding where to live or how often to drive. According to the “benefit principle,” the people using the highway system should also pay for maintaining the highway system.[9] This means that the motor fuel tax would ideally tax drivers based on the proportionate damage they do to the roads, among other externalities.
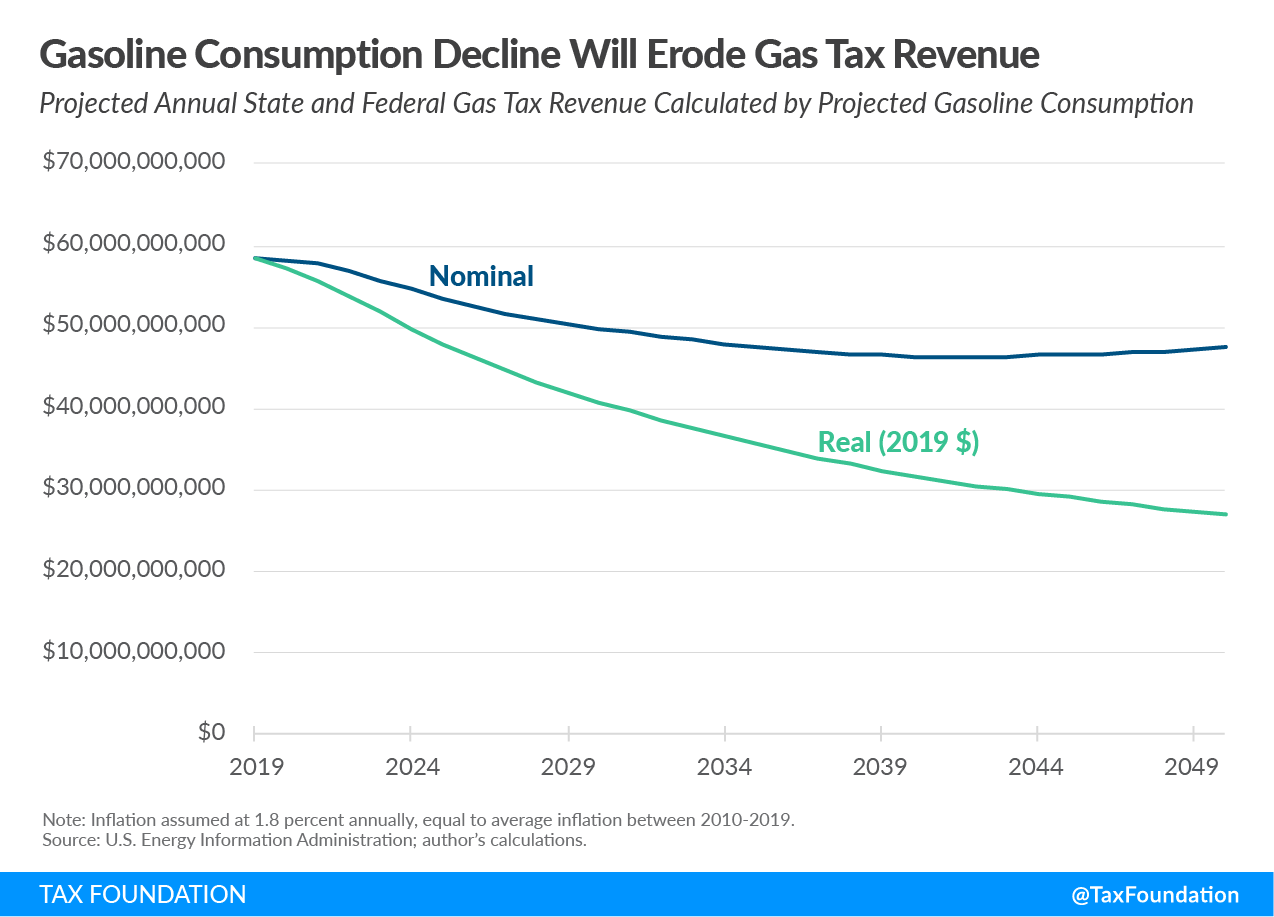
At the federal level, the revenue from motor fuel taxes has not been sufficient to cover transportation expenditures since 2008, and there is no reason to think this development will reverse itself. On the contrary, it is likely to get worse, driven by technological advances and regulation like the Corporate Average Fuel Economy (CAFE) standards. CAFE standards result in better MPG and may encourage a switch to alternative fuel vehicles, which means using the motor fuel tax as a user fee will be more challenging as more electric and fuel-efficient vehicles are produced.[10] This development has been going on for decades, which has resulted in cents raised by motor fuel taxes per VMT declining over time, and it will continue to do so.[11] The U.S. Energy Information Administration estimates that gas consumption will decline 19 percent through 2050.[12]
Figure 1.
While traditional motor fuel taxes will eventually become outdated, they could be a suitable policy tool in the short term for most states. One of the biggest threats against the levy is electric vehicles (EVs) as these cars do not contribute to the state highway funds or the federal highway funds. There are currently less than two million EVs in the U.S. out of a vehicle fleet of more than 268 million vehicles, which means missed revenue from EVs is still low.[13] However, one forecast suggests EVs may comprise 17.5 percent of U.S auto sales by 2028.[14] This would be a problem for states and the federal government in the long term, but a state like California, where EVs and hybrids already make up almost 8 percent of auto sales, may be impacted sooner.
There has sometimes been resistance to taxes on EVs on the grounds that they are environmentally preferable to traditional gas-powered vehicles and thus create fewer externalities. While this is true—electric vehicles generate less net carbon emissions—it does not account for the single largest function of the current motor fuel tax regime (funding roads) or the greatest externality associated with driving cars (wear-and-tear).
At the federal level, motor fuel taxes are rather salient. This year, the Highway Trust Fund’s current funding tool, the FAST Act, expires, which means federal policymakers should decide on what the future federal highway funding (or maybe spending) looks like. For a truly long-term solution to fund highway spending in the United States, policymakers should consider alternatives to simply raising the motor fuel tax rate or figure out a way to lower overall costs.
The next section makes a case for why motor fuel taxes require an update by analyzing the development of motor fuel tax revenue expressed in cents per mile traveled.
Letting the Numbers Speak
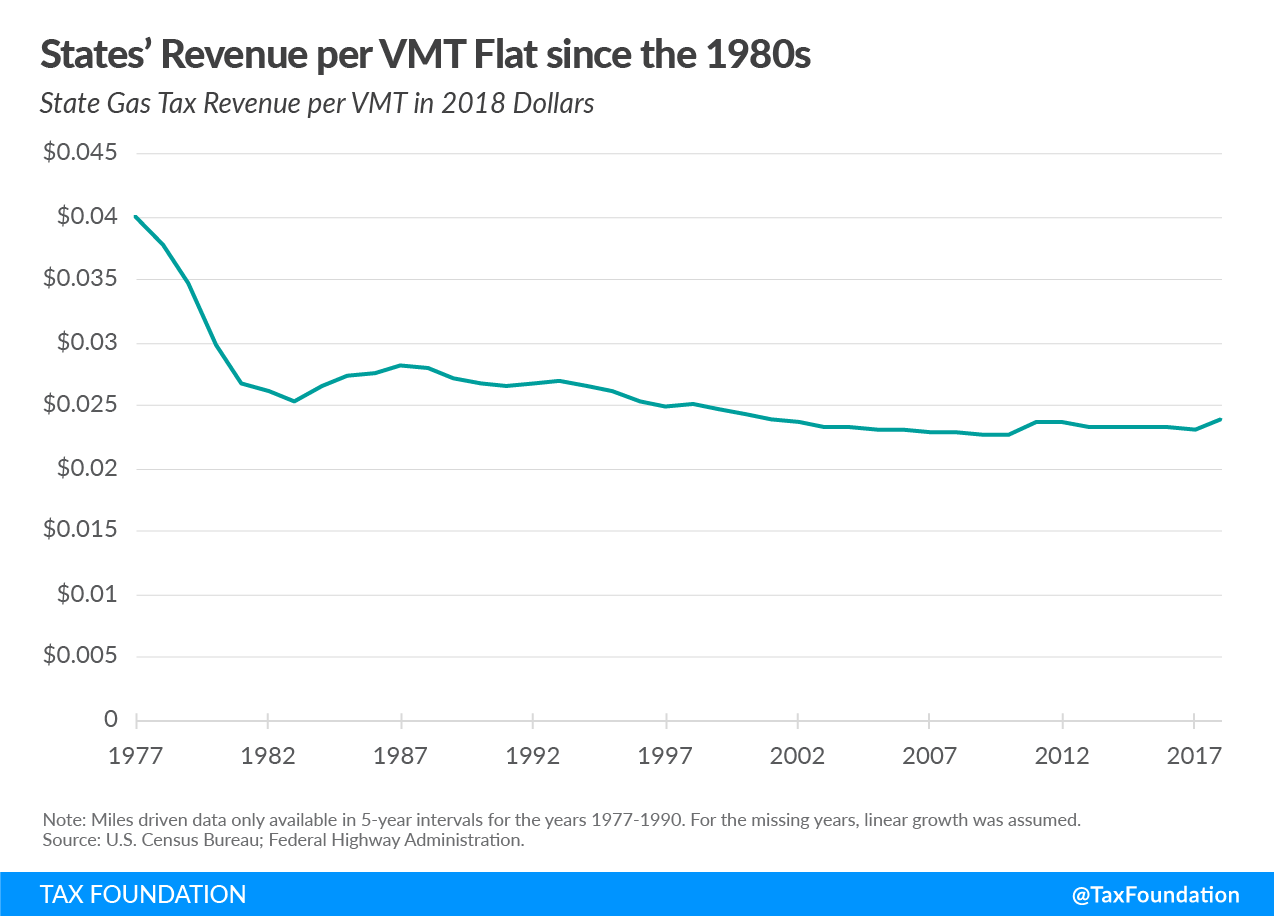
If we look at a simple metric—state tax collected per VMT, illustrated below—it shows that revenue has been relatively flat for the last two decades but has decreased sharply since the 1970s.
Figure 2.
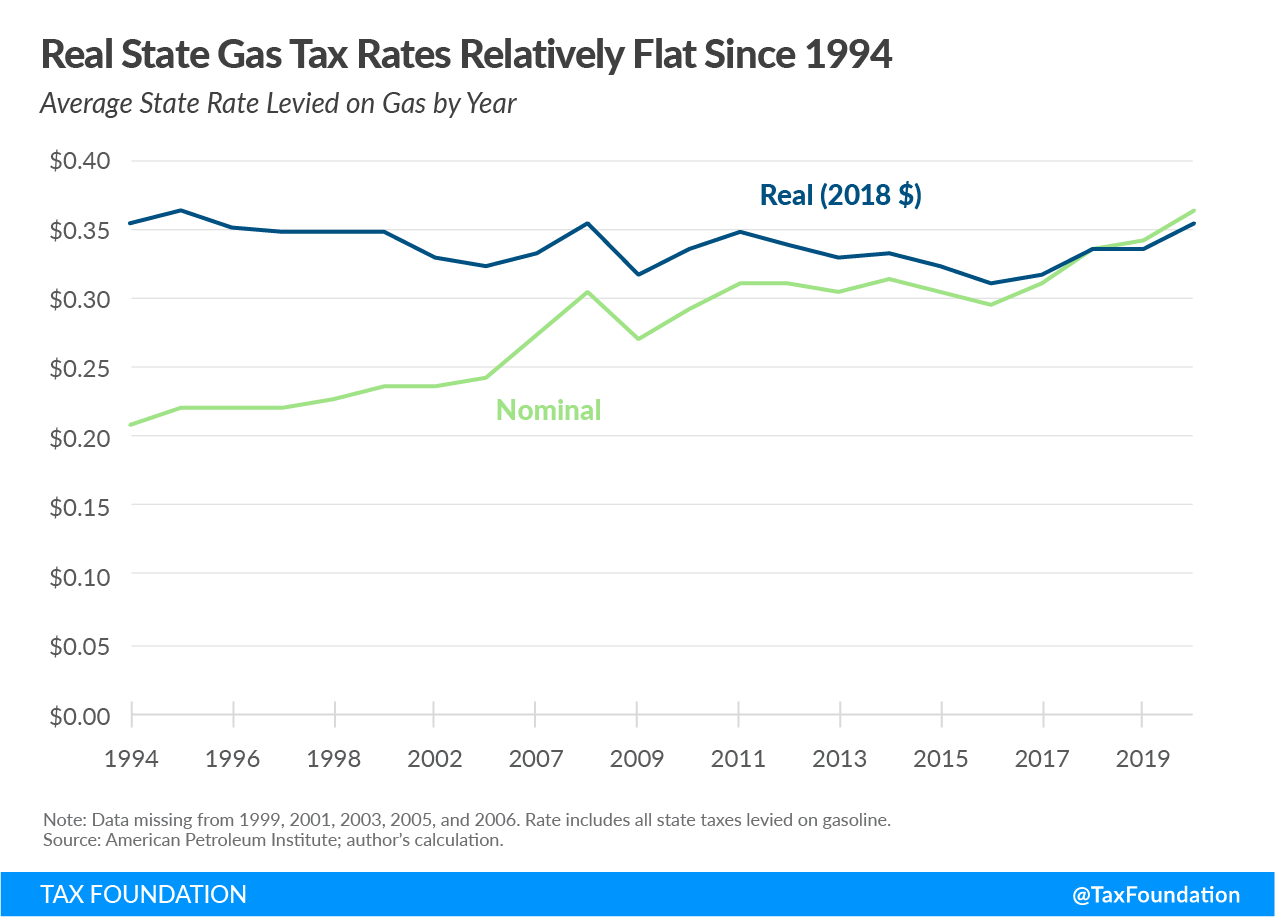
The development of state tax revenue per VMT indicates that most states have continuously increased their gas tax rates to keep up with inflation since the mid-1990s. This trend is illustrated below.
Figure 3.
The picture is slightly different when looking at federal tax collections, where rates have held constant in recent years.
Figure 4.
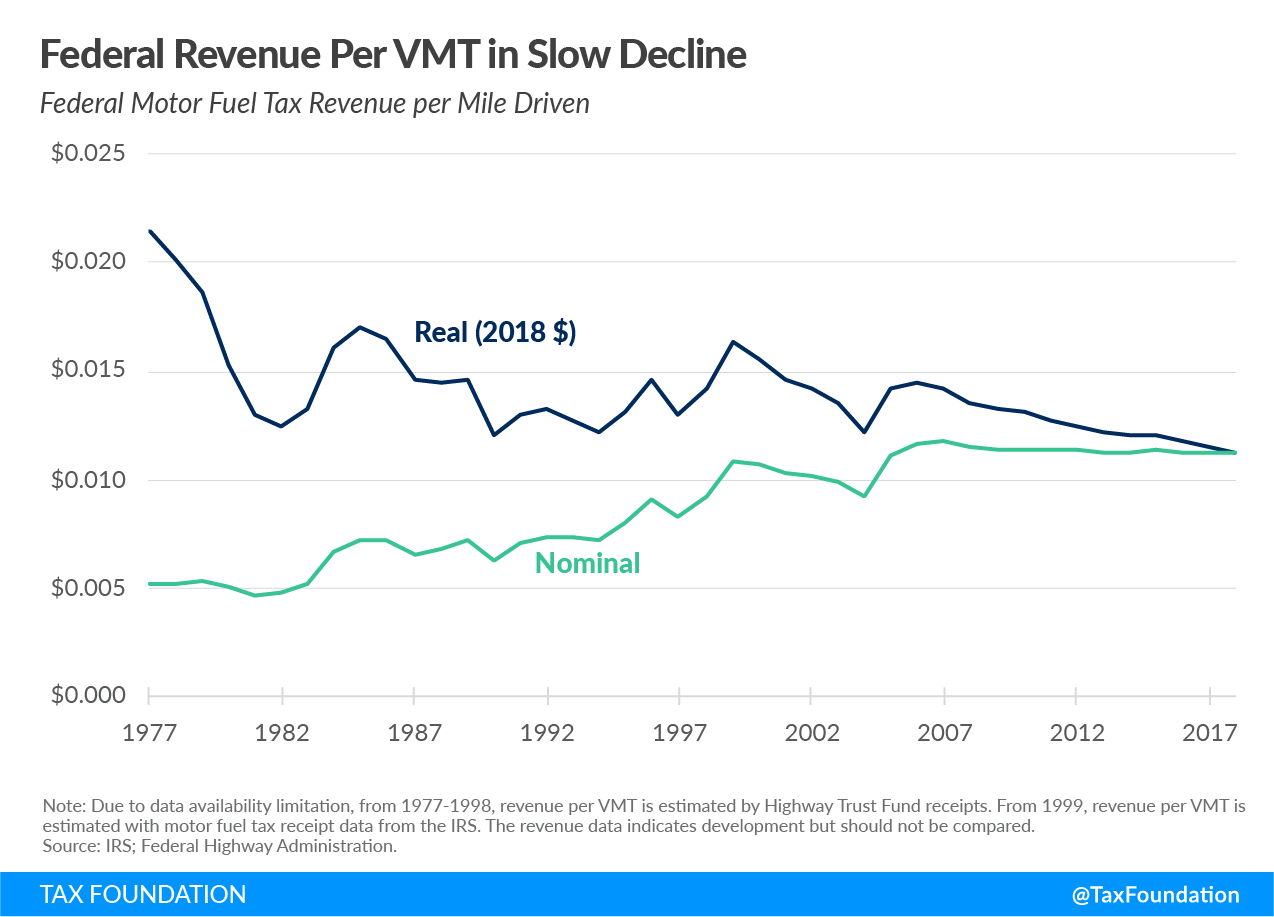
Federal revenue is more volatile than state revenue, as there is a spike in revenue after each tax increase, followed by a decline. The last spike occurred in 1994 (see Figure 4) and coincides with the latest federal motor tax increase. This behavior is consistent with other narrow-based excise taxes like cigarette taxes.[15] There is a relatively flat development in revenue collected per mile traveled in real terms following the latest federal tax increase. This may be explained by a consumer preference for larger vehicles: since the early 1980s, the SUV share of sales has increased. In fact, it climbed from 15 percent to 46 percent between 1996 and 2018. At the same time, the sale of cars dropped from above 60 percent to under 45 percent.[16] Additionally, MPG in new cars actually declined between 1985 and 2005.[17] This would have negatively impacted the average vehicle fuel economy as larger vehicles get less MPG than lighter vehicles. (Figure 7 shows historical MPG development for vehicle fleet.)
Figure 5.
Looking at total gas tax collections illustrates this decline. Federal gas tax collections in 2018 totaled $26.7 billion. Adjusted for inflation, that would be approximately $17.7 billion in 1994 (the first year after the last gas tax increase). The federal government actually collected $19.8 billion that year, which is almost 12 percent more. Combined with the fact that expenditures have not decreased, these numbers indicate that the system no longer lives up to the user-fee principle.
The development of total state and federal motor fuel tax burden per VMT can also be illustrated by calculating average tax paid (in 2018 dollars) per VMT by passenger cars (not including trucks and SUVs). In 1994, the first year after the latest federal tax hike, a passenger car averaged 20.7 MPG and drivers paid 3.2 cents in taxes per VMT.[18] In 2018, a passenger car averaged 24.4 MPG, and drivers paid 2.1 cents in taxes per VMT.[19] According to the Department of Transportation, the average driver drove 13,476 miles in 2018, so the decline in tax burden translates to a difference in annual tax payment of $148 if VMT were constant between 1994 and 2018.[20]
Breaking those numbers down at the state and federal level, the federal tax burden per VMT totaled 1.51 cents in 1994 versus 0.75 cents in 2018 , and the average state tax burden totaled 1.72 cents in 1994 versus 1.38 cents in 2018 (all in 2018 dollars).[21]
Based on that calculation, assuming that MPG climbs to 27.5 MPG (1.5 percent improvement a year for five years) in the coming years and tax rates remain flat, the tax burden per VMT would drop from 2.1 cents to 1.84 cents (2018 dollars). Such decline would result in a difference of approximately $7.7 billion in tax collections for state and federal highway funds.
Given that highway spending has not declined in line with revenues, motor fuel tax revenues are no longer matching expenditures. According to CBO estimates, the Highway Trust Fund will run out of money by the end of 2021 and the deficit is projected to be almost $70 billion over the first five years after the FAST Act funding expires.[22] Importantly, these projections were made before the coronavirus lockdowns, and actual revenue will almost certainly fall short of estimates.[23]
Figure 6.
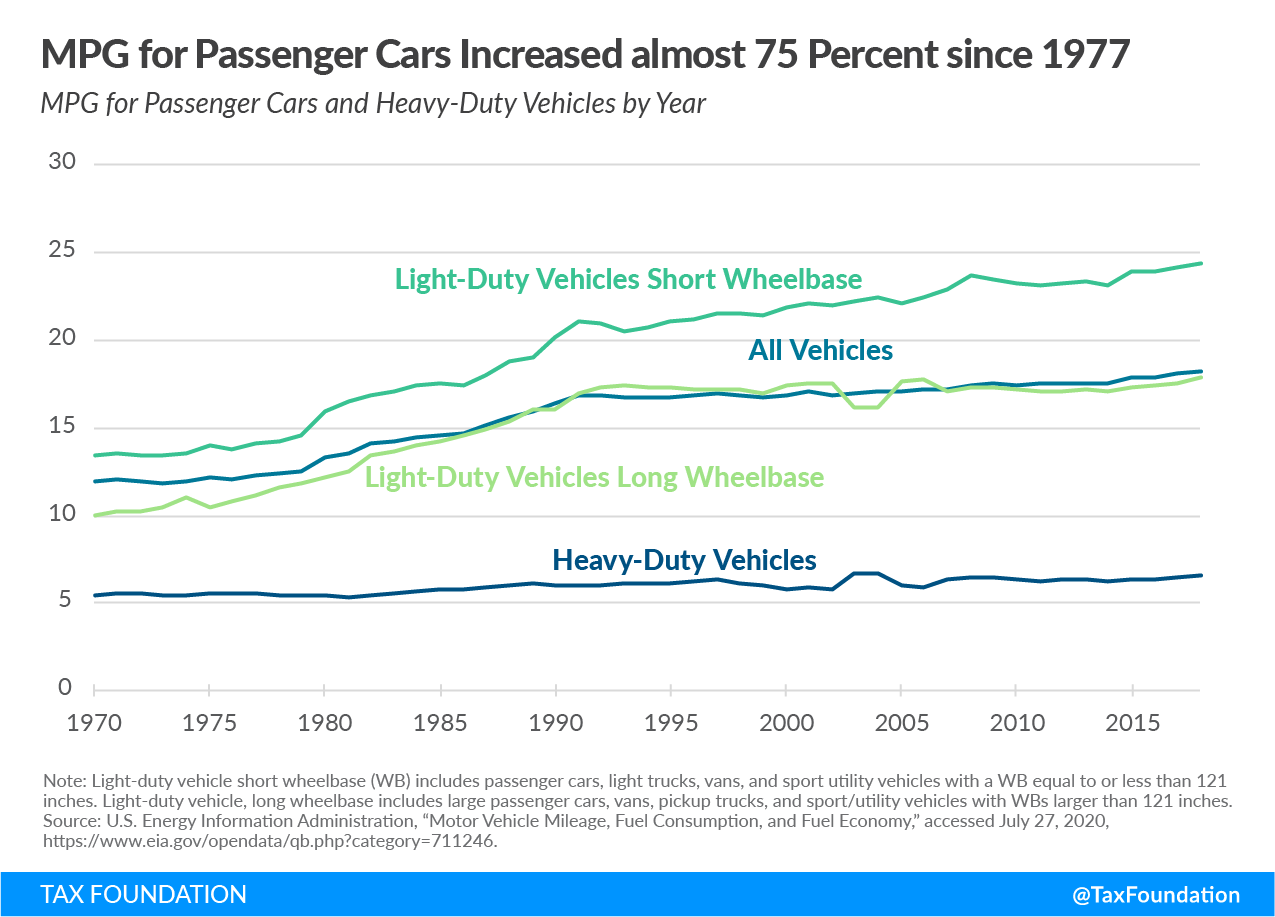
The picture is not as bleak for state highway funds. Based on Figure 1, states have done a better job of keeping rates in line with inflation than the federal government. Yet, just like federal revenue, state revenue per VMT is visibly impacted by CAFE standards. CAFE standards were first enacted in 1975 and have worked to improve fuel economy. Figure 7 is a graph showing the MPG by vehicle type by year that illustrates the big jump in the late 1970s. If another spike in MPG were to happen due to regulatory requirements or technological developments, the decline in revenue per VMT would accelerate. Currently the requirement under CAFE is to increase average MPG by 1.5 percent a year through 2026. Increased fuel economy is a positive development, but we should acknowledge that it undermines the current road funding regime and requires that policymakers adjust that regime moving forward.
Figure 7.
Another development that could make current tax design antiquated is growth in EV market share, which can also be regarded as positive in its own right. One report has EVs making up 17.5 percent of sales in the U.S. by 2028, and this could be devastating to tax collections. [24]
Furthermore, it is not given that maintenance cost per mile has grown at a similar rate as inflation. In fact, according to the CBO, in real terms, public maintenance purchases decreased 9 percent between 2003 and 2014 even though nominal spending increased 44 percent.[25] At the same time, personal vehicles have grown larger. Lower oil prices from the mid-1980s to mid-2000s increased the sale of SUVs, which are heavier than sedans, resulting in increased road damage. Weight is an exponential factor for road damage. As an example, an 80,000-pound 5-axle tractor trailer causes the same damage to a road as 9,600 cars even if it only weighs 20 times as much.[26]
When compared internationally, and controlling for exchange rate fluctuations, America’s gas tax has fallen, since 2013, behind its peers in the Organisation for Economic Cooperation and Development (OECD).[27]
In 2017, the average gas tax rate across the OECD was $2.24 per gallon, down about 15 percent from $2.62 in 2013. Thirty countries experienced declines in their gas tax levies in U.S. dollars. Since 2013, the American dollar has appreciated in value relative to other currencies, including the currency of many OECD member countries, the Euro. This has the effect of reducing the value of a nation’s gas tax levy in American dollars, making reductions in gas taxes across the OECD look larger in magnitude than they were. [28]
Taxing by Vehicle Miles Traveled
Given the challenges facing the motor fuel tax, one solution, long supported by many economists, is to fund highways by taxing vehicle miles traveled. Rather than using taxes on cars or motor fuel as a proxy for transportation, a tax levied directly on the miles gets much closer to capturing the externalities and to approximating the road maintenance cost of each driver.
Developing an equitable and effective VMT tax will be no small feat, though. The first law of tax writing is that tax design choices have trade-offs. For a VMT tax, the choices will be between a simple but less effective tax and a complex but more effective tax. Both a simple or more complex VMT tax would appear to be more sustainable choices compared to the current gas tax levy but would likely incur higher enforcement costs for tax-collecting governments.
The “Simple” Solution
A VMT tax could be implemented by either levying a flat fee per VMT or developing an advanced tracking system with different rates for different locations. A flat fee per mile based on vehicle weight measured by the odometer would be the simplest version of a VMT tax to administer and avoids most privacy issues. Odometer readings could be done at yearly inspections or by installing an on-board-unit (OBU) that electronically transmits VMT to a central computer.
A simple fee per VMT would not be equal across all vehicle types as it should be differentiated based on weight and number of axles. Road damage increases with weight of a vehicle but decreases based on the number of axles.[29] Basing the rate on weight per axle encourages commercial truckers to limit weight per axle.
The problem with a simple solution is that a simple rate per VMT severely limits the ability of the tax to properly target the tax beyond simple VMT and weight per axle. For instance, the current issue of the fuel tax taxing non-public roads use (e.g., fuel used on private roads or for farming equipment) would persist. It also makes it difficult to secure proper apportionment between states.
For instance, in a non-tracking system, drivers that live in Michigan but work in Illinois would only pay the tax in Michigan even though they drive in both Michigan and Illinois. Since the VMT tax works as a user fee, a system to secure some transfers between states and localities would need to be developed. This could potentially be accomplished by using standard traffic data to approximate the amount owed by commuter states to destination states. As an example, Washington, D.C. welcomes hundreds of thousands of daily commuters from neighboring states (mainly Maryland and Virginia) and should be compensated for the wear-and-tear on their infrastructure. In this example, commuter data would be used to calculate the allocation of revenue to the District of Columbia from those collected by Maryland and Virginia.
Another issue arises if a state imposes a VMT tax but does not have a federal VMT tax system to piggyback on. In Oregon, which is running a pilot project called OReGO, a voluntary GPS system determines only whether a registered vehicle is driving on a public road in Oregon.[30] That means the state continues to collect gas taxes on all motorists and offers a tax credit for fuel taxes paid.[31]
This is an example of one issue with VMT taxes: they could prove to be very expensive to administer and enforce. For instance, if every single motorist is liable to pay their own taxes to the government, the effective number of taxpayers would grow considerably compared to today’s system. The motor fuel tax, in contrast, is very simple and cheap to collect.[32]
One possible solution to this issue may be to mimic the way taxpayers currently pay gas taxes: at the pump. A VMT tax could be levied by proxy by pegging the motor fuel rate to the average MPG for vehicles in the state (or federal level) as well as inflation. Essentially, this approach would entail a unique kind of inflation indexing of gas taxes to roughly approximate revenue collections under a VMT. This would guarantee that motor fuel tax rates would follow developments both in technology and in inflation and maintain cents raised per VMT. Such a system could potentially also be levied on EVs by taxing battery charges based on the minimum distance an EV can drive on a full charge.[33] Another option may be to install systems at gas stations and in vehicles that communicate VMT information when filling the tank. This would allow gas stations to collect and remit VMT taxes similar to today, though it would require retrofitting vehicles in ways that could raise privacy and other legal concerns. (Potentially a standard, higher rate could apply to vehicles without such a device.)
Making sure that EVs are taxed appropriately for road usage would also make transportation taxes more equitable as access to expensive electric vehicles will no longer affect tax burdens. In Virginia, as of July 1, a highway use fee (HUF) is now levied on fuel-efficient vehicles (fuel economy of 25 MPG or greater) and electric motor vehicles. The highway use fee is calculated based on the gas tax rate at time of vehicle registration and average VMT in Virginia. Electric vehicles pay a flat fee ($88.20 in 2020) that reflects the 85 percent of amount paid in motor fuel taxes by an average Virginia driver. For fuel-efficient vehicles, the fee is calculated to reflect the 85 percent of the difference between motor fuel taxes paid on the fuel-efficient vehicle and motor fuel taxes paid by a vehicle driving 23.7 MPG.[34]
GPS Tracking
If both VMT and location are tracked, it would be possible to differentiate between urban and rural travel. While maintenance costs of driving in the city or in the country may not differ substantially, the externalities connected to urban travel may be higher: contribution to air pollution and congestion in particular. Location tracking would also allow states to levy taxes on all driving within the state—regardless of the home state of the vehicle. An argument could be made that shorter commutes would be punished under such a system, but congestion-prone urban areas would benefit from limiting the number of vehicles on the road.
Increasing the amount of detail tracked by the system increases the efficiency of the tax. The efficiency increases because basing the tax rate on several parameters would incentivize drivers to drive only when the benefits of the drive outweigh the cost. While including more parameters into the calculation of the tax rate could yield some positive results, it should probably only be pursued up to a point. Too many parameters would result in an increasingly complex tax design, which would make it less transparent.
Beside increasing efficiencies, GPS tracking may solve the issue of apportionmentApportionment is the determination of the percentage of a business’ profits subject to a given jurisdiction’s corporate income or other business taxes. U.S. states apportion business profits based on some combination of the percentage of company property, payroll, and sales located within their borders. but only if all states implement the system. If a state is alone in levying a VMT tax, a number of other issues appear. Out-of-state drivers would still have to be taxed but likely through a different system. In Oregon, even with a GPS system, the location of the vehicle is supposedly never disclosed to anyone but the driver.[35] This may resolve some of the privacy concerns but leaves questions for how to handle out-of-state drivers.
Privacy Concerns
Beside the issue of conformity among the states are concerns over data privacy—especially if GPS were used to track vehicles. Handing over data about your vehicle’s location at all times is understandably unpopular, especially when that information is supplied to a government entity which may have less reason to resist a subpoena than, for instance, a private company like a cell phone provider.[36] Nonetheless, there may be ways to mitigate this. For instance, having a private third party gather and own the data would keep personal data at an arm’s length from the authorities. To strengthen privacy protection, there should also be strict regulation governing data deletion and permissible data use. Oregon has been running a pilot project on VMT taxes which requires data to be deleted within 30 days after collection.[37] Use of GPS in Oregon is voluntary to alleviate privacy concerns, though a voluntary system can only work in parallel with a gas tax, which is not a permanent solution.
According to a GAO analysis from 2012, in a survey of state DOT officials, 45 out of 51 (including D.C.) said that addressing privacy-related concerns would present a great challenge to developing a mileage fee program in their state.[38]
Privacy concerns have merit and must be considered, even if the data was handled by a third-party company. Information from E-ZPass, an electronic toll collection system, has been used by divorce lawyers to prove unfaithful spouses.[39]
The issue of privacy is not a small issue. In 2012, the United States Supreme Court ruled that unwarranted GPS tracking of vehicles was unconstitutional.[40] Devising a tracking system that does not run afoul of the Constitution is obviously a prerequisite for using GPS tracking.
| Tracking Method | Type | Options for Efficiency | Privacy Concerns |
|---|---|---|---|
|
Odometer |
Manual | Limited | Limited |
|
On board unit measuring and transmitting VMT |
Automatic | Limited | Limited |
|
Pay at pump |
Automatic | Limited | Limited |
|
GPS |
Automatic | Numerous | Numerous |
| Source: Author’s analysis. | |||
What Can Be Done in The Short Term?
Given the difficulties surrounding a universal VMT tax, one short-term solution may be to levy a simple VMT tax on commercial vehicles and EVs. Commercial vehicles are subject to VMT taxes in four states (Kentucky, New Mexico, New York, and Oregon) and several other countries.[41] Kentucky has a flat rate of 2.9 cents per VMT for combination trucks weighing above 60,000 pounds. New Mexico, New York, and Oregon have a gradually increasing tax based on vehicle weight (tax kicks in at different rates). All four states mainly levy the tax based on periodic odometer readings.[42]
In the U.S., commercial vehicles are often tracked as their diesel tax payments are distributed among the states that trucks drive through. Converting the existing system to a VMT tax could make tax collection more effective as trucking companies would not have to deal with apportioning tax payments to each state; it could be relatively automatic. Tractor trailers and heavy-duty trucks also contribute significantly to overall road damage given their weight. According to the CBO, a federal 5-cent per mile tax on commercial trucks would have raised between $4 billion and $13 billion in 2017 depending on type of trucks and roads taxed.[43] Another solution may be to expand existing toll and road pricing systems, focusing on congested areas.
Matching Federal Outlays Would Result in Federal Rate Increase
Outlays are projected to outpace current revenue by a cumulative $189 billion over the next decade.[44] These projections were made prior to the coronavirus pandemic, which means that actual numbers will likely be worse. If the current structure is preserved, for revenues to match expenses, the federal rate would have to increase by 12.6 cents to 31 cents per gallon and be adjusted regularly to follow increasing costs of road maintenance.[45]
A simple federal VMT tax would, based on 2018 data, be 1.4 cents per VMT to raise enough revenue to pay for highway expenses ($46 billion). If the VMT tax would fund the transit account, as the gas tax has, expenditures would total $55 billion, and the rate would have to be 1.7 cents per mile. That rate is an average rate for all vehicles but should ideally be lower for passenger cars and higher for heavier vehicles. That differentiation would respect the different costs of road maintenance associated with heavier vehicles.
Table 2 is an example of how differentiation of rates could look based on mileage information from 2018.
| Type of Vehicle | VMT 2018 (millions) | Percentage of Total VMT | Tax Rate per VMT | Tax Revenue (billion) |
|---|---|---|---|---|
|
Passenger car |
2,897,083 | 89% | 1.2 cents | $34.8 |
|
Motorcycle |
20,076 | 1% | 0.6 cents | $0.12 |
|
Commercial traffic |
304,864 | 9% | 6.5 cents | $19.8 |
|
Bus |
18,303 | 1% | 5 cents | $0.92 |
|
Total |
3,240,327 | 100% | 1.7 cents | $55.6 |
| Source: Bureau of Transportation; author’s calculations.
Note: Passenger cars includes both smaller vehicles as well as SUVs, vans, and pick-up trucks. Commercial traffic includes both large tractor trailers and smaller freight trucks. Totals may not match due to rounding. |
||||
This is an example of differentiation based on certain assumptions and could be refined further. The higher rates for buses and commercial traffic represent the greater road damage caused by these vehicles, similar to the existing differentiated rates on gasoline and diesel. Motorcycles get the lowest rate as they cause the least damage and contributes the least to congestion. While the numbers would be different for states, a similar calculation could be made for each state (see Appendix A).
Implementing a rate schedule as in Table 2 would represent a tax increase on consumers and businesses, since it is calculated to cover all transportation funding, which current transportation taxes fail to do. These increases do not happen in a vacuum and would hurt the economy as a whole as well as disproportionately tax the bottom quintiles of income earners. To address these concerns, any increase in the gas or VMT tax would be best offset by a tax cut of an equal dollar amount.[46]
Maybe there is another solution for the federal government: federal lawmakers could cut back on highway spending and supplement transportation spending by encouraging private sector investment through public-private partnerships (P3). According to the CBO, returns on private investment will be twice as large as federal investments.[47] A P3 is an alternative to traditional public funding of transportation projects in which a local, state, or federal agency partners with a private company to take funding in exchange for a new revenue source. The government agency maintains accountability to the public.
Private investment can be designed in several ways, including as toll roads, that guarantees the investor a revenue stream. In Maryland, a large P3 project to build tolled express lanes to I-495 and I-270 is underway.[48] However, according to federal law, not all roads can be toll roads.[49] Hence, they can also be structured with regular payments from government to the private company financing highway projects.
Given the financial situation many states find themselves in due to the coronavirus pandemic, it may be necessary for states to involve private investment to fund crucial projects.
How Roads Are Funded Today
The amount of state and local road spending covered by gas taxes, tolls, user fees, and user taxes varies widely among states. In order to truly live up to the benefit principle and user fee ideal, the taxes collected on transportation would be sufficient to cover transportation expenditures. This is, however, not the case, as shown in Table 3:
| State | State and Local Transportation Tax Revenue | Amount Covered by General Taxes and Fees | State Share of Highway Spending |
|---|---|---|---|
| Alabama | $941,715,000 | $810,964,722 | $1,752,679,722 |
| Alaska | $184,319,000 | $712,463,213 | $896,782,213 |
| Arizona | $1,097,747,000 | $666,898,710 | $1,764,645,710 |
| Arkansas | $654,643,000 | $887,667,811 | $1,542,310,811 |
| California | $ 10,137,811,000 | $1,619,201,541 | $11,757,012,541 |
| Colorado | $1,566,620,000 | $1,152,379,808 | $2,718,999,808 |
| Connecticut | $725,253,000 | $1,034,139,057 | $1,759,392,057 |
| Delaware | $512,352,000 | $153,673,299 | $666,025,299 |
| Florida | $7,034,900,000 | $2,287,321,032 | $9,322,221,032 |
| Georgia | $2,172,864,000 | $852,092,920 | $3,024,956,920 |
| Hawaii | $553,374,000 | -$124,808,237 | $428,565,763 |
| Idaho | $596,359,000 | -$6,490,909 | $589,868,091 |
| Illinois | $4,629,620,000 | $3,255,343,903 | $7,884,963,903 |
| Indiana | $1,216,444,000 | $247,113,131 | $1,463,557,131 |
| Iowa | $1,337,942,000 | $905,862,059 | $2,243,804,059 |
| Kansas | $843,606,000 | $691,120,606 | $1,534,726,606 |
| Kentucky | $976,893,000 | $694,917,525 | $1,671,810,525 |
| Louisiana | $772,213,000 | $910,504,860 | $1,682,717,860 |
| Maine | $515,538,000 | $282,888,627 | $798,426,627 |
| Maryland | $2,341,949,000 | $411,279,513 | $2,753,228,513 |
| Massachusetts | $2,171,726,000 | $1,032,237,393 | $3,203,963,393 |
| Michigan | $2,553,562,000 | $644,527,901 | $3,198,089,901 |
| Minnesota | $1,889,662,000 | $2,250,053,546 | $4,139,715,546 |
| Mississippi | $617,654,000 | $614,281,435 | $1,231,935,435 |
| Missouri | $1,063,727,000 | $330,873,678 | $1,394,600,678 |
| Montana | $365,114,000 | $57,464,775 | $422,578,775 |
| Nebraska | $583,223,000 | $693,347,345 | $1,276,570,345 |
| Nevada | $813,580,000 | $842,529,761 | $1,656,109,761 |
| New Hampshire | $413,490,000 | $173,921,212 | $587,411,212 |
| New Jersey | $3,495,452,000 | $468,005,098 | $3,963,457,098 |
| New Mexico | $470,151,000 | $55,834,218 | $525,985,218 |
| New York | $7,759,269,000 | $2,734,180,484 | $10,493,449,484 |
| North Carolina | $2,901,360,000 | $892,549,259 | $3,793,909,259 |
| North Dakota | $333,070,000 | $1,145,820,931 | $1,478,890,931 |
| Ohio | $3,267,627,000 | $1,418,611,434 | $4,686,238,434 |
| Oklahoma | $1,516,947,000 | $426,439,319 | $1,943,386,319 |
| Oregon | $1,203,853,000 | $404,003,095 | $1,607,856,095 |
| Pennsylvania | $5,423,505,000 | $2,675,168,723 | $8,098,673,723 |
| Rhode Island | $161,908,000 | $86,461,691 | $248,369,691 |
| South Carolina | $1,046,433,000 | $557,663,542 | $1,604,096,542 |
| South Dakota | $317,654,000 | $395,089,026 | $712,743,026 |
| Tennessee | $1,399,299,000 | -$29,699,222 | $1,369,599,778 |
| Texas | $8,336,258,000 | $3,547,167,602 | $11,883,425,602 |
| Utah | $705,139,000 | $766,991,878 | $1,472,130,878 |
| Vermont | $160,876,000 | $252,869,379 | $413,745,379 |
| Virginia | $2,074,549,000 | $1,805,458,238 | $3,880,007,238 |
| Washington | $3,043,001,000 | $652,123,967 | $3,695,124,967 |
| West Virginia | $502,047,000 | $276,326,610 | $778,373,610 |
| Wisconsin | $1,718,939,000 | $3,002,610,882 | $4,721,549,882 |
| Wyoming | $214,030,000 | $201,703,907 | $415,733,907 |
| District of Columbia | $ 76,920,000 | $214,086,702 | $291,006,702 |
| U.S. Total | $ 95,412,187,000 | $46,033,237,000 | $ 141,445,424,000 |
| Source: Author’s calculations from the U.S. Census Bureau, State and Local Government Finance, and Federal Highway Administration. | |||
| Note: Revenue includes motor fuel taxes, motor vehicle taxes, and highway fees. | |||
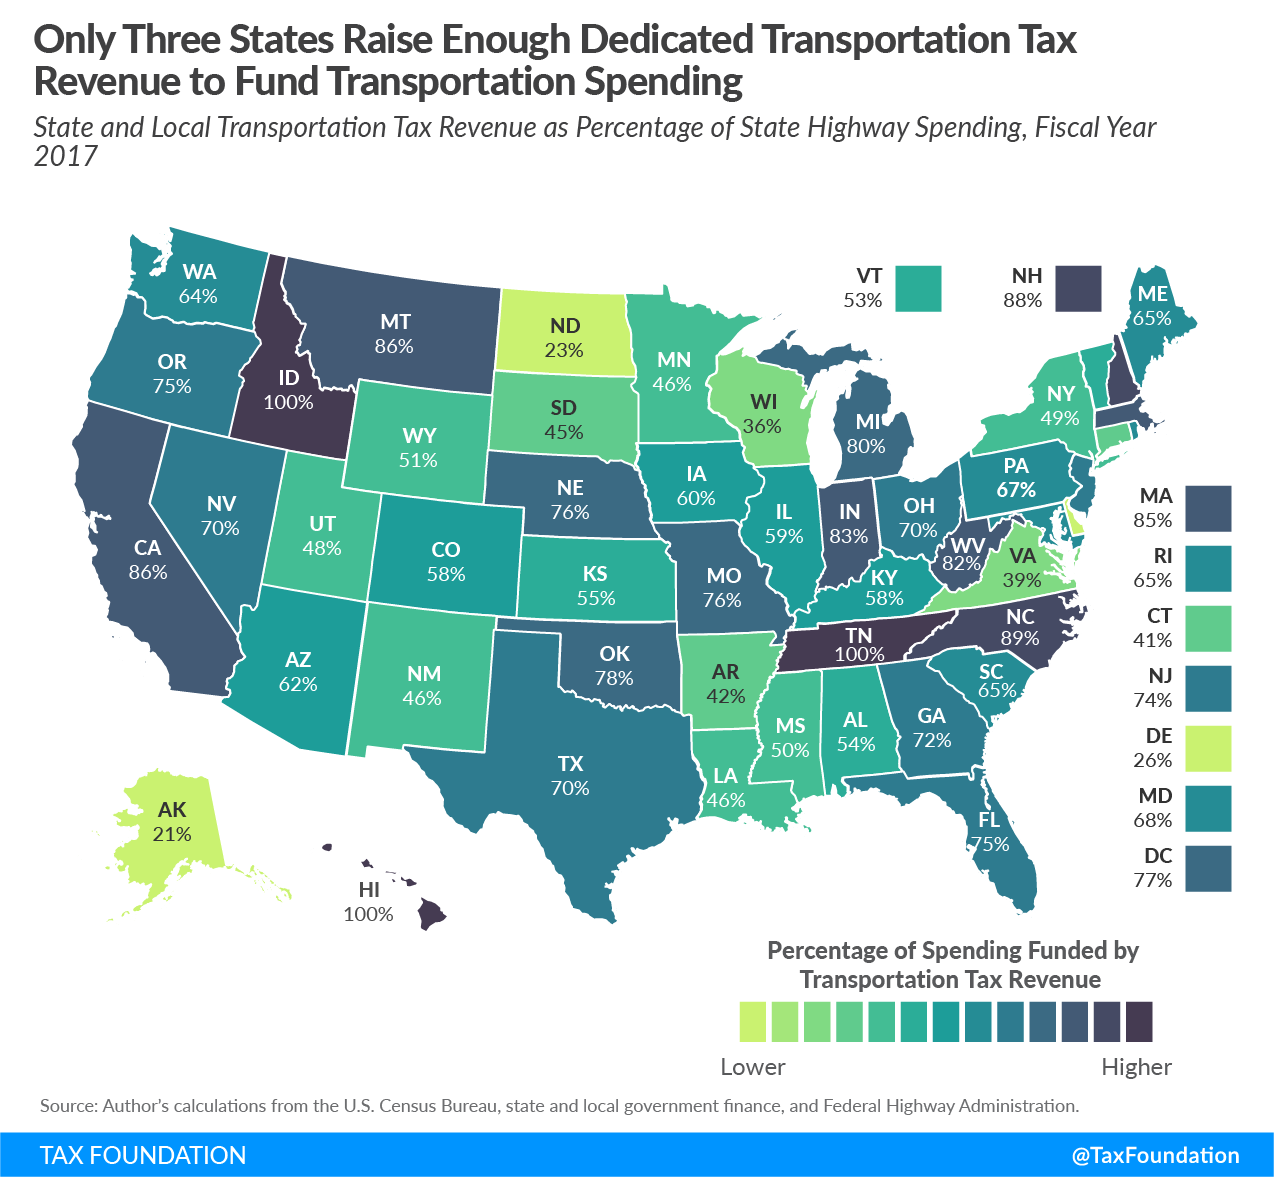
Almost every state spends more on highways than they collect in dedicated revenue from federal, state, and local sources. The only exceptions are Hawaii, Idaho, and Tennessee. That means the rest of the expenditures are covered by non-transportation-related tax revenues (see Table 3) collected from people who may not use the roads, or activity not related to road use.
The argument could be made that everyone benefits from a well-maintained network of roads, for instance, to transport goods around the country, and as such, everyone should contribute. However, for consumers the cost of transportation is passed on through the price they pay for those goods. This discrepancy between revenue and expenditures breaks with the user-fee principle and limits the effectiveness of taxes on transportation by keeping the price of driving artificially low.
These figures do not tell the whole story though. In total, 25 states divert a significant amount of revenue raised from motor fuel taxes to unrelated spending programs like education (Kansas and Texas), tourism (Utah), or wildlife conservation (Florida).[50] This practice further dilutes the concept of motor fuel taxes as a user fee.
Figure 8 is a map showing the percentage of state highway spending that could be covered by dedicated funds. In the contiguous 48 states, Tennessee could wholly cover spending with dedicated transportation revenues (100 percent), while North Dakota only raises less than a quarter of the revenue required to pay for transportation spending (23 percent).
Figure 8.
To solve the issue, some states find other funding sources outside motor fuel taxes. For instance, Arkansas has, since 2012, dedicated part of the general sales tax levy (0.5 percent of the rate) to roads and bridges. This tax is set to expire in 2022 but this year voters get to decide whether to make it permanent.[51] If Arkansas lawmakers want to adhere to the benefit principle, it would be appropriate to raise the revenue through transportation-related taxes instead.
Federal funds are apportioned to the states according a formula determined under the FAST Act. The formula includes factors of each state’s share of lane miles of federal aid highways, vehicle miles traveled on federal aid highways, and number of fatalities on the federal aid system. The law also guarantees that any state receives 95 cents on the dollar contributed to the Highway Trust Fund by a state’s residents.
Table 4 enumerates the amounts allocated to each state for highway projects from the federal government in FY 2017.
| (Federal Highway Funding by State, Fiscal Year 2017) | |
|---|---|
| State | Federal Support |
| Alabama | $780,395,278 |
| Alaska | $515,767,787 |
| Arizona | $752,604,290 |
| Arkansas | $532,561,189 |
| California | $3,775,361,459 |
| Colorado | $550,041,192 |
| Connecticut | $516,638,943 |
| Delaware | $174,000,701 |
| Florida | $1,948,889,968 |
| Georgia | $1,328,160,080 |
| Hawaii | $173,975,237 |
| Idaho | $294,207,909 |
| Illinois | $1,462,439,097 |
| Indiana | $980,122,869 |
| Iowa | $505,524,941 |
| Kansas | $388,712,394 |
| Kentucky | $683,445,475 |
| Louisiana | $721,940,140 |
| Maine | $189,877,373 |
| Maryland | $618,136,487 |
| Massachusetts | $624,728,607 |
| Michigan | $1,083,010,099 |
| Minnesota | $670,744,454 |
| Mississippi | $497,487,565 |
| Missouri | $973,780,322 |
| Montana | $422,038,225 |
| Nebraska | $297,314,655 |
| Nevada | $373,512,239 |
| New Hampshire | $169,952,788 |
| New Jersey | $1,027,035,902 |
| New Mexico | $377,737,782 |
| New York | $1,726,595,516 |
| North Carolina | $1,072,800,741 |
| North Dakota | $255,373,069 |
| Ohio | $1,378,785,566 |
| Oklahoma | $652,363,681 |
| Oregon | $514,134,905 |
| Pennsylvania | $1,687,703,277 |
| Rhode Island | $224,957,309 |
| South Carolina | $688,789,458 |
| South Dakota | $290,082,974 |
| Tennessee | $869,218,222 |
| Texas | $3,812,222,398 |
| Utah | $357,179,122 |
| Vermont | $208,763,621 |
| Virginia | $1,046,743,762 |
| Washington | $697,316,033 |
| West Virginia | $449,523,390 |
| Wisconsin | $773,964,118 |
| Wyoming | $263,516,093 |
| District of Columbia | $164,126,298 |
| Total | $40,544,305,000 |
| Source: Federal Highway Administration, “Apportionment of Federal Funds,” May 8, 2020, https://www.fhwa.dot.gov/policyinformation/statistics/2018/fa4.cfm. | |
Conclusion
Vehicle miles taxes may prove a more sustainable replacement for the motor fuel taxes in the future. Instead of using fuel as a proxy for road usage, taxing actual usage would better respect the benefit principle and guarantee that the tax acts as a user fee. A differentiated VMT tax based on driving location, and perhaps even time of travel, could also more precisely capture the externalities related to transportation.
At the federal level, the Highway Trust Fund is projected to run out of money by the end of next year. It remains highly unlikely that a federal VMT tax could be implemented as a replacement to the motor fuel taxes so soon. A more near-term solution needs to be devised that fixes the trust fund, whether it is spending reform, funding reform, or some combination of the two.
At the state level, a similar challenge exists, though it is less immediate. As vehicles continue to improve in fuel economy and EVs become more common, a VMT tax represents a natural solution to funding highway projects in the future. States have an added complication regarding out-of-state drivers if no federal system exists.
On both a federal and a state level, imposing a VMT tax does require lawmakers to make some hard decisions on trade-offs. Significant concerns regarding privacy must be addressed against a desire for a targeted, equitable, and efficient tax. A good option to increase authorities’ expertise with the system would be to implement VMT taxes on commercial freight vehicles. These vehicles cause most of the road damage, and privacy concerns are limited as the vehicles are often already tracked.
Appendix: State VMT Tax Rates
The following table presents VMT tax rates for each state which would raise the same amount of revenue as the current state and local motor fuel taxes, motor license taxes, and highway fees. They do not estimate the appropriate differentiation between heavy and light vehicles.
| State | Transportation Tax Revenue (2018) | Vehicle Miles Traveled in 2018 (millions) | Average Tax Rate per Mile |
|---|---|---|---|
| Alabama | $941,715,000 | 71,167 | $0.013 |
| Alaska | $184,319,000 | 5,487 | $0.034 |
| Arizona | $1,097,747,000 | 66,145 | $0.017 |
| Arkansas | $654,643,000 | 36,675 | $0.018 |
| California | $10,137,811,000 | 348,796 | $0.029 |
| Colorado | $1,566,620,000 | 53,954 | $0.029 |
| Connecticut | $725,253,000 | 31,596 | $0.023 |
| Delaware | $512,352,000 | 10,179 | $0.050 |
| District of Columbia | $ 76,920,000 | 3,691 | $0.021 |
| Florida | $7,034,900,000 | 221,816 | $0.032 |
| Georgia | $2,172,864,000 | 131,456 | $0.017 |
| Hawaii | $553,374,000 | 10,887 | $0.051 |
| Idaho | $596,359,000 | 17,709 | $0.034 |
| Illinois | $4,629,620,000 | 107,954 | $0.043 |
| Indiana | $1,216,444,000 | 81,529 | $0.015 |
| Iowa | $1,337,942,000 | 33,282 | $0.040 |
| Kansas | $843,606,000 | 32,190 | $0.026 |
| Kentucky | $976,893,000 | 49,544 | $0.020 |
| Louisiana | $772,213,000 | 50,045 | $0.015 |
| Maine | $515,538,000 | 14,784 | $0.035 |
| Maryland | $2,341,949,000 | 59,775 | $0.039 |
| Massachusetts | $2,171,726,000 | 66,772 | $0.033 |
| Michigan | $2,553,562,000 | 102,398 | $0.025 |
| Minnesota | $1,889,662,000 | 60,438 | $0.031 |
| Mississippi | $617,654,000 | 40,730 | $0.015 |
| Missouri | $1,063,727,000 | 76,595 | $0.014 |
| Montana | $365,114,000 | 12,700 | $0.029 |
| Nebraska | $583,223,000 | 20,975 | $0.028 |
| Nevada | $813,580,000 | 28,319 | $0.029 |
| New Hampshire | $413,490,000 | 13,776 | $0.030 |
| New Jersey | $3,495,452,000 | 77,539 | $0.045 |
| New Mexico | $470,151,000 | 27,288 | $0.017 |
| New York | $7,759,269,000 | 123,510 | $0.063 |
| North Carolina | $2,901,360,000 | 121,127 | $0.024 |
| North Dakota | $333,070,000 | 9,856 | $0.034 |
| Ohio | $3,267,627,000 | 114,474 | $0.029 |
| Oklahoma | $1,516,947,000 | 45,433 | $0.033 |
| Oregon | $1,203,853,000 | 36,848 | $0.033 |
| Pennsylvania | $5,423,505,000 | 102,109 | $0.053 |
| Rhode Island | $161,908,000 | 8,009 | $0.020 |
| South Carolina | $1,046,433,000 | 56,801 | $0.018 |
| South Dakota | $317,654,000 | 9,719 | $0.033 |
| Tennessee | $1,399,299,000 | 81,321 | $0.017 |
| Texas | $8,336,258,000 | 282,037 | $0.030 |
| Utah | $705,139,000 | 32,069 | $0.022 |
| Vermont | $160,876,000 | 7,346 | $0.022 |
| Virginia | $2,074,549,000 | 85,336 | $0.024 |
| Washington | $3,043,001,000 | 62,367 | $0.049 |
| West Virginia | $502,047,000 | 19,447 | $0.026 |
| Wisconsin | $1,718,939,000 | 65,885 | $0.026 |
| Wyoming | $214,030,000 | 10,438 | $0.021 |
| Source: U.S. Census Bureau; Federal Highway Administration; author’s calculations. | |||
[1] Liz Malm, “When Did Your State Enact Its Gas Tax?” Tax Foundation, July 30, 2015, https://taxfoundation.org/when-did-your-state-enact-its-gas-tax/.
[2] Carl Davis, “How Long Has It Been Since Your State Raised Its Gas Tax?” Institute on Taxation and Economic Policy, Feb. 26, 2020, https://itep.org/how-long-has-it-been-since-your-state-raised-its-gas-tax-maps/.
[3] Congressional Budget Office, “Highway Trust Fund Accounts—CBO’s Baseline as of March 6, 2020,” Mar. 19, 2020, https://www.cbo.gov/system/files/2020-03/51300-2020-03-highwaytrustfund.pdf.
[4] Robert S. Kirk and William J. Mallett, “Funding and Financing Highways and Public Transportation,” Congressional Research Service, May 11, 2020, https://fas.org/sgp/crs/misc/R45350.pdf.
[5] Liz Malm, “When Did Your State Enact Its Gas Tax?”
[6] American Petroleum Institute, “Gasoline Taxes,” July 2020, https://www.api.org/~/media/Files/Statistics/State-Motor-Fuel-Taxes-Charts-July-2020.pdf.
[7] Ibid.
[8] Amir El-Sibaie, “Electric Vehicles Will Have a Long-Term Impact on the Gas Tax,” Tax Foundation, Feb. 12, 2018, https://taxfoundation.org/electric-vehicles-gas-tax/.
[9] This includes both direct users like drivers, but also people who indirectly benefit from highways and road infrastructure (e.g., supply chains and transportation for goods and services), which would be reflected in market prices.
[10] United States Department of Transportation, “Corporate Average Fuel Economy,” Mar. 31, 2020,
https://www.nhtsa.gov/laws-regulations/corporate-average-fuel-economy.
[11] Amir El-Sibaie, “Electric Vehicles Will Have a Long-Term Impact on the Gas Tax.”
[12] U.S. Energy Information Administration, “Annual Energy Outlook 2020,” January 2020, 96, https://www.eia.gov/outlooks/aeo/pdf/aeo2020.pdf.
[13] Laura Bliss, “Should Electric Vehicle Drivers Pay Per Mile?” Bloomberg, July 23, 2019, https://www.bloomberg.com/news/articles/2019-07-23/why-charging-electric-cars-for-road-use-is-tricky.
[14] EVAdoption, “EV Sales Forecasts,” accessed July 9, 2020, https://evadoption.com/ev-sales/ev-sales-forecasts/.
[15] Ulrik Boesen and Tom VanAntwerp, “How Stable is Cigarette Tax Revenue?” Tax Foundation, July 9. 2020,
https://taxfoundation.org/cigarette-tax-revenue-tool/.
[16] Mike Monticello, “America’s Favorite Cars: SUVs,” Consumer Reports, Feb. 28, 2017, https://www.consumerreports.org/suvs/americas-favorite-cars-suvs/; Jerry Edgerton, “SUVs are running sedans off the American roads,” CBS News, May 3, 2018, https://www.cbsnews.com/news/suvs-are-running-sedans-off-the-american-roads/; and United States Environmental Protection Agency, “The 2019 EPA Automotive Trends Report,” March 2020, 6, https://nepis.epa.gov/Exe/ZyPDF.cgi?Dockey=P100YVK3.pdf.
[17] United States Environmental Protection Agency, “The 2019 EPA Automotive Trends Report,” 8.
[18] U.S. Energy Information Administration, “Annual Energy Review 2012,” Sept. 27, 2012,
https://www.eia.gov/totalenergy/data/annual/showtext.php?t=pTB0208.
[19] U.S. Energy Information Administration, “Light-Duty Vehicles, Short Wheelbase Fuel Economy, Annual,” accessed July 2020, https://www.eia.gov/opendata/qb.php?category=711246&sdid=TOTAL.PCFRRUS.A.
[20] This example only accounts for passenger cars traveling on public roads and highways. Toll payments are excluded from the calculation. A constant VMT is used to illustrate the difference in tax revenue collected per VMT.
[21] This example only accounts for passenger cars traveling on public roads and highways. Toll payments are excluded from the calculation.
[22] Congressional Budget Office, “Highway Trust Fund Accounts—CBO’s Baseline as of March 6, 2020.”
[23] Ulrik Boesen, “Gas Tax Revenue to Decline as Traffic Drops 38 Percent,” Tax Foundation, Mar. 31, 2020,
https://taxfoundation.org/gas-tax-revenue-decline-as-traffic-drops/.
[24] EVAdoption, “EV Sales Forecasts.”
[25] Congressional Budget Office, “Public Spending on Transportation and Water Infrastructure, 1956 to 2014,” March 2015, 1, https://www.cbo.gov/sites/default/files/114th-congress-2015-2016/reports/49910-infrastructure.pdf.
[26] U.S. Comptroller General, “Excessive Truck Weight: An Expensive Burden We Can No Longer Support,” July 16, 1979, 23, https://www.gao.gov/assets/130/127292.pdf.
[27] Garrett Watson, “How High are Other Nations’ Gas Taxes?” Tax Foundation, May 2, 2019,
https://taxfoundation.org/oecd-gas-tax/.
[28] Garrett Watson, “America’s Gas Tax Falls Further Behind OECD Peers When Controlling for Exchange Rates,” Tax Foundation, May 24, 2019, https://taxfoundation.org/federal-gas-tax-falls-behind-oecd-peers/.
[29] Congressional Budget Office, “Testimony of Joseph Kile: The Highway Trust Fund and Paying for Highways,” May 17, 2011, 31, https://www.cbo.gov/sites/default/files/112th-congress-2011-2012/reports/05-17-highwayfunding.pdf.
[30] OReGO, “Get started FAQ,” accessed July 21, 2020, https://www.myorego.org/get-started/#faq.
[31] This system requires motorists to keep receipts for fuel purchases to guarantee the accuracy of the tax creditA tax credit is a provision that reduces a taxpayer’s final tax bill, dollar-for-dollar. A tax credit differs from deductions and exemptions, which reduce taxable income rather than the taxpayer’s tax bill directly. , though it is not mandatory. See OReGO, “Get started FAQ.”
[32] Congressional Budget Office, “Reauthorizing Federal Highway Programs: Issues and Options,” May 2020, 6, https://www.cbo.gov/system/files/2020-05/56346-CBO-Highway-Reauthorization.pdf.
[33] A solution would need to be devised for at-home charging stations.
[34] From 2022, Virginia plans to implement an optional VMT tax for vehicle owners subject to the Highway Use Fee. Va. Code §§ 46.2-770, § 46.2-771, § 46.2-772, and § 46.2-773.
[35] OReGO, “Get started FAQ.”
[36] United States Government Accountability Office, “Highway Trust Fund: Pilot Program Could Help Determine the Viability of Mileage Fees for Certain Vehicles,” December 2012, 19, https://www.gao.gov/assets/660/650863.pdf.
[37] Oregon Legislature, “Senate Bill 810,” https://gov.oregonlive.com/bill/2013/SB810/.
[38] United States Government Accountability Office, “Highway Trust Fund: Pilot Program Could Help Determine the Viability of Mileage Fees for Certain Vehicles,” 19.
[39] Chris Newmarker, “E-ZPass Records Out Cheaters in Divorce Court,” Associated Press, Aug. 10, 2007, http://www.nbcnews.com/id/20216302/ns/technology_and_science-tech_and_gadgets/t/e-zpass-records-out-cheaters-divorce-court/.
[40]United States v. Jones, 565 U.S. 400 (2012), https://supreme.justia.com/cases/federal/us/565/400/.
[41] Congressional Budget Office, “Issues and Options for a Tax on Vehicle Miles Traveled by Commercial Trucks,” October 2019, 5, https://www.cbo.gov/system/files/2019-10/55688-CBO-VMT-Tax.pdf.
[42] Ibid.
[43] Congressional Budget Office, “Reauthorizing Federal Highway Programs: Issues and Options,” 8.
[44] Ibid., 5.
[45] According to the CBO, a 1-cent increase in the gas tax increases revenue by $1.5 billion over 10 years. See Congressional Budget Office, “The Highway Trust Fund and the Treatment of Surface Transportation Programs in the Federal Budget,” June 11, 2014, http://www.cbo.gov/sites/default/files/45416-TransportationScoring.pdf.
[46] Kyle Pomerleau, “Options to Fix the Highway Trust Fund,” Tax Foundation, Mar. 5, 2015,
https://taxfoundation.org/options-fix-highway-trust-fund/.
[47] Scott A. Hodge, “Cautionary Notes from CBO on the Effects of Federal Investment,” Tax Foundation, June 17, 2020, https://taxfoundation.org/federal-infrastructure-bill-cbo-effects-of-federal-investment/.
[48] Jim Parsons, “Maryland Shortlists Four Teams for Planned $11B P3 Highway Project,” Engineering News-Record, July 20, 2020, https://www.enr.com/articles/49743-maryland-shortlists-four-teams-for-planned-11b-p3-highway-project.
[49] Federal Highway Administration, “Why Does the Interstate System Include Toll Facilities?” Sept. 8, 2017, https://www.fhwa.dot.gov/infrastructure/tollroad.cfm.
[50] Baruch Feigenbaum and Joe Hillman, “How Much Gas Tax Money States Divert Away From Roads,” Reason Foundation, June 30, 2020, https://reason.org/policy-brief/how-much-gas-tax-money-states-divert-away-from-roads/#new-york-diversions.
[51] Ballotpedia, “Arkansas Transportation Sales TaxA sales tax is levied on retail sales of goods and services and, ideally, should apply to all final consumption with few exemptions. Many governments exempt goods like groceries; base broadening, such as including groceries, could keep rates lower. A sales tax should exempt business-to-business transactions which, when taxed, cause tax pyramiding. Continuation Amendment (2020),” accessed July 27, 2020, https://ballotpedia.org/Arkansas_Transportation_Sales_Tax_Continuation_Amendment_(2020).
Share this article