Key Findings
- Thanks to elevated deficits and interest rates, fiscal restraint is back in Washington.
- While substantially reversing America’s fiscal situation requires structural reforms to entitlements and taxes broadly, reforming transportation funding would also help.
- The user-pays principle is a sound way to fund major infrastructure projects.
- Unfortunately, the US has moved away from the user-pays model, primarily due to the gas taxA gas tax is commonly used to describe the variety of taxes levied on gasoline at both the federal and state levels, to provide funds for highway repair and maintenance, as well as for other government infrastructure projects. These taxes are levied in a few ways, including per-gallon excise taxes, excise taxes imposed on wholesalers, and general sales taxes that apply to the purchase of gasoline. declining in real terms, but also due to excise taxes becoming weaker approximations of true user fees.
- By 2034, the gas taxA tax is a mandatory payment or charge collected by local, state, and national governments from individuals or businesses to cover the costs of general government services, goods, and activities. and other car-related excise taxes are projected to raise less than half of the Highway Trust Fund’s outlays.
- The ideal solution would be to replace existing excise taxes with true user fees, but raising existing excise taxes would be a better solution than continuing a growing reliance on general revenue.
- Fully paying for federal highway spending with user fees could reduce the federal deficit by over $200 billion over the course of the next decade.
Introduction
The United States faces several fiscal challenges. In 2025, the individual tax cuts passed in the Tax Cuts and Jobs Act are scheduled to expire.[1] Meanwhile, long-run deficits are projected to remain at an elevated level in coming years and decades, even with the tax cuts expiring. The long-term increases in the debt come from growing entitlement obligations to programs such as Social Security and Medicare.[2] To bring deficits under control, policymakers will have to consider substantial reforms to growing entitlement programs, and, likely, broad-based tax increases, ideally focused on consumption.[3]
To actually address long-term deficits, lawmakers will have to make difficult trade-offs. But in addition to structural changes to entitlement spending and major tax reforms, some deficit-reducing reforms can bring efficiency gains as well. One particularly salient example is transportation.
Historically, the United States has relied upon some version of the user-pays principle—the idea that beneficiaries of a particular service should also shoulder the burden of paying for the service—for transportation infrastructure. The most common example is the federal gas tax, which has historically funded highway maintenance and investment. However, the federal gas tax has not risen since 1993 and, in real terms, has dropped by more than half due to inflationInflation is when the general price of goods and services increases across the economy, reducing the purchasing power of a currency and the value of certain assets. The same paycheck covers less goods, services, and bills. It is sometimes referred to as a “hidden tax,” as it leaves taxpayers less well-off due to higher costs and “bracket creep,” while increasing the government’s spending power. . Furthermore, the introduction of electric vehicles (EVs) has distorted the user-pays principle as EVs impose costs on highway maintenance just like conventional vehicles do, but they do not pay the gas tax.
Policymakers looking to bring deficits under control should consider the state of transportation funding. Raising the gas tax and adjusting it for inflation would be a short-term, patchwork answer. A structurally sound, forward-thinking approach would consider a tax on vehicle miles traveled (VMT), replacing the gas tax (an approximation of a user feeA user fee is a charge imposed by the government for the primary purpose of covering the cost of providing a service, directly raising funds from the people who benefit from the particular public good or service being provided. A user fee is not a tax, though some taxes may be labeled as user fees or closely resemble them. ) with a tax directly on the maintenance costs vehicles impose on infrastructure. User fees on other forms of transportation should be considered as well.
Economic Background
User fees are charges for the individual benefits of specific government services.[4]
For example, the State Department charges fees for getting passports—$130 for an adult currently without a passport. The benefits of having a passport (namely international travel) are mostly internal to the passport holder, and only roughly half of Americans have passports. Accordingly, it makes sense to have passport holders pay for the passport administration process, instead of relying on general taxes paid by passport holders and non-holders alike. This intuition helps explain why benefit taxes, which align the financing of programs to the beneficiaries, are considered less distortionary taxes.[5]
Some argue major transportation infrastructure projects provide large economic benefits, justifying more distortionary taxes to finance new projects. However, while basic infrastructure might have very high returns, the US already has basic infrastructure, and the marginal benefits of expanding basic infrastructure are necessarily lower.[6] Connecting New York and Boston, for instance, may provide massive returns in terms of enhanced commerce. But it would not make sense to assume the same returns to an extension linking Boston with Portland, Maine—a much smaller city.
This dynamic supports a “Fix It First” approach to infrastructure investment, focused on maintaining the core infrastructure we have rather than initiating brand-new expansions.[7] Furthermore, while infrastructure may provide benefits, they are mostly already internalized. In the example of roads connecting Boston and New York, passengers benefit from direct transportation between the two cities, and consumers in each city benefit from the lower transportation costs of goods.[8] And while infrastructure investment can still improve productivity growth (even if the returns are lower than the returns to private investment), it still makes sense to raise the money needed for it with the least distortionary taxes possible.
The user-pays principle helps align infrastructure investment toward places where investment will be productive. Transportation infrastructure investment can provide returns by facilitating more or faster transportation of people and goods. Roads or rail networks that carry a lot of passengers or freight will also generate significant user fee revenue. Conversely, a road or rail network that attracts few passengers or little freight will generate little revenue. Relying on general revenue for transportation spending also hides the costs while making the benefits salient, causing over-investment (or investment in suboptimal projects), at least at the national level.[9]
In addition, user fees align supply and demand, preventing both underuse and overuse. At the very least, user fees ought to cover wear and tear—the maintenance cost of infrastructure. But in some cases, particularly for certain roads, drivers also impose costs on other drivers in the form of traffic congestion.[10] User fees should also equalize the treatment of cargo across transportation modes. If some transportation modes are funded with general revenue, and others are reliant on user charges, then users will be inefficiently pushed away from the transportation modes with user fees and toward the subsidized mode. When roads are underpriced, for example, more freight traffic moves by road instead of by the largely unsubsidized private freight rail network.[11]
Ideal user fees are aligned to the costs users impose. However, a common next-best solution is a more general user-pays principle. As an example, the US currently imposes a 7.5 percent excise taxAn excise tax is a tax imposed on a specific good or activity. Excise taxes are commonly levied on cigarettes, alcoholic beverages, soda, gasoline, insurance premiums, amusement activities, and betting, and typically make up a relatively small and volatile portion of state and local and, to a lesser extent, federal tax collections. on airline tickets that partly funds airport improvements. Presumably, each passenger benefits approximately equally from airport infrastructure, but passengers on either more expensive routes or in more expensive seats pay proportionately more in taxes to finance it. It is not a true user fee for airport infrastructure. However, it maintains some version of the user-pays idea: air passengers (and not the general taxpayer) are paying for air infrastructure, even if some are paying slightly more and some are paying slightly less.
The Trust Funds: Highways and Beyond
The federal government has several trust funds for different types of transportation infrastructure investment. In the context of the federal government, trust funds are an accounting mechanism keeping certain earmarked revenues aligned to specific purposes.[12] The trust funds related to air and water infrastructure are small when compared to the Highway Trust Fund (HTF), which faces the most significant long-term challenges.
Airport and Airway Trust Fund
The Federal Aviation Administration (FAA) regulates civil aviation, provides air traffic control services, and distributes grants to airports. The Airport and Airway Trust Fund was created in 1970 and is funded by a series of air travel-related excise taxes to support related travel infrastructure.[13] Table 2 summarizes the taxes used to generate revenue for the trust fund.
Table 1. Taxes Used to Raise Revenue for the Airport and Airway Trust Fund
| Air Transportation Tax | Rate/Level |
|---|---|
| Ad Valorem Tax on Domestic Tickets | 7.5 percent |
| Domestic Flight Segment Tax | $5.00 |
| Tax on Flights among Lower 48 States and Alaska and Hawaii | $11.10 |
| International Arrival and Departure Tax | $22.10 |
| Tax on Mileage Awards | 7.5 percent |
| Domestic Commercial Fuel Tax | 4.3 cents per gallon |
| Domestic General Aviation Gasoline Tax | 19.3 cents per gallon |
| Domestic General Aviation Jet Fuel Tax | 21.8 cents per gallon |
| Tax on Domestic Cargo or Mail | 6.25 percent |
The federal government also imposes a few other fees to fund security and immigration services related to air transportation.[14] Furthermore, airports themselves charge passenger facility charges (PFCs), although the FAA limits the rate to $4.50 per passenger.[15]
The FAA also levies overflight fees on foreign aircraft that cross into US airspace but never land in the United States. This policy makes sense on its face, as foreign aircraft ought to incur the cost of FAA monitoring of their activity. However, instead of funding regular FAA operations, overflight fee revenue (partially) funds the Essential Air Service, which provides subsidized air service to rural communities.[16]
The passenger facility charges are closer to true user fees, whereas the various federal-level aviation excise taxes (much like the gas tax and road travel) are approximations.[17] Regarding air traffic control services, large aircraft impose lower costs per passenger than small aircraft do, but passengers on both pay the same 7.5 percent excise tax rate.[18] And when considering the airport infrastructure side of the equation, PFCs stay with the airport, while the various excise taxes on air travel are remitted up to the federal government, which then reallocates the funding.[19] This reallocation ultimately means some tax revenue generated at large airports in high demand shifts to smaller, lower-demand airports, even though the high-traffic ones are most in need of expanded capacity.[20] A system with higher PFCs and operator fees based directly on air traffic control service needs would be more efficient and coherent than the hodgepodge of excise taxes we have.
Harbor Maintenance and Inland Waterways Trust Funds
The federal government also features two trust funds related to maintaining water transport infrastructure. The Harbor Maintenance Trust Fund (HMTF) supports international port maintenance with a tax of 0.125 percent on the value of cargo.[21] Historically, the tax has generated more revenue than the Harbor Maintenance Fund has spent in any given year and often fully covers harbor maintenance costs.[22]
The Inland Waterways Trust Fund covers internal infrastructure improvements to rivers and is financed by a 29 cents per gallon tax on the sale of gasoline for commercial barges.[23] The tax is intended to cover just half of inland waterway expenses, with the rest covered by transfers from the general fund, but it often struggles to fund half.[24]
Both taxes could be better calibrated to resemble user fees. In the case of the HMTF, the tax on cargo value does not account for different types of cargo, imposing different maintenance costs on harbors and waterways. A hundred million dollars of mineral ore is much heavier than a hundred million dollars of consumer electronics. Ships carrying heavy goods like ore have deeper drafts and accordingly cause higher maintenance costs than ships carrying higher-value goods like electronics, but they pay the same tax rate per dollar of cargo value.[25] Taxing cargo weight instead of cargo value would bring the policy closer to a true user fee.
Highway Trust Fund
The Highway Trust Fund was established in 1956 to fund the new Interstate Highway System. Most of the Highway Trust Fund’s revenues were generated from excise taxes on gasoline and diesel fuels. But for more than two decades, revenues generated for the HTF have fallen short of federal spending on highways.[26] To make up the difference, Congress has approved $275 billion in transfers, primarily from the Treasury’s general fund, between 2008 and 2023.[27]
The excise taxes providing revenue for the HTF are imprecisely calibrated to reflect the fact that heavier vehicles impose disproportionately higher damage to roads relative to smaller vehicles, meaning they effectively “use” the road more for each mile driven.[28] The diesel tax rate is higher than the gas tax rate (as diesel vehicles are often, although not always, heavier), and the federal government also collects a 12 percent excise tax on tractors, trucks, and trailers above a certain weight, as well as annual user fees, and an excise tax on certain truck tires.[29] Table 1 summarizes the taxes that fund the Highway Trust Fund.
Another way the gas tax diverges from a true user fee is the 80-20 rule. Introduced in 1982 as part of an increase in the gas tax from 4 to 9 cents, the 80-20 rule allocates 20 percent of gas tax revenue collected above the rate of 4 cents per gallon to fund mass transit programs.[30]
Table 2. Taxes that Fund the Highway Trust Fund
| Tax Type | Levy |
|---|---|
| Gas Tax* | 18.3 cents per gallon |
| Diesel* | 24.3 cents per gallon |
| Truck and Trailer Excise Tax | 12% of retail sales price for tractors and trucks over 33,000 pounds and trailers over 26,000 of gross vehicle weight (GVW) |
| Tire Excise Tax | $.0945 per tire for every 10 pounds of maximum load capacity over 3,500 pounds, levied once on manufacturers, producers, or importers |
| Truck Use Tax | $100 for trucks between 55,000 and 75,000 pounds GVW, an additional $22 for each 1,000 pounds in excess of 55,000 pounds; $550 for trucks 75,000 pounds GVW (levied annually) |
* An additional 0.1 cents per gallon tax is devoted to the Leaking Underground Storage Tank (LUST) Trust Fund.
The Data: Own-Source Revenue is Not Following Spending
While some of the smaller trust funds could be improved by better aligning their taxes and spending priorities, the Highway Trust Fund faces much deeper structural challenges. For instance, the Airport and Airway Trust Fund does not fully fund air infrastructure, but the gap between own-source revenue and total outlays is projected to be relatively small and stable going forward, with own-source revenue covering over 90 percent of spending for most of the coming decade.[31] Conversely, the gap between Highway Trust Fund revenue and spending is currently large, at almost $10 billion in 2024, and is only projected to get worse, reaching almost $37 billion by 2034. By 2034, the gas tax and other Highway Trust Fund taxes will raise less than half of the fund’s projected outlays.[32]
The growing federal highway deficit is a result of both increasing expenditures and decreasing real revenues. Americans drove more miles in 2023 than in any previous year—more than 3 trillion miles.[33] Combined with a sustained period of high inflation, and continually growing demand for road usage, federal highway expenditures are anticipated to increase by more than a third over the next decade.
At the same time, real highway revenues are decreasing. From 1977 to 2022, real highway revenues per vehicle mile driven fell by 52.7 percent.
The reasons for the decline won’t surprise many. Electric vehicles (EVs) comprise a growing market share and combustion engines are more fuel-efficient than ever. From 1972 to 2022, the average fuel economy across all vehicles increased by more than 50 percent.
Innovations in the fuel economy and electric vehicle spaces are significant achievements that create widespread benefits. When combined with gas tax rates that have not kept pace with inflation, however, the result is that gas tax revenues have become increasingly insufficient to cover roadway expenses.
The nominal federal gasoline tax has only increased three times since 1977, from 4 cents per gallon to today’s 18.4 cents per gallon. While the nominal tax rate has slowly increased, the real tax rate has gradually eroded due to inflation. Since the last nominal increase in the federal gas tax in 1994, the inflation-adjusted value of the tax has fallen by more than half.
Policy change is desperately needed to align road charges with road usage. One potential solution to both challenges is a nationwide vehicle miles traveled (VMT) tax.
Highlight on Highways: Possibility of a Vehicle Miles Traveled (VMT) Tax
VMT taxes, sometimes referred to as mileage-based user fees or road usage charges (RUCs), are charges that drivers pay per mile they drive on public roads.[34] VMTs may vary based on the vehicle’s weight per axle and/or the time and location of the driving. Instead of using gas consumption as a proxy for road use, a VMT tax would measure actual road use and then charge the driver for each mile driven. If accurately calibrated, it would reconcile roadway revenues and expenditures and insulate road funding from changing fuel efficiencies, technologies, and consumer preferences.
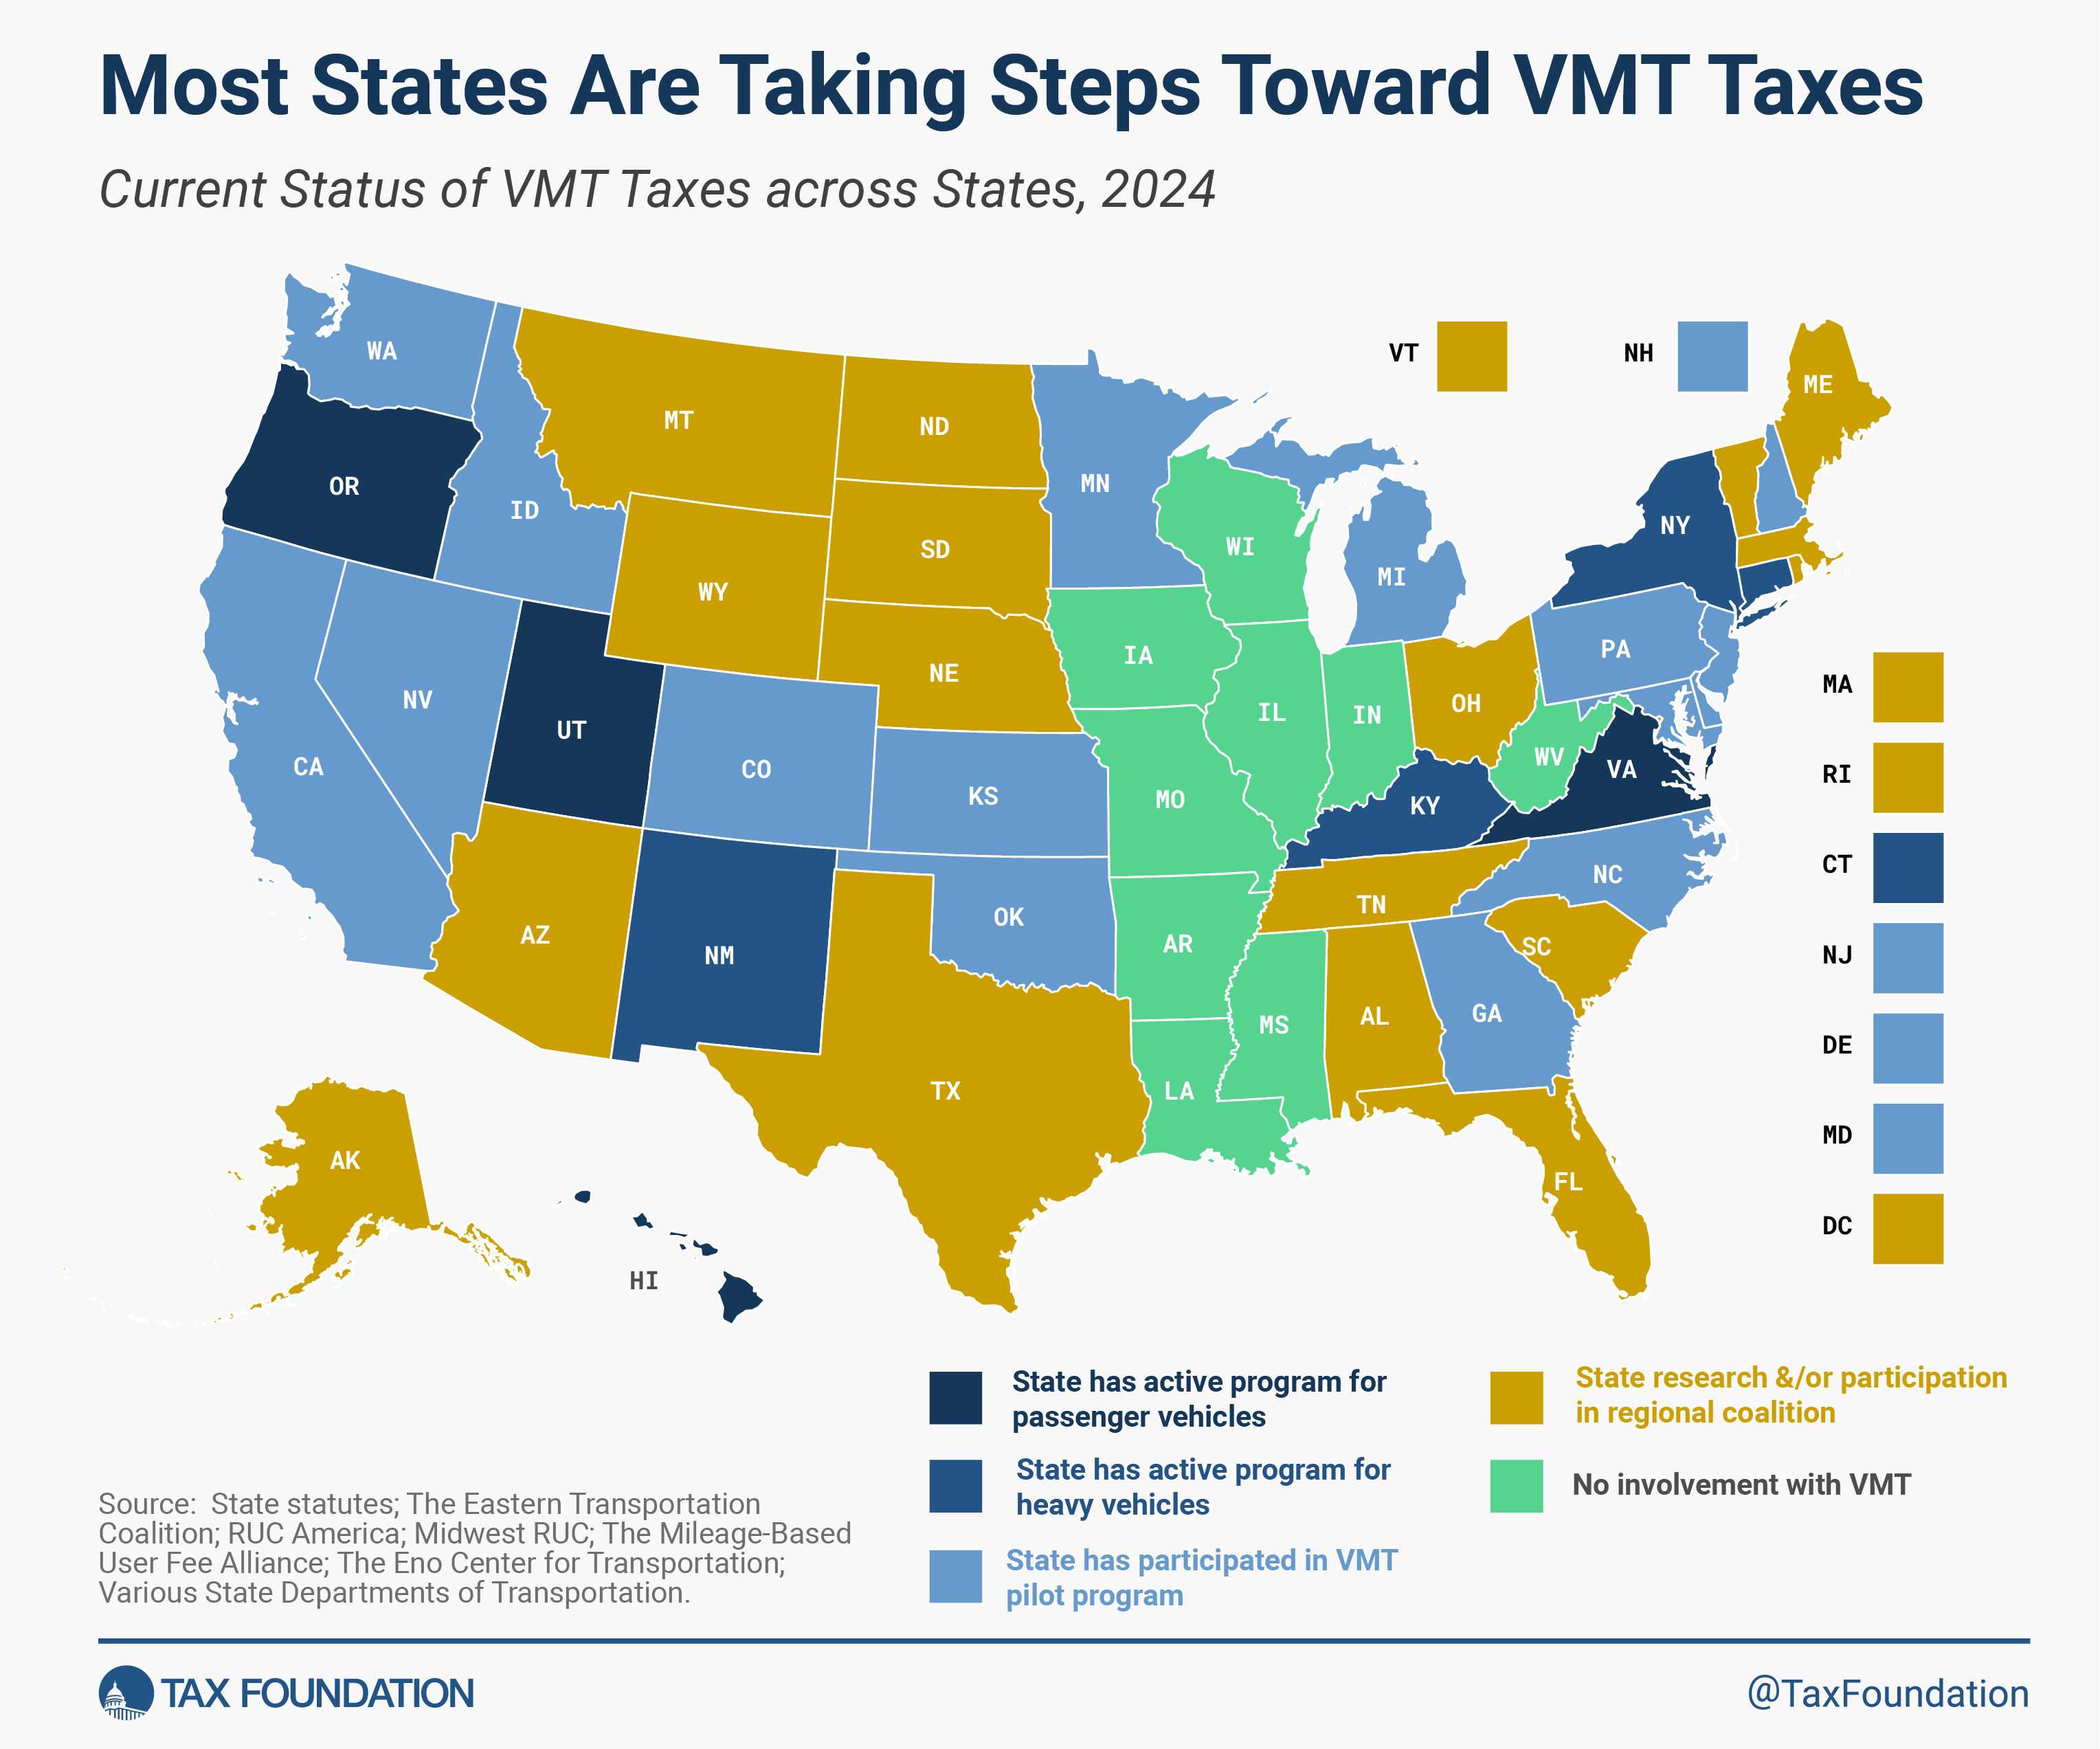
VMT taxes are still in their infancy. No federal VMT policy yet exists, and no state has yet replaced its gas tax with a VMT. Only four states currently have active opt-in programs for passenger vehicles and five states have active programs targeting heavy commercial vehicles (Oregon has both), though 16 states have launched pilot programs to explore how best to implement a VMT. Taxes on heavy vehicles are mandatory, but existing programs for passenger vehicles are voluntary with drivers opting in to save on their state’s gas tax, vehicle registration, or other fees. Only Hawaii has planned to make its program mandatory, as it is set to apply to all EVs in 2028 and all passenger vehicles in 2033.
VMT design has been controversial. The biggest policy questions involve how exactly a government taxing agency receives information on an individual’s usage of the roads. The problem is often viewed through the lens of an efficiency-privacy trade-off, though results from state pilot programs suggest that VMTs can achieve high accuracy of road use tracking with minimal personal data provided to the government.
VMT designs can be placed in two buckets: low-tech solutions reliant on manual submissions of odometer readings, and higher-tech solutions based on global positioning system (GPS) tracking of vehicle use. Of the four states with active programs, Oregon and Virginia have both GPS and non-GPS reporting options available, Utah only uses GPS, and Hawaii is set to use odometer readings during regular registration renewal inspections.
Manual submission of miles driven via odometer readings is minimally invasive. This process can be incorporated into states’ existing processes for annual vehicle registration filing or vehicle inspections. However, self-reported mile usage incentivizes under-reporting road use and could increase the burden of assigning miles driven to the use of private roads, out-of-state roads, and in-state public roads. One option to crudely adjust for miles driven on non-state roads would be some form of standard deductionThe standard deduction reduces a taxpayer’s taxable income by a set amount determined by the government. Taxpayers who take the standard deduction cannot also itemize their deductions; it serves as an alternative. : exempting a fixed amount or fixed percentage of miles driven.[35] More advanced tools for congestion-based pricing or road charges that vary by location (e.g., bridges) would require a separate toll-type system.
GPS tracking would provide the most accurate system to identify road use and would allow for more advanced pricing tools to capture the costs of road use. GPS tracking could occur through the use of plug-in devices and smartphone apps.[36] Similar tools are already available and have popular adoption in private insurance markets (e.g., Progressive’s Snapshot and State Farm’s Drive Safe & Save).[37] Drivers can install the device or app that tracks the distance driven and the relative safety of the insured’s driving behavior (defined and measured by the insurance company). Safer drivers and those who use the road less receive discounted insurance premiums.
The biggest challenge to GPS tracking is privacy. Many Americans would be understandably hesitant to support a system that provided a government agency with detailed, GPS-specific tracking of their vehicle’s movements.
One solution to the privacy issue, implemented in several state VMT pilot programs, is the use of third-party private-sector commercial account managers (CAMs). Individual user data is sent directly to the CAMs. That data is then stripped of nonessential information and passed onto government agencies with only the information necessary for tax purposes, such as aggregate miles driven on public roads in the relevant state. Questions remain regarding data storage, data security, and if the government could ever access this data, for instance, with a search warrant, but third-party CAMs have helped to ameliorate some of the initial privacy concerns.[38]
Pricing VMT taxes with a flat rate is rather straightforward. The Federal Highway Administration tracks highway usage and reports estimates of total vehicle miles traveled. To calculate the VMT tax rate necessary to balance state and federal highway budgets, we simply divide state and federal highway spending by the total vehicle miles traveled.[39] Table 3 reports own-source transportation revenue and VMT for each state. The final column converts the numbers to revenue per mile driven, or the VMT tax rate that could replace existing revenues.
Table 3. State Vehicle Miles Traveled and Spending on Highways
| State | Transportation Tax Revenue (2021) | Vehicle Miles Travelled (Millions) | Average Tax Rate | Vehicle Miles Travelled (millions) | Average Tax Rate |
|---|---|---|---|---|---|
| Alabama | $1,285,988,000 | 71631 | $0.0180 | 71892 | $0.0179 |
| Alaska | $159,480,000 | 5478 | $0.0291 | 5752 | $0.0277 |
| Arizona | $1,168,631,000 | 76159 | $0.0153 | 73760 | $0.0158 |
| Arkansas | $774,708,000 | 38530 | $0.0201 | 38427 | $0.0202 |
| California | $13,544,089,000 | 315244 | $0.0430 | 310823 | $0.0436 |
| Colorado | $1,431,887,000 | 53935 | $0.0265 | 53840 | $0.0266 |
| Connecticut | $713,925,000 | 29666 | $0.0241 | 28989 | $0.0246 |
| Delaware | $530,513,000 | 9872 | $0.0537 | 10152 | $0.0523 |
| Florida | $7,320,747,000 | 227757 | $0.0321 | 217566 | $0.0336 |
| Georgia | $2,314,682,000 | 128871 | $0.0180 | 120685 | $0.0192 |
| Hawaii | $588,052,000 | 10289 | $0.0572 | 9972 | $0.0590 |
| Idaho | $700,609,000 | 19157 | $0.0366 | 19308 | $0.0363 |
| Illinois | $6,250,105,000 | 103752 | $0.0602 | 97530 | $0.0641 |
| Indiana | $2,264,434,000 | 95684 | $0.0237 | 78640 | $0.0288 |
| Iowa | $1,457,922,000 | 32712 | $0.0446 | 33039 | $0.0441 |
| Kansas | $842,742,000 | 31334 | $0.0269 | 31693 | $0.0266 |
| Kentucky | $1,023,572,000 | 48047 | $0.0213 | 48111 | $0.0213 |
| Louisiana | $759,086,000 | 56514 | $0.0134 | 54728 | $0.0139 |
| Maine | $492,060,000 | 14651 | $0.0336 | 14560 | $0.0338 |
| Maryland | $2,254,343,000 | 56746 | $0.0397 | 56601 | $0.0398 |
| Massachusetts | $2,148,547,000 | 56949 | $0.0377 | 59115 | $0.0363 |
| Michigan | $2,933,511,000 | 95901 | $0.0306 | 96744 | $0.0303 |
| Minnesota | $1,983,589,000 | 57471 | $0.0345 | 57171 | $0.0347 |
| Mississippi | $635,779,000 | 39952 | $0.0159 | 40853 | $0.0156 |
| Missouri | $1,086,418,000 | 79431 | $0.0137 | 79791 | $0.0136 |
| Montana | $507,945,000 | 13514 | $0.0376 | 13482 | $0.0377 |
| Nebraska | $664,524,000 | 21270 | $0.0312 | 21210 | $0.0313 |
| Nevada | $913,291,000 | 27647 | $0.0330 | 27077 | $0.0337 |
| New Hampshire | $357,502,000 | 13281 | $0.0269 | 13130 | $0.0272 |
| New Jersey | $2,979,543,000 | 75288 | $0.0396 | 73673 | $0.0404 |
| New Mexico | $477,302,000 | 26831 | $0.0178 | 26823 | $0.0178 |
| New York | $7,009,364,000 | 115382 | $0.0607 | 106870 | $0.0656 |
| North Carolina | $3,405,179,000 | 119381 | $0.0285 | 117734 | $0.0289 |
| North Dakota | $310,201,000 | 9180 | $0.0338 | 9256 | $0.0335 |
| Ohio | $3,489,312,000 | 110578 | $0.0316 | 112923 | $0.0309 |
| Oklahoma | $1,711,654,000 | 44566 | $0.0384 | 44760 | $0.0382 |
| Oregon | $1,563,653,000 | 36576 | $0.0428 | 36842 | $0.0424 |
| Pennsylvania | $5,782,341,000 | 99912 | $0.0579 | 102686 | $0.0563 |
| Rhode Island | $222,738,000 | 7531 | $0.0296 | 7526 | $0.0296 |
| South Carolina | $1,308,265,000 | 58988 | $0.0222 | 57492 | $0.0228 |
| South Dakota | $336,063,000 | 10170 | $0.0330 | 9994 | $0.0336 |
| Tennessee | $1,748,465,000 | 83219 | $0.0210 | 82596 | $0.0212 |
| Texas | $8,177,128,000 | 290890 | $0.0281 | 285028 | $0.0287 |
| Utah | $814,549,000 | 34336 | $0.0237 | 33638 | $0.0242 |
| Vermont | $187,956,000 | 7128 | $0.0264 | 6625 | $0.0284 |
| Virginia | $2,522,939,000 | 82083 | $0.0307 | 80102 | $0.0315 |
| Washington | $3,210,871,000 | 58483 | $0.0549 | 57797 | $0.0556 |
| West Virginia | $569,583,000 | 15312 | $0.0372 | 16079 | $0.0354 |
| Wisconsin | $2,084,380,000 | 66167 | $0.0315 | 64983 | $0.0321 |
| Wyoming | $247,983,000 | 9324 | $0.0266 | 11097 | $0.0223 |
| District of Columbia | $80,140,000 | 3421 | $0.0234 | 3248 | $0.0247 |
In states currently operating VMT programs, Oregon prices per mile at $0.02, Utah at $0.016 per mile, Virginia at $0.0107 per mile, and Hawaiian drivers can enroll in their state’s Road Use Charge program next year, paying $0.008 per mile.
VMT taxes only on heavy vehicles are more common. Oregon, New Mexico, Connecticut, Kentucky, and New York all levy them, and they all feature some form of scaling, taxing heavier vehicles at a higher rate per mile. Rates range from as low as $0.011 on 26,000 lbs. vehicles in New Mexico to as high as $0.3533 on 96,000 lbs. vehicles with only five axles in Oregon.[40] Raising the per-mile tax rate reflects the disproportionately greater wear and tear heavier vehicles impose on infrastructure. More specifically, vehicles with more weight per axle impose higher costs, as distributing weight across more axles reduces the negative impact. Estimates from the CBO and Federal Highway Administration suggest trucks impose costs of between $.03 and $.25 per mile, with costs increasing significantly for vehicles with greater weight per axle.[41] And a Swedish study of road traffic estimated the wear and tear costs that large heavy goods vehicles impose are between 11 and 44 times as large (depending on whether heavy goods vehicles are towing trailers) as the wear and tear costs imposed by passenger cars.[42]
A federal VMT of roughly $0.016 per mile driven could fully replace the federal gas tax and fully cover HTF expenditures in 2024. Meanwhile, a nationwide VMT program that charged drivers $0.05 per mile would generate more than enough revenue to replace all existing taxes and fees for road use at both the federal and state levels.
Ideally, a VMT tax would scale according to weight per axle and differentiate tax rates within broad categories such as passenger cars (a large pickup truck has a higher weight per axle than a compact sedan) or commercial trucks. However, looking at some possible average tax rates for different classes is illustrative. This is not a proper revenue estimate, as it does not factor in possible behavioral effects, but it gives a ballpark estimate of what would be needed to reach $52.6 billion, the CBO’s projected outlays for the Highway Trust Fund in 2024.[43]
Table 4. Hypothetical Differentiated Federal VMT Regime
| Vehicle Miles Traveled (2022) (Millions) | Cents per Mile | Revenue (Millions) | |
|---|---|---|---|
| Passenger Cars | 2,822,664 | 1.1 | $31,049 |
| Motorcycles | 23,765 | 0.5 | $119 |
| Buses | 18,490 | 4.0 | $740 |
| Commercial Trucks | 331,272 | 6.3 | $20,870 |
| Total | 3,196,191 | 1.65 (average) | $52,778 |
From 2025 to 2034, the projected highway deficit is approximately $276 billion.[44] Fully funding that gap with taxes based on VMTs would reduce the overall federal budget deficit, but raising excise taxes reduces revenue generated by the individual income, payroll, and corporate income taxes.[45] Applying an excise tax offset of approximately 25 percent to account for this effect, the net impact of fully funding federal highway spending with VMT taxes would be to reduce the deficit by slightly over $200 billion.
The evidence on the distributional effects of a gas tax for VMT swap generally indicates the swap would be progressive, as it would shift the tax burden to higher-income households that disproportionately use EVs and other fuel-efficient vehicles.[46]
An ideal VMT program would be coordinated federally. Even if privacy concerns are assuaged and rates are appropriately set, state-by-state rollouts of VMTs without a federal system will leave open opportunities for “free-riders”—(out-of-state) users of the road who don’t pay into the state VMT. Patchwork regional coalitions and expanded toll systems can help bridge this gap to avoid a kind of transitional gains trap,[47] but nationwide coordination would go a long way to ease the transition from gas taxes to VMT taxes.
Congestion Pricing: Further Targeting User Fees
A vehicle miles traveled tax levied according to weight per axle focuses the user fee on the maintenance costs the user imposes. Policymakers could also design user fees based on the immediate costs the driver imposes on other drivers: congestion.
Driving is concentrated around work patterns and weekend recreation. Taxes being uniform across roads and times means that high-demand city streets and highways are drastically underpriced, creating heavy traffic congestion on over-used roads, especially during peak hours. Traffic congestion is dangerous to motorists, accelerates vehicle deterioration, and creates massive economic losses from wasted time.[48] Roads also tend to be underpriced relative to other modes of transportation, like railways, which introduces still more inefficiencies into the transportation system. Congestion pricing is the practice of adjusting the price of road use in accordance with the demand for a specific road at a specific time.[49] This is often achieved by delineating zones but could also be varied by type of road (like highways) or even by lane (i.e., an express lane that costs more). Drivers may be charged a flat daily fee for entering a certain zone or, more optimally, charged per trip made into the zone, varying based on the time of day.
A handful of cities around the world have embraced congestion pricing. In 2003, London implemented congestion pricing within the London Inner Ring Road, an eight-mile region within Central London.[50] Fees are applied during certain hours of the day and enforced using traffic cameras that capture license plates. Payments can be made online or using a mobile app and must be made within three days to avoid fines.
A report from Transport for London (TfL) estimated that the pricing scheme reduced congestion by as much as 30 percent two years after implementation.[51] The latest TfL data through 2019 noted that the number of people entering the area through private autos has dropped by a staggering 48 percent since congestion pricing was introduced, even though the total number of people entering Central London has increased by 21 percent over this time period.[52] Instead, people have shifted to alternative modes of transportation, mainly buses, trains, and bikes.
London’s system is not perfect. Trucks are exempted, as are taxis/ride-sharing services, the latter of which account for more than 40 percent of total traffic in Central London.[53] Residents living within the zone also only pay 10 percent of the admittance fee. Any congestion pricing scheme should adopt as few exemptions as possible to enable the policy to effectively reduce traffic. Table 5 describes congestion pricing in five global cities.
Table 5. Congestion Pricing around the World
| Location | Year Implemented | Policy | Impact |
|---|---|---|---|
| London, England | 2003 | Flat fee to enter London Inner Ring Road | Number of visitors entering through autos dropped by 48% through 2019 |
| Stockholm, Sweden | 2007 | Fees that vary based on demand | Traffic declined by 22% a decade after introduction |
| Gothenburg, Sweden | 2013 | Fees that vary based on demand | Traffic declined by 12% one year after introduction |
| Milan, Italy | 2012 | Flat fee to enter Milan Area C | Traffic fell by 39% a decade after introduction |
| Singapore | 1975, revised 1998 | Fees that vary based on demand | Traffic entering zones fell by 24% since ERP introduced |
In 1975, Singapore was the first country to introduce congestion pricing for its urban areas, under a program called the Area Licensing Scheme (ALS).[54] Vehicles paid for a license to enter a certain zone during peak hours, and with the same license could make multiple trips into the zone in a day. Singapore granted exemptions for carpools or vehicles with four or more passengers, buses, and motorcycles, although these were later reversed in 1989.[55] In the first month following implementation, traffic fell by 76 percent.[56] The use of public transportation rose from 33 percent before ALS to 70 percent by 1983.[57] By 1991, average vehicle speed in the zone had reached 22 mph during peak hours, compared to only 6 mph in NYC at the time.[58]
To smooth out the use of roads within these zones, other changes were adopted in the 1990s. First, Singapore rolled out another static pricing system, the Road Pricing Scheme (RPS), to reduce congestion on its expressways at specific times of day.[59] ALS was extended throughout the whole day starting in 1994, instead of exclusively during peak hours, to better regulate congestion within the zones.
Although this system proved effective for more than two decades in reducing congestion, its largest drawback was that it did not regulate the number of trips into the zone, since it was based on a flat license fee. Starting in 1998, Singapore switched to its current scheme, the Electronic Road Pricing (ERP) system, which charges users per trip and based on the time of day.[60] The fees are based on pre-established optimal speeds within each zone and are reviewed every three months to determine if the fees should be raised or lowered to hit those average speeds. Overhead gantries, much like EZ-Pass in the US, scan the transponder in the vehicle and deduct the payment from a stored value card. Following the implementation of this system, traffic entering the zones fell by 24 percent, and average speeds increased by 30 percent.[61]
Stockholm introduced congestion pricing in 2007. The program began as a seven-month pilot in 2006, and initially faced strong opposition from the public, as high as 70 percent.[62] However, traffic volume declined by 25 percent over its trial run, and public opinion eventually reversed and voted in favor of making the system permanent through a referendum. This made it the first European city to adopt a road pricing scheme.
The system uses gantries for main entry points into the city, with fees that apply during peak hours and vary based on demand. Although the Stockholm system was itself inspired by Singapore’s ERP, payment does not occur at the point of entry and a bill is instead sent to the vehicle owner at the end of each month. In the decade after introduction, traffic in Stockholm declined by 22 percent, even while the city’s population grew by 10 percent.[63] Much like London, high-income earners were more affected than low-income earners.
Following the success in Stockholm, Gothenburg implemented a similar system in 2013. A year following its implementation, traffic declined by 12 percent, with many switching to public transportation or taking fewer trips overall.[64]
Milan was the second European city to introduce congestion pricing. Beginning in 2008, the city introduced the Ecopass program, which imposed fees on individuals entering a designated traffic zone, based on the time of day and if the vehicle was considered “high-polluting.” When it was introduced, Milan had one of the highest levels of car ownership in the world, and the program was intended to reduce high levels of smog that had plagued the city. During its one-year trial run, Ecopass reduced traffic by 21 percent and also reduced pollution.[65]
The program was expected to be made permanent, but implementation was delayed for several years. The city eventually scrapped the program and replaced it with “Area C,” a zone that would charge vehicles a flat daily fee for entry. Unlike Ecopass, the fee would not be based on the type of vehicle. Residents within Area C may make 40 free entries within the zone per year, and then face a discounted fee for each entry after. Over the next 10 years after the policy was introduced in January 2012, traffic fell by 39 percent in Area C.[66]
In the US, New York City planned to implement congestion pricing on June 30, 2024, in Manhattan, but Governor Kathy Hochul, fearing a backlash from voters, announced the plan would be delayed indefinitely.[67] San Francisco and Los Angeles transit authorities have also been studying congestion pricing since 2019, but have not announced any plans to implement such schemes. Nonetheless, the idea should not be discarded.
Other Overarching Issue: Ridership versus Coverage and Rural Subsidies
In urban mass transit (a subject this paper largely does not cover), transit agencies have two priorities: ridership and coverage. Ridership involves maximizing the number of mass transit users or minimizing the subsidy per passenger. Coverage involves maximizing accessibility to transit, regardless of the rate a service is used.[68] A city bus agency using a ridership-based approach might focus on running frequent service in densely populated areas and largely ignore lower-density neighborhoods, as fewer people would use transit there. The same agency optimizing for coverage might spread bus routes evenly across the city so everyone in the city could access bus services, even if many of the bus routes in low-density areas are substantially underutilized.[69]
The ridership versus coverage choice is often discussed in the context of local public transit systems, but those systems can serve as a microcosm of the United States’s transportation policy. In many different modes of transportation, we shift money raised in high-traffic areas to maintain coverage in low-traffic areas.
In passenger rail, Amtrak’s Northeast Corridor is actually profitable—but to achieve broad coverage, Amtrak maintains long-distance routes through more sparsely populated rural states that only recoup 50 percent or less of their operating costs.[70] In passenger aviation, most aviation infrastructure costs are covered by excise taxes on users, but the Essential Air Service program directs general fund revenue to support low-traffic airports in rural areas.[71] In maritime freight service, some unproductive ports with little cargo traffic contribute little in HMT revenue yet receive relatively massive maintenance payments.[72]
One might consider the coverage priority important for equity reasons, whether based on income or geography. However, one should hope the priority of policymakers designing infrastructure is to design infrastructure that people will use. And furthermore, for some forms of transportation infrastructure, subsidies meant to enhance equity may not end up serving the coverage goal of effectively connecting rural communities, and instead could primarily benefit higher-income earners. For instance, long-distance Amtrak trains are often justified as a key lifeline to residents of relatively isolated locations, but, in practice, a large part of their role is as a leisure or tourism experience.[73] In air travel, recreational flying constitutes a larger share of the use of more heavily subsidized smaller airports, rather than mainline commercial passenger travel, the latter of which would be more consistent with the goal of maintaining essential travel access.[74] Conversely, not all transportation user fees are distributionally regressive: user charges for airports and commuters are estimated to be progressive.[75]
In the specific case of VMT charges replacing the gas tax to better align road charges with road usage, rural drivers may not actually be left out to dry either. Rural drivers tend to drive larger vehicles with inferior fuel economy than those favored by urban drivers, so VMT-based fees would be less on average even after accounting for rural drivers traveling farther.[76] If pricing was differentiated by road type, rural drivers could also save more since rural roads tend to be less expensive to build and maintain.[77]
Conclusion
US transportation infrastructure financing has substantial room for improvement. Much like the broader tax reform debate, there are two possible approaches: the patchwork approach of working within existing policy frameworks and the more structurally sound approach of reforming policy frameworks entirely. The patchwork approach would rely on raising existing dedicated excise taxes to close funding gaps in the short term. In the highway funding case, raising the gas tax and inflation-adjusting it would raise revenue over the next decade, but it would not address EVs gradually eroding the tax baseThe tax base is the total amount of income, property, assets, consumption, transactions, or other economic activity subject to taxation by a tax authority. A narrow tax base is non-neutral and inefficient. A broad tax base reduces tax administration costs and allows more revenue to be raised at lower rates. .
The more structurally sound approach would involve repealing most current excise taxes and replacing them with user fees more directly aligned with costs imposed, regardless of any future changes in consumer preferences or technological developments. Replacing the gas tax (and the handful of excise taxes on heavy-duty trucks and tires) with a VMT tax that adjusts for the maintenance cost different kinds of vehicles impose is the best and most economically efficient solution. Replacing the gas tax with a VMT tax would involve some temporary transition costs, but they are surmountable. Meanwhile, in the cases of air and water travel, replacing the existing excise taxes with more proper user fees would not face substantial administrative hurdles.
Addressing the broader federal deficit problem will require substantive changes to broad tax and spending questions, not just tweaks to transportation financing. However, making incremental improvements where possible should be part of the solution.
Stay informed on the tax policies impacting you.
Subscribe to get insights from our trusted experts delivered straight to your inbox.
Subscribe[1] Alex Muresianu, “Why Are the Individual Tax Cuts Expiring?,” Tax Foundation, Apr. 25, 2024, https://taxfoundation.org/blog/tcja-individual-tax-cuts-expiring-2025/.
[2] See for instance, Congressional Budget Office, “The Budget and Economic Outlook: 2024 to 2034,” February 2024, https://www.cbo.gov/system/files/2024-02/59710-Outlook-2024.pdf.
[3] See for instance, Alex Durante, “Tackling America’s Debt and Deficit Crisis Requires Social Security and Medicare Reform,” Tax Foundation, May 23, 2023, https://taxfoundation.org/blog/medicare-social-security-reform-us-debt-deficits/.
[4] D. Andrew Austin, “Economics of Federal User Fees,” Congressional Research Service, Jan. 22, 2019, https://www.everycrsreport.com/files/20190122_R45463_41ae6c37deb01ac517089becaa8ddcf5f82cc5f7.pdf.
[5] See David Duff, “Benefit Taxes and User Fees in Theory and Practice,” University of Toronto Law Journal 54 (May 2004), https://papers.ssrn.com/sol3/papers.cfm?abstract_id=719721 for a further discussion of benefit taxation and technical differentiations between benefit taxes and user fees or user charges.
[6] See, for instance, Edward Gramlich, “Infrastructure Investment: A Review Essay,” Journal of Economic Literature 32:3 (September 1994), https://www.jstor.org/stable/2728606; John Fernald, “Roads to Prosperity? Assessing the Link Between Public Capital and Productivity,” American Economic Review 89:3 (June 1999), https://www.aeaweb.org/articles?id=10.1257/aer.89.3.619.
[7] Matthew Kahn and David Levinson, “Fix It First, Expand It Second, Reward It Third: A New Strategy for America’s Highways,” The Hamilton Project, Discussion Paper 2011-03 (February 2011), https://www.hamiltonproject.org/wp-content/uploads/2023/01/Final_KAHNDiscussPaper_Feb2011.pdf.
[8] Transportation is an input cost for goods, so savings in transportation are passed on to consumers, among other positive effects. For a broader discussion of those effects, see Jean-Paul Rodrigue and Theo Notteboom, The Geography of Transport Systems (New York, NY: Routledge, 2024), 72-82.
[9] Edward Glaeser and Giacomo Ponzetto, “The Political Economy of Transportation Investment,” Economics of Transportation 13 (March 2018), https://www.sciencedirect.com/science/article/pii/S2212012217300771#sec9.
[10] For a discussion of further externalities related to road transportation, see Sarah West and Robertson Williams, “Empirical Estimates for Environmental Policymaking in a Second-Best Setting,“ National Bureau of Economic Research Working Paper No. 10330 (February 2004), https://www.nber.org/digest/jul04/effect-gasoline-taxes-work-effort.
[11] Government Accountability Office, “Surface Transportation Report: A Comparison of the Costs of Road, Rail, and Waterways Freight Shipments That Are Not Passed on to Consumers,” Jan. 26, 2011, https://www.gao.gov/assets/gao-11-134.pdf.
[12] Paul Posner and Susan Irving, “Federal Trust and Other Earmarked Funds: Answers to Frequently Asked Questions,” Government Accountability Office, January 2001, https://www.gao.gov/assets/gao-01-199sp.pdf; see also Erica York, “A Brief Review of Federal Infrastructure Trust Fund,” Tax Foundation, Jan. 18, 2018, https://taxfoundation.org/blog/brief-review-federal-infrastructure-trust-funds/.
[13] Federal Aviation Administration, “Airport and Airway Trust Fund,” updated June 2023, https://www.faa.gov/sites/faa.gov/files/AATF-Fact-Sheet-2023.pdf.
[14] Airlines for America, “U.S. Government-Imposed Taxes on Air Transportation,” Jan. 1, 2024, https://www.airlines.org/dataset/government-imposed-taxes-on-air-transportation/.
[15] Heather Krause, “Airport Infrastructure: Information on Funding and Financing for Planned Projects,” Government Accountability Office, Feb. 13, 2020, https://www.gao.gov/products/gao-20-298.
[16] Rachel Yang, “Essential Air Service," Congressional Research Service, updated Mar. 30, 2017, https://crsreports.congress.gov/product/pdf/R/R44176/7; see also Bart Elias and Rachel Yang, “Federal Civil Aviation Programs: An Overview,” Congressional Research Service, updated Jun. 23, 2022, https://sgp.fas.org/crs/misc/R42781.pdf.
[17] Alan Cole, “Improving Airport Funding to Meet the Needs of Passengers,” Tax Foundation, May 11, 2015, https://taxfoundation.org/research/all/federal/improving-airport-funding-meet-needs-passengers/.
[18] Dorothy Robyn and Kevin Neels, “Air Support: Creating a Safer and More Reliable Air Traffic Control System,” The Hamilton Project Discussion Paper 2008-11 (July 2008), https://www.hamiltonproject.org/wp-content/uploads/2023/01/Air_Support-_Creating_a_Safer_and_More_Reliable_Air_Traffic_Control_System.pdf.
[19] Alan Cole, “Improving Airport Funding to Meet the Needs of Passengers.”
[20] Ibid., see also Marc Scribner, “Modernizing the Passenger Facility Charge for Aviation Recovery,” Reason Foundation, September 2022, https://reason.org/wp-content/uploads/modernizing-passenger-facility-charge.pdf.
[21] Jeff Davis, “History of the Harbor Maintenance Trust Fund,” Eno Center for Transportation, Nov. 6, 2019, https://enotrans.org/article/history-of-the-harbor-maintenance-trust-fund/.
[22] John Frittelli, “Harbor Maintenance Trust Fund Expenditures,” Congressional Research Service, Jan. 10, 2011, https://crsreports.congress.gov/product/pdf/R/R41042; see also Anna Normand and Nicole Carter, “U.S. Army Corps of Engineers: Annual Appropriations Process,” Congressional Research Service, Oct. 17, 2022, https://sgp.fas.org/crs/natsec/R46320.pdf; Aurora Swanson and Robert Reese, “Army Corps of Engineers: Budgetary History and Projections,” Congressional Budget Office, November 2022, https://www.cbo.gov/publication/58839.
[23] Jeff Davis, “The History of the Inland Waterways Trust Fund,” Eno Center for Transportation, Aug. 31, 2023, https://enotrans.org/article/the-history-of-the-inland-waterways-trust-fund/.
[24] Aurora Swanson and Robert Reese, “Army Corps of Engineers: Budgetary History and Projections.”
[25] Jeff Davis, “History of the Harbor Maintenance Trust Fund.”
[26] Chad Shirley, “The Status of the Highway Trust Fund: 2023 Update,” Congressional Budget Office, Oct. 18, 2023. https://www.cbo.gov/system/files/2023-10/59634.pdf.
[27] Ibid.
[28] See for instance Joseph Kile, “The Highway Trust Fund and Paying for Highways,” Congressional Budget Office, May 17, 2011, https://www.cbo.gov/sites/default/files/112th-congress-2011-2012/reports/05-17-highwayfunding.pdf.
[29] Chad Shirley, “The Status of the Highway Trust Fund,” Congressional Budget Office, Oct. 18, 2023, https://www.cbo.gov/system/files/2023-10/59634.pdf.
[30] Jeff Davis, “Highway Trust Fund 101,” Eno Center for Transportation, updated Aug. 15, 2023, https://enotrans.org/article/highway-trust-fund-101/.
[31] Congressional Budget Office, “Baseline Projections: Airport and Airway Trust Fund,” February 2024, https://www.cbo.gov/system/files/2024-02/59126-2024-02-aatf.pdf. Total outlays calculated by adding trust fund outlays, grants-in-aid, and the general fund transfer portion of the FAA operations budget.
[32] Congressional Budget Office, “Baseline Projections: Highway Trust Fund,” February 2024, https://www.cbo.gov/data/baseline-projections-selected-programs#8.
[33] Office of Highway Policy Information, “Travel Monitoring,” 2024, https://www.fhwa.dot.gov/policyinformation/travel_monitoring/tvt.cfm.
[34] Jacob Macumber-Rosin and Adam Hoffer, “Vehicle Miles Traveled Taxes Rollout across States,” Tax Foundation, May 9, 2024, https://taxfoundation.org/blog/state-vmt-vehicle-miles-traveled-taxes/.
[35] For instance, the Washington State pilot program included an exemption of 200 miles; see Washington State Transportation Commission, “Forward Drive: Sustaining Washington State’s Transportation System Into the Future,” January 2024, https://waroadusagecharge.org/media/final-report/DIGITAL_WA%20RUC%20Final%20Report%20January%202024_v2.pdf.
[36] GPS tracking could be done through vehicle telematics or plug-in devices paired with smartphone apps to submit periodic photos of odometer readings to ensure accuracy.
[37] See Daniel Robinson, “Progressive Snapshot,” Marketwatch Guides, Dec. 26, 2023, https://www.marketwatch.com/guides/insurance-services/progressive-snapshot/; Daniel Robinson, “State Farm Drive Safe and Save,” Marketwatch Guides, Jun. 22, 2024, https://www.marketwatch.com/guides/insurance-services/state-farm-drive-safe-and-save/.
[38] Another legal challenge comes from GPS reporting potentially violating the unconstitutional conditions doctrine. At the state level, GPS reporting of VMT would enable exemption of out-of-state/private road driving. It could be argued that the absence of some kind of “standard exemption” for those reporting with a non-GPS option would violate the unconstitutional conditions doctrine (conditioning not being taxed for out-of-state driving on relinquishing 4th, 9th, & 14th Amendment rights to privacy).
[39] Cuts to highway spending could also balance highway budgets. Additionally, this calculation assumes there is no diversion of highway revenue to non-transportation spending.
[40] See for instance, Oregon Department of Transportation, “Mileage Tax Rates,” effective Jan. 1, 2024, https://www.oregon.gov/odot/Forms/Motcarr/9928-2024.pdf; Connecticut State Department of Revenue Services, “Highway Use Fee Tax Information,” https://portal.ct.gov/drs/businesses/highway-use-fee/huf; New Mexico Motor Vehicle Division, “Weight-Distance,” https://www.mvd.newmexico.gov/commercial/commercial-vehicles/weight-distance/; Kentucky Transportation Cabinet, “Kentucky Weight Distance (KYU),” https://drive.ky.gov/motor-carriers/Pages/KYU.aspx; New York State Department of Taxation and Finance, “Highway Use Tax,” https://www.tax.ny.gov/bus/hut/huidx.htm.
[41] Congressional Budget Office, “Issues and Analysis for a Tax on Vehicle Miles Traveled by Commercial Trucks,” October 2019, https://www.cbo.gov/system/files/2019-10/55688-CBO-VMT-Tax.pdf.
[42] International Transport Forum, “Decarbonization and the Pricing of Road Transport,” ITF Roundtable Reports 191 (2023), https://www.itf-oecd.org/sites/default/files/docs/decarbonisation-pricing-road-transport.pdf.
[43] Congressional Budget Office, “Baseline Projections: Highway Trust Fund,” February 2024, https://www.cbo.gov/data/baseline-projections-selected-programs#8.
[44] Congressional Budget Office, “Baseline Projections: Highway Trust Fund.”
[45] See, for instance, Joint Committee on Taxation, “Income and Payroll TaxA payroll tax is a tax paid on the wages and salaries of employees to finance social insurance programs like Social Security, Medicare, and unemployment insurance. Payroll taxes are social insurance taxes that comprise 24.8 percent of combined federal, state, and local government revenue, the second largest source of that combined tax revenue. Offsets to Changes in Excise Tax Revenues for 2024-2034,” Mar. 14, 2024, https://www.jct.gov/publications/2024/jcx-9-24/. Excise tax offsets vary slightly by year.
[46] See Gilbert Metcalf, “The Distributional Impact of a VMT-Gas Tax Swap,” National Bureau of Economic Research Working Paper No. 30129 (June 2022), https://www.nber.org/system/files/working_papers/w30129/w30129.pdf; Edward Glaeser, Caitlin Gorback, and James Poterba, “How Regressive Are Mobility-Related User Fees and Gasoline Taxes,” National Bureau of Economic Research Working Paper No. 30746 (December 2022), https://www.nber.org/system/files/working_papers/w30746/w30746.pdf.
[47] Gordon Tullock, "The Transitional Gains Trap," The Bell Journal of Economics 6:2 (1975): 671-678, https://www.jstor.org/stable/3003249.
[48] A. A. Walters, The Economics of Road User Charges (Baltimore, MD: The Johns Hopkins Press, 1968), 22-47 and 167-189.
[49] William Vickrey, “Congestion Theory and Transport Investment,” American Economic Review 59:2 (May 1969): 251-260, https://www.jstor.org/stable/1823678.
[50] “Congestion Charge in London,” Visit London, https://www.visitlondon.com/traveller-information/getting-around-london/congestion-charge.
[51] Mayor of London, “Central London Congestion Charging: Impacts Monitoring,“ Transport for London, June 2006, https://content.tfl.gov.uk/fourth-annual-report-overview.pdf.
[52] Charles Komanoff, “Latest Data Show (Again!) That London‘s Congestion Pricing is Working,“ Streetsblog New York City, Feb. 6, 2023, https://nyc.streetsblog.org/2023/02/06/latest-data-shows-again-that-londons-congestion-pricing-is-working.
[53] Charles Komanoff, “Latest Data Show (Again!) That London‘s Congestion Pricing is Working.”
[54] Jeremy Yap and Evan Gwee, “Implementing Road and Congestion Pricing- Lessons from Singapore,” Workshop on Implementing Sustainable Urban Travel Policies in Japan and other Asia-Pacific countries (March 2005), https://docslib.org/doc/1545110/implementing-road-and-congestion-pricing-lessons-from-singapore.
[55] Sock-Yong Phang and Rex S. Toh, “Road Congestion Pricing in Singapore: 1975-2003,” Transportation Journal 43:2 (2004): 17-18, https://link.library.smu.edu.sg/cgi/viewcontent.cgi?article=1116&context=soe_research.
[56] Ibid.
[57] Jeremy Yap and Evan Gwee, “Implementing Road and Congestion Pricing- Lessons from Singapore.”
[58] Sock-Yong Phang and Rex S. Toh, “Road Congestion Pricing in Singapore: 1975-2003.”
[59] Jeremy Yap and Evan Gwee, “Implementing Road and Congestion Pricing- Lessons from Singapore.”
[60] Ibid.
[61] US Department of Transportation Federal Highway Administration, “Lessons Learned From International Experience in Congestion Pricing,” Mar. 29, 2021, https://ops.fhwa.dot.gov/publications/fhwahop08047/02summ.htm.
[62] Justine Jablonska, “How Stockholm broke its gridlock with congestion pricing,” IBM, Oct. 17, 2019, https://www.ibm.com/blog/stockholm-congestion-pricing-iot-analytics-government/.
[63] San Francisco County Transportation Authority, “Case Study: Stockholm,” Feb. 13, 2020, https://www.sfcta.org/sites/default/files/2020-02/Congestion%20Pricing%20Case%20Studies%20200213%20-%20Stockholm.pdf.
[64] Eric Jaffe, “Sweden’s Lesser-Known Congestion Pricing Program Is Also a Big Success,” Bloomberg, Apr. 20, 2015, https://www.bloomberg.com/news/articles/2015-04-20/gothenburg-sweden-s-congestion-pricing-program-is-a-big-success.
[65]GIZ, “Environmental Zones: Towards Better Air Quality in Inner Cities,” https://transformative-mobility.org/wp-content/uploads/2024/01/SUTP_GIZ_FS_EnvironmentalLow-Emissions-Zones_EN.pdf, accessed June 24, 2024; Lucia Rotaris, Romeo Danielis, Edoardo Marcucci, and Jerome Massiani, “The Urban Road Pricing Scheme to Curb Pollution in Milan, Italy: Description, Impacts and Preliminary Cost-Benefit Analysis Assessment,” Transportation Research Part A: Policy and Practice 44:5 (June 2010): 359-375, https://doi.org/10.1016/j.tra.2010.03.008.
[66] Area C Milano EN, “Milan’s Area C Statistics – Impact on Traffic & Pollution,” AreaCMilano.it, https://www.areacmilano.it/en/milan-area-c-statistics-iImpact-traffic-polution.html.
[67] Ana Ley and Winnie Hu, “Congestion Pricing Delay in New York Ripples Across Country,” The New York Times, Jun. 16, 2024, https://www.nytimes.com/2024/06/16/nyregion/congestion-pricing-delay-effects.html.
[68] Jarrett Walker, “Purpose-Driven Public Transport: Creating a Clear Conversation About Public Transport Goals,” Journal of Transport Geography 16 (2008), https://geography.upol.cz/soubory/lide/hercik/SEDOP/Purpose-driven%20public%20transport%20creating%20a%20clear%20conversation%20about%20public%20transport%20goals.pdf; see also Matt Johnson, “Comparing Metrobus and Metrorail Farebox Recovery is Apples and Oranges,” Greater Greater Washington, Mar. 6, 2014, https://ggwash.org/view/33967/comparing-metrobus-and-metrorail-farebox-recovery-is-apples-and-oranges.
[69] Jarrett Walker, “Basics: The Ridership – Coverage Tradeoff,” Human Transit, Feb. 26, 2018, https://humantransit.org/2018/02/basics-the-ridership-coverage-tradeoff.html.
[70] Amtrak, “How Do Long Distance Trains Perform Financially,” https://www.amtrak.com/content/dam/projects/dotcom/english/public/documents/corporate/position-papers/white-paper-amtrak-long-distance-financial-performance.pdf.
[71] Rachel Yang, “Essential Air Service.”
[72] John Frittelli, “Harbor Maintenance Trust Fund Expenditures.”
[73] Jarrett Walker, “Amtrak’s Long-Distance Trains: Not Just ‘Land Cruises,’” Human Transit, Aug. 11, 2023, https://humantransit.org/2023/08/amtraks-long-distance-trains-not-just-land-cruises.html.
[74] Michael Sargent, “End of the Runway: Rethinking the Airport Improvement Program and the Federal Role in Airport Funding,” The Heritage Foundation, Nov. 23, 2016, https://www.heritage.org/transportation/report/end-the-runway-rethinking-the-airport-improvement-program-and-the-federal.
[75] Edward Glaeser, Caitlin Gorback, and James Poterba, “How Regressive Are Mobility-Related User Fees and Gasoline Taxes.”
[76] Paul Sorensen, Liisa Ecola, and Martin Wachs, Mileage-Based User Fees for Transportation Funding (Santa Monica, CA: RAND Corporation, 2012).
[77] See, for instance, Robert Poole, “Interstate 2.0: Modernizing the Interstate Highway System via Toll Finance,” Reason Foundation, September 2013, https://reason.org/wp-content/uploads/files/modernizing_interstates_toll_finance.pdf.
Share this article