Key Findings
- Estimating the revenue raised by tariffs is not as straightforward as multiplying the amount of imports by the applicable tariffTariffs are taxes imposed by one country on goods imported from another country. Tariffs are trade barriers that raise prices, reduce available quantities of goods and services for US businesses and consumers, and create an economic burden on foreign exporters. rate. Direct tariff revenue is lowered by behavioral, offset, and dynamic economic effects. Further, the revenue is subject to high levels of political uncertainty given the potential for legal and congressional challenges to the authorities the US executive branch has used to impose tariffs. Revenue is only raised when the tariffs are in effect; if the tariffs are lifted due to negotiations, legal challenges, or congressional action, then revenue will cease.
- TaxA tax is a mandatory payment or charge collected by local, state, and national governments from individuals or businesses to cover the costs of general government services, goods, and activities. Foundation estimates a 10 percent universal tariff would raise $2.2 trillion over the 2025 through 2034 budget window on a conventional basis (0.6 percent of GDP), a 15 percent universal tariff would raise $2.9 trillion (0.8 percent of GDP), and a 20 percent universal tariff would raise $3.4 trillion (0.9 percent of GDP).
- Using Tax Foundation’s General Equilibrium Model to simulate the macroeconomic impact of tariffs, we estimate a 10 percent universal tariff would reduce GDP by 0.4 percent, a 15 percent universal tariff would reduce GDP by 0.6 percent, and a 20 percent universal tariff would reduce GDP by 0.8 percent.
- Incorporating the revenue feedback from the negative macroeconomic effects, we estimate smaller revenue gains over the 10-year budget window: $1.7 trillion from the 10 percent tariff, $2.2 trillion from the 15 percent tariff, and $2.6 trillion from the 20 percent tariff.
- US-imposed tariffs will also invite foreign retaliation, which will reduce US output and incomes. Retaliation will thus create negative revenue feedback but will not generate any additional revenue for the US government. We estimate that in-kind retaliation to 10 percent universal tariffs would reduce federal tax revenue by $278 billion, a 15 percent tariff by $401 billion, and a 20 percent tariff by $517 billion.
| GDP Impact | Conventional Revenue, 2025-2034, Billions | Dynamic Revenue, 2025-2034, Billions | Dynamic Revenue Assuming Tit-for-Tat Retaliation, 2025-2034, Billions | |
|---|---|---|---|---|
| 10% Universal Tariff | -0.4% | $2,171 | $1,721 | $1,443 |
| 15% Universal Tariff | -0.6% | $2,895 | $2,242 | $1,841 |
| 20% Universal Tariff | -0.8% | $3,400 | $2,556 | $2,040 |
The authors would like to thank the Peter G. Peterson Foundation for their generous support of this work.
Introduction
Prior to President Trump’s new actions, tariff revenues were on track to comprise less than 1.6 percent of federal tax revenue in fiscal year 2025.[1] Given the Trump administration’s actions so far in 2025, that figure is expected to change. His trade policies to date threaten the highest tariffs in decades.[2]
But how much revenue could really be raised by new tariffs? Could tariffs, a form of government finance heavily relied upon in the 18th and 19th centuries, function as a major source of revenue for a modern, developed economy in the 21st century?
To answer this question, we will begin by reviewing the Tax Foundation’s methodology for constructing a conventional revenue estimate, illustrating how a standard approach that accounts for behavioral effects and offsets reduces the direct revenue raised by tariffs. Next, we will discuss the Tax Foundation’s approach to estimating the macroeconomic impact of higher tariffs. Finally, we will provide a dynamic revenue estimate and address additional considerations that may impact revenue raised by tariffs, including foreign retaliation.
Estimating the Conventional Revenue Effect of Tariffs
A conventional revenue estimate holds nominal income in the economy constant, but it incorporates behavioral effects consistent with a fixed nominal income assumption.[3] A conventional revenue estimate for higher tariffs will thus not incorporate how tariffs would reduce the size of the US economy, but it will incorporate other behavioral effects. Tax Foundation’s tariff revenue estimates reflect how imports will fall in response to tariffs, how higher tariff payments mechanically reduce the bases of the income and payroll taxes, and how tariffs, like any other type of tax, are subject to avoidance and evasion.
To construct a pre-tariff baseline of imports, we begin with 2024 goods imports from the United States International Trade Commission (USITC) DataWeb and assume goods imports will grow by the total import growth rates the Congressional Budget Office (CBO) predicts over the 10-year budget window.[4]
Table 1. Baseline Forecast of Goods Imports, in Billions
| 2025 | 2026 | 2027 | 2028 | 2029 | 2030 | 2031 | 2032 | 2033 | 2034 | |
|---|---|---|---|---|---|---|---|---|---|---|
| Baseline Goods Imports | $3,353.7 | $3,451.9 | $3,603.8 | $3,730.5 | $3,852.0 | $3,984.8 | $4,141.1 | $4,303.0 | $4,468.5 | $4,634.8 |
In response to a new tariff, however, baseline imports will not remain at their pre-tariff levels. The relative price increase in imports will cause a drop in imports as people substitute away from higher-priced tariffed goods toward non-tariffed alternatives and, in cases of non-uniform tariffs, as trade may be diverted through countries not subject to the tariffs.
A study of 183 economies from 1995 through 2018 found an elasticity (measured as the change in trade flows exclusive of the tariff payments) of -0.76 the year following an exogenous tariff change that converged to -1.75 to -2.25 within 7 to 10 years.[5] Another study of 167 countries across 5,124 products at the six-digit level of the Harmonized System from 1996 to 2014 found a simple average elasticity of -1.7 for the United States and a binding, weighted-average elasticity of -0.997.[6] The elasticities in these studies demonstrate the change in trade flows in response to changes in import prices, and they each illustrate that it is unrealistic to expect imports to remain the same after a tariff causes import prices to rise.
Recent experience from the 2018-2019 trade war confirms the responsiveness of US imports to higher tariffs. Amiti et al. found that among the goods that continued to be imported, a 10 percent tariff was associated with a 10 percent drop in imports over the first three months and a 20 percent drop over the following months.[7] A review of the 2018-2019 tariffs on China by the USITC found an elasticity close to -1 in the first few months of the tariffs that rose to more than -2 near the end of the second year, noting the consistency with the fact that elasticities tend to be higher in the long run compared to the short run.[8]
Tariffs, like other types of taxes, also suffer from noncompliance. The overall tax gapThe tax gap is the difference between taxes legally owed and taxes collected. The gross tax gap in the U.S. accounts for at least 1 billion in lost revenue each year, according to the latest estimate by the IRS (2011 to 2013), suggesting a voluntary taxpayer compliance rate of 83.6 percent. The net tax gap is calculated by subtracting late tax collections from the gross tax gap: from 2011 to 2013, the average net gap was around 1 billion. (measured as the difference between taxes legally owed and taxes actually paid), for example, is about 15 percent of estimated taxes due, while the tax gap across various types of taxes ranges from 8 percent to 23 percent.[9] The tax gap is not a comprehensive or direct measure of behavioral responses to relative price changes but instead reflects noncompliance.
To estimate the impact on US imports of a universal tariff over the 10-year budget window, we use an elasticity of -0.997 and an additional noncompliance rate of 8 percent. In 2025, the tax baseThe tax base is the total amount of income, property, assets, consumption, transactions, or other economic activity subject to taxation by a tax authority. A narrow tax base is non-neutral and inefficient. A broad tax base reduces tax administration costs and allows more revenue to be raised at lower rates. for universal tariffs falls from $3.3 trillion to $2.7 trillion for a 10 percent tariff, $2.6 trillion for a 15 percent tariff, and $2.3 trillion for a 20 percent tariff.
Table 2. Tax Base for Universal Tariffs, in Billions
| 2025 | 2026 | 2027 | 2028 | 2029 | 2030 | 2031 | 2032 | 2033 | 2034 | |
|---|---|---|---|---|---|---|---|---|---|---|
| Tax Base for 10 Percent Universal Tariff | $2,747.0 | $2,827.4 | $2,951.9 | $3,055.7 | $3,155.2 | $3,264.0 | $3,392.0 | $3,524.6 | $3,660.2 | $3,796.4 |
| Tax Base for 15 Percent Universal Tariff | $2,554.7 | $2,629.5 | $2,745.3 | $2,841.8 | $2,934.4 | $3,035.5 | $3,154.6 | $3,277.9 | $3,404.0 | $3,530.7 |
| Tax Base for 20 Percent Universal Tariff | $2,347.1 | $2,415.8 | $2,522.2 | $2,610.9 | $2,695.9 | $2,788.8 | $2,898.2 | $3,011.5 | $3,127.4 | $3,243.7 |
To calculate the direct revenue effect of higher tariffs, we multiply the adjusted tax base by the inclusive tax rate (figured as the stated tax rate divided by one plus the stated tax rate).[10] The direct revenue raised by the tariffs will be offset by reductions in income and payroll taxes.[11] As discussed in detail below, taxes such as tariffs reduce the amount of income firms have to compensate factors of production. As a result, the tax bases of the corporate income taxA corporate income tax (CIT) is levied by federal and state governments on business profits. Many companies are not subject to the CIT because they are taxed as pass-through businesses, with income reportable under the individual income tax. , the individual income taxAn individual income tax (or personal income tax) is levied on the wages, salaries, investments, or other forms of income an individual or household earns. The U.S. imposes a progressive income tax where rates increase with income. The Federal Income Tax was established in 1913 with the ratification of the 16th Amendment. Though barely 100 years old, individual income taxes are the largest source of tax revenue in the U.S. , and the payroll taxA payroll tax is a tax paid on the wages and salaries of employees to finance social insurance programs like Social Security, Medicare, and unemployment insurance. Payroll taxes are social insurance taxes that comprise 24.8 percent of combined federal, state, and local government revenue, the second largest source of that combined tax revenue. shrink, offsetting some of the revenue raised from increasing tariffs. Using Tax Foundation’s tax calculator, we estimate income and payroll tax offsets average 26.6 percent over the next decade.
After making adjustments for the decline in imports, noncompliance, and income and payroll tax offsets, we estimate a 10 percent universal tariff would raise $2.2 trillion over the 2025 through 2034 budget window on a conventional basis (0.6 percent of GDP), a 15 percent universal tariff would raise $2.9 trillion (0.8 percent of GDP), and a 20 percent universal tariff would raise $3.4 trillion (0.9 percent of GDP).
Table 3. Conventional Revenue Estimates, in Billions
| 2025 | 2026 | 2027 | 2028 | 2029 | 2030 | 2031 | 2032 | 2033 | 2034 | 2025-2034 | |
|---|---|---|---|---|---|---|---|---|---|---|---|
| 10 Percent Universal Tariff | $189.8 | $190.2 | $196.0 | $203.1 | $210.6 | $218.1 | $227.1 | $236.1 | $245.7 | $254.5 | $2,171.1 |
| 15 Percent Universal Tariff | $253.0 | $253.7 | $261.4 | $270.9 | $280.8 | $290.9 | $302.8 | $314.9 | $327.7 | $339.4 | $2,895.5 |
| 20 Percent Universal Tariff | $297.1 | $297.9 | $306.9 | $318.1 | $329.7 | $341.6 | $355.6 | $369.8 | $384.7 | $398.4 | $3,399.7 |
Estimating the Macroeconomic Effect of Tariffs
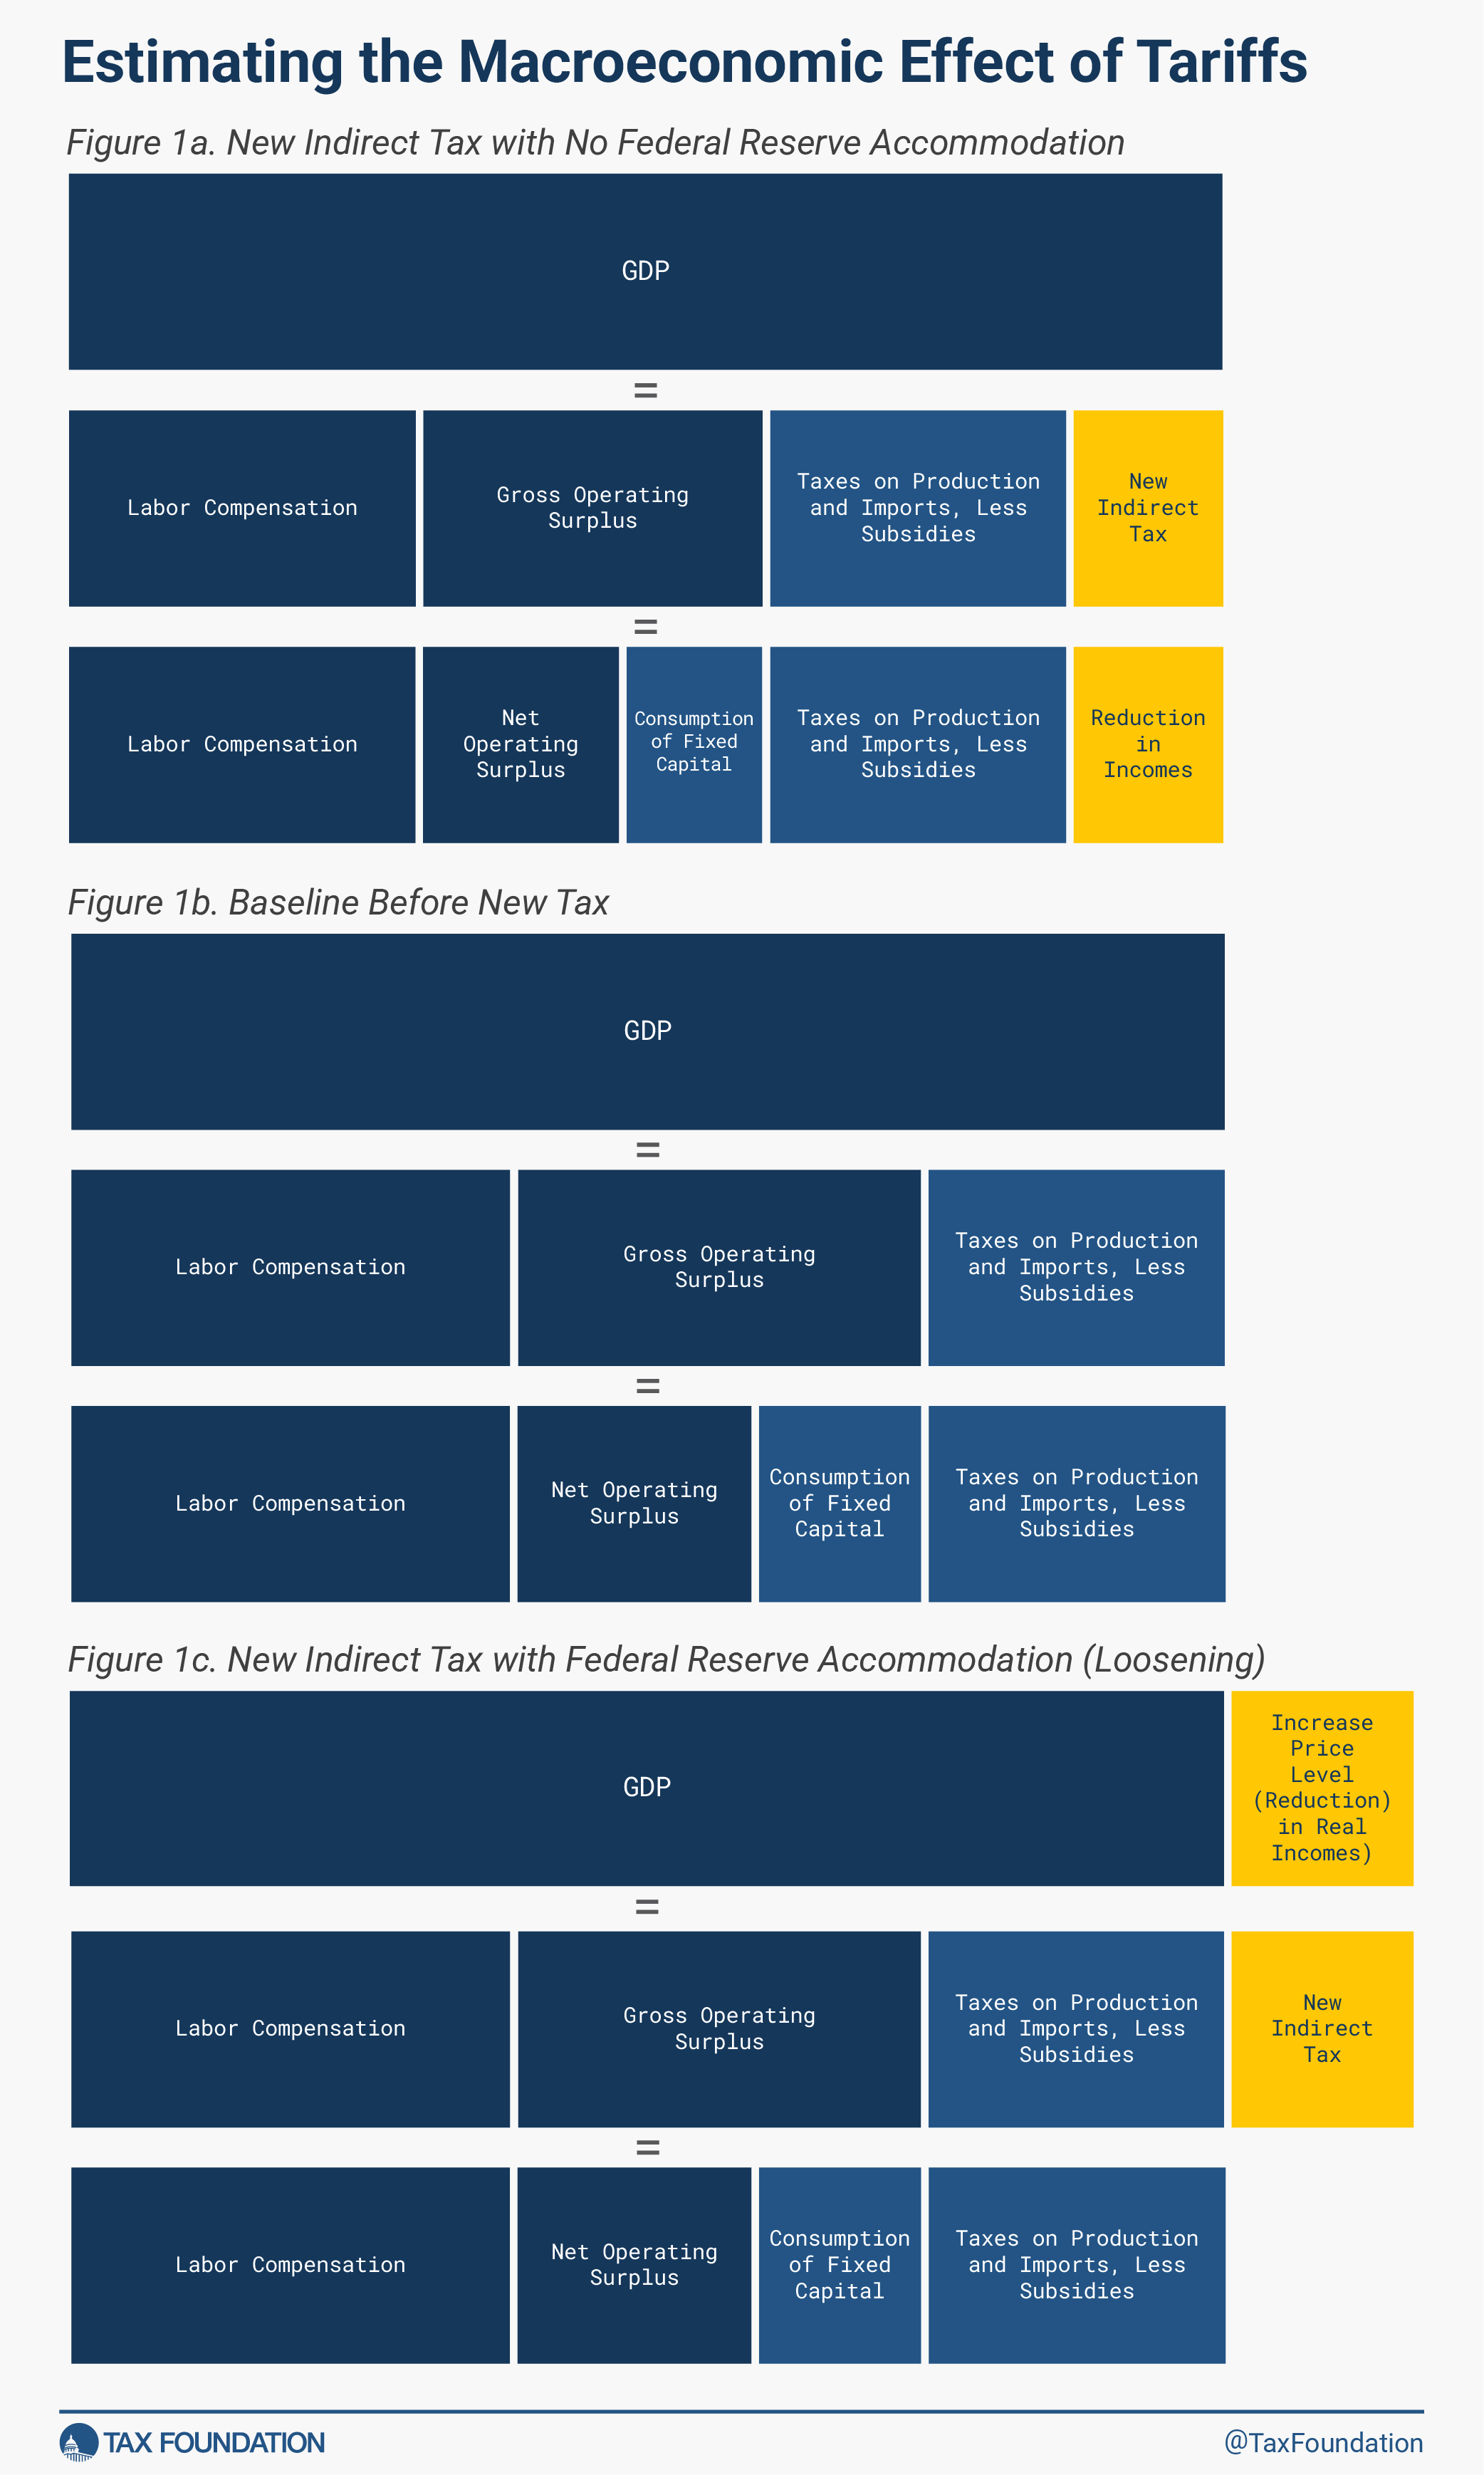
Tariffs are a type of excise taxAn excise tax is a tax imposed on a specific good or activity. Excise taxes are commonly levied on cigarettes, alcoholic beverages, soda, gasoline, insurance premiums, amusement activities, and betting, and typically make up a relatively small and volatile portion of state and local and, to a lesser extent, federal tax collections. applied to imported goods. As an excise tax, tariffs introduce a tax wedgeBroadly speaking, a tax wedge is the difference between the pre-tax price or return and after-tax price or return. For labor income, it is the difference between the total labor costs to the employer and the corresponding net take-home pay of the employee. between the price a consumer pays for a good and the price a producer receives for a good. The real impact of tariffs is largely the same whether the Federal Reserve accommodates them (loosens policy) or not. The figure below illustrates that the introduction of a new indirect taxAn indirect tax, unlike a direct tax such as the income tax, is a tax collected on a product by the retailer or manufacturer; however, the end consumer of the final product ultimately bears much of the burden through the higher price of a good or service. Sales and value-added taxes (VATs) are two examples of indirect taxes. , like a tariff, reduces real, after-tax incomes whether the price level remains constant (Figure 1a) or rises with the Federal Reserve’s loosening of monetary policy (Figure 1c).
The tax wedge introduced by tariffs reduces the amount of income left to pay workers and shareholders. Affected businesses may directly experience the reduction in income, or they may pass their tariff-related costs to their consumers. Though passing higher costs to consumers may allow firms to avoid a decrease in revenues, consumers then have less income remaining to purchase other goods and services, reducing income for businesses in sectors not taxed. In both cases, the reduction in income because of the higher tariff payments creates pressure to reduce nominal wages.
Figure 1a below illustrates that the introduction of a new indirect tax like tariffs directly reduces the income available to compensate labor and capital, compared to the baseline (Figure 1b) before the introduction of the tax. The imposition of a large enough tariff means firms would face pressures to decrease nominal wages. But considering nominal wage stickiness,[12] firms would be unable to do so.[13] Instead, firms would reduce employment.
An increase in unemployment arising from a large enough tax increase would prompt the Federal Reserve to raise the price level; employers could then hold nominal wages constant, but wages (and employment costs) would fall in real terms.[14] Federal Reserve accommodation through an increase in the price level largely leaves the economic effect of tariffs the same (Figure 1c); rather than nominal wages falling directly while the price level remains the same, nominal wages remain the same while the price level rises.
If the Federal Reserve accommodates higher tariffs with a one-time increase in the price level, it does not shift the burden of tariffs to a new or different group than if the price level remains constant. Figure 1c demonstrates that when the Federal Reserve accommodates so that nominal GDP rises by the amount of the tax, the real value of household income falls to the same extent as when the tax passes back and reduces factor incomes. In other words, the price level increase substitutes for the reduction in nominal wages that would otherwise occur.
Because tariffs are a tax on imports, some may think tariffs could be used to reduce imports and thus alter the overall balance of trade in the imposing country. Tariffs, however, do not have a direct impact on the trade balance. Instead, the balance of trade is driven by differences between domestic saving and domestic investment, which lead to net borrowing (and a trade deficit) or lending (and a trade surplus) with other countries.
A tax on imports will reduce imports, but it will also commensurately reduce exports, leading to a lower overall level of trade rather than a fundamental change in the balance of trade. The simplest way to understand this relationship is through what happens to currency values. After a US-imposed tariff, Americans import fewer goods and exchange fewer USD for foreign currencies, reducing the global supply of USD and demand for foreign currency. This pushes up the value of the USD, which immediately offsets some of the burden on imports and immediately shifts it to US exporters, as US exports become more expensive to foreign buyers. The relationship also explains why dollar appreciation in response to a US-imposed tariff does not reduce the economic harm; though a stronger dollar may offset some of the burden of tariffs on US importers, it shifts it to US exporters.[15]
Tax Foundation uses its General Equilibrium Model to simulate the macroeconomic effect of tariffs. The model has three main components that work together to produce estimates. The first component is a tax simulator, which produces estimates of marginal tax rates on different sources of personal and business income. The second component of the model is a neoclassical production function, which estimates long-run changes in the level of output based on changes in the capital stock and labor force in response to policy. The last component of the model is an allocation model, which takes outputs from the tax and production models and combines them with aggregate accounting identities and saving responses to forecast the different components of GDP, the balance between saving and investment, the international account, wealth, and gross national product (GNP).
To model the macroeconomic effect of tariffs, we simulate how the tax wedge on labor introduced by tariffs reduces incentives to work. The resulting reduction in labor supply reduces economic output, which reduces returns to capital and leads to less capital investment and a smaller capital stock.
We estimate the following long-run macroeconomic effects from universal tariffs of 10 percent, 15 percent, and 20 percent. A 10 percent universal tariff would reduce GDP by 0.4 percent in the long run and hours worked by 400,000 full-time equivalent jobs. A 15 percent universal tariff would reduce GDP by 0.6 percent and hours worked by 581,000 full-time equivalent jobs. Finally, a 20 percent universal tariff would reduce GDP by 0.8 percent and hours worked by 735,000 full-time equivalent jobs.
Some tariffs, namely those that apply to capital inputs, would have a direct effect on the cost of capital in the United States.[16] Additionally, in the long run, tariffs can further reduce productivity by reallocating workers and investment to less productive sectors of the economy.[17] We do not incorporate either effect into our modeling, and so it is likely that we understate the negative economic impact of tariffs.
Table 4. Long-Run Macroeconomic Impacts of a Universal Tariff
| 10% Universal Tariff | 15% Universal Tariff | 20% Universal Tariff | |
|---|---|---|---|
| GDP | -0.4% | -0.6% | -0.8% |
| Capital Stock | -0.4% | -0.5% | -0.7% |
| Pre-Tax Wages | 0.0% | 0.0% | 0.0% |
| Hours Worked Converted to Full-Time Equivalent Jobs | -400,000 | -581,000 | -735,000 |
Estimating the Dynamic Revenue Effect of Tariffs and Retaliation
The dynamic revenue estimate begins with the conventional estimate and incorporates the revenue feedback from the macroeconomic effects estimated with Tax Foundation’s General Equilibrium Model. A reduction in hours worked, the capital stock, and economic output reduces incomes and so reduces the tax base for federal taxes, resulting in negative revenue feedback.
We estimate that, on a dynamic basis, revenues raised by tariffs are approximately 16 percent to 20 percent lower than the conventional estimate over the 10-year budget window. The dynamic revenue estimate for the 10 percent universal tariffs falls by $450 billion on a dynamic basis to $1.7 trillion over the 10-year budget window. For a 15 percent universal tariff, the revenue falls by $654 billion to $2.2 trillion, and for a 20 percent universal tariff, the revenue falls by $843 billion to $2.6 trillion. These dynamic revenue estimates only reflect the effect of the US-imposed tariffs on the US economy; however, US tariffs are likely to be met with foreign tariffs, which must be accounted for too.
Table 5. Conventional and Dynamic Revenue Estimates, in Billions
| 2025 | 2026 | 2027 | 2028 | 2029 | 2030 | 2031 | 2032 | 2033 | 2034 | 2025-2034 | |
|---|---|---|---|---|---|---|---|---|---|---|---|
| 10% Universal Tariff, Conventional | $189.8 | $190.2 | $196.0 | $203.1 | $210.6 | $218.1 | $227.1 | $236.1 | $245.7 | $254.5 | $2,171.1 |
| 10% Universal Tariff, Dynamic | $152.6 | $150.8 | $154.2 | $160.1 | $166.3 | $172.4 | $179.9 | $187.1 | $195.8 | $201.6 | $1,720.8 |
| 10% Universal Tariff, Dynamic with Retaliation | $129.9 | $126.4 | $128.4 | $133.6 | $138.8 | $144.0 | $150.8 | $156.6 | $164.9 | $169.1 | $1,442.5 |
| 15% Universal Tariff, Conventional | $253.0 | $253.7 | $261.4 | $270.9 | $280.8 | $290.9 | $302.8 | $314.9 | $327.7 | $339.4 | $2,895.5 |
| 15% Universal Tariff, Dynamic | $199.2 | $196.4 | $201.0 | $208.5 | $216.7 | $224.6 | $234.5 | $243.8 | $255.0 | $262.3 | $2,241.9 |
| 15% Universal Tariff, Dynamic with Retaliation | $166.3 | $161.3 | $163.7 | $170.1 | $177.2 | $183.8 | $192.4 | $200.0 | $210.3 | $215.3 | $1,840.5 |
| 20% Universal Tariff, Conventional | $297.1 | $297.9 | $306.9 | $318.1 | $329.7 | $341.6 | $355.6 | $369.8 | $384.7 | $398.4 | $3,399.7 |
| 20% Universal Tariff, Dynamic | $227.8 | $224.2 | $229.0 | $237.7 | $247.0 | $256.0 | $266.8 | $277.6 | $291.0 | $299.4 | $2,556.5 |
| 20% Universal Tariff, Dynamic with Retaliation | $185.2 | $178.9 | $181.1 | $188.2 | $196.4 | $203.6 | $212.8 | $221.4 | $233.7 | $238.6 | $2,039.7 |
Foreign retaliation will result in harm to the US economy similar to the harm resulting from US-imposed tariffs: foreign tariffs reduce foreign demand for US exports, reducing incomes earned by US exporters. Retaliatory tariffs can cause dollar depreciationDepreciation is a measurement of the “useful life” of a business asset, such as machinery or a factory, to determine the multiyear period over which the cost of that asset can be deducted from taxable income. Instead of allowing businesses to deduct the cost of investments immediately (i.e., full expensing), depreciation requires deductions to be taken over time, reducing their value and discouraging investment. , which may offset some of the harms on exporters and transfer it to importers.
We estimate the following long-run macroeconomic effects from retaliatory tariffs of 10 percent, 15 percent, and 20 percent. A 10 percent retaliatory tariff would reduce GDP by 0.3 percent in the long run and hours worked by 252,000 full-time equivalent jobs. A 15 percent retaliatory tariff would reduce GDP by 0.4 percent and hours worked by 360,000 full-time equivalent jobs. Finally, a 20 percent retaliatory tariff would reduce GDP by 0.5 percent and hours worked by 460,000 full-time equivalent jobs.
Table 6. Long-Run Macroeconomic Impacts of Retaliatory Tariffs on US Exports
| 10% Retaliatory Tariff | 15% Retaliatory Tariff | 20% Retaliatory Tariff | |
|---|---|---|---|
| GDP | -0.3% | -0.4% | -0.5% |
| Capital Stock | -0.2% | -0.3% | -0.4% |
| Pre-Tax Wages | 0.0% | 0.0% | 0.0% |
| Hours Worked Converted to Full-Time Equivalent Jobs | -252,000 | -360,000 | -460,000 |
The negative macroeconomic effects of retaliatory tariffs shrink output and incomes in the US, which shrinks US tax revenues. Incorporating the negative effect results in $278 billion less revenue over the next decade from 10 percent retaliatory tariffs, $401 billion less revenue from 15 percent retaliatory tariffs, and $517 billion less revenue from 20 percent retaliatory tariffs. As a result, the total dynamic revenue estimate with retaliation falls to $1.4 trillion for 10 percent universal tariffs, $1.8 trillion for 15 percent universal tariffs, and $2.0 trillion for 20 percent universal tariffs.
Conclusion
Our analysis of hypothetical universal tariffs of 10 percent, 15 percent, and 20 percent illustrates that though the tariffs would generate revenue—ranging from $2.2 trillion to $3.4 trillion over a decade on a conventional basis—that revenue would diminish when accounting for the broader economic impact. A 10 percent tariff, for instance, would reduce GDP by 0.4 percent, with even greater economic losses under higher tariff rates. Our dynamic revenue estimates show a decline in projected revenue due to reduced economic output, lowering expected revenues to $1.7 trillion for a 10 percent tariff, $2.2 trillion for a 15 percent tariff, and $2.6 trillion for a 20 percent tariff. Revenue and US GDP would fall further with retaliation; the total dynamic revenue estimate with retaliation falls to $1.4 trillion for 10 percent universal tariffs, $1.8 trillion for 15 percent universal tariffs, and $2.0 trillion for 20 percent universal tariffs.
This hypothetical policy of universal tariffs and the results flowing from them is illustrative but should not be taken as capturing all of the likely outcomes. It assumes the tariff rates are maintained permanently or at least throughout the 10-year budget window, which is not consistent with the on-again, off-again tariff policies and threats issued by the Trump administration to date, nor the potential of litigation against tariffs or policy changes by future shifts in political control.
References
[1] Congressional Budget Office, “Revenue Projections, by Category,” https://www.cbo.gov/data/budget-economic-data#7.
[2] Erica York and Alex Durante, “Trump Tariffs: Tracking the Economic Impact of the Trump Trade War,” Tax Foundation, Mar. 7, 2025, https://taxfoundation.org/research/all/federal/trump-tariffs-trade-war/.
[3] See discussion in Joint Committee on Taxation, “The Income and Payroll Tax Offset to Changes in Excise Tax Revenues,” Dec. 23, 2011, https://www.jct.gov/getattachment/fe1ce409-c05f-4f1d-8c92-93496125f340/x-59-11-4378.pdf.
[4] United States International Trade Commission, “DataWeb,” https://dataweb.usitc.gov/trade/search/Import/HTS and Congressional Budget Office, “Economic Projections,” January 2025, https://www.cbo.gov/data/budget-economic-data#4.
[5] Christoph E. Boehm, Andrei A. Levchenko and Nitya Pandalai-Nayar. 2023. “The Long and Short (Run) of Trade Elasticities.” American Economic Review, 113 (4): 861–905, https://www.aeaweb.org/articles?id=10.1257/aer.20210225.
[6] Mahdi Ghodsi, Julia Grübler, Robert Stehrer, “Import Demand Elasticities Revisited,” The Vienna Institute for International Economic Studies, November 2016, https://wiiw.ac.at/import-demand-elasticities-revisited-dlp-4075.pdf.
[7] Mary Amiti, Stephen J. Redding, and David E. Weinstein, “Who’s Paying for the US Tariffs? A Longer-Term Perspective,” AEA Papers and Proceedings 110: 541–46, https://www.aeaweb.org/articles?id=10.1257/pandp.20201018.
[8] United States International Trade Commission, “Economic Impact of Section 232 and 301 Tariffs on U.S. Industries,” May 2023, https://www.usitc.gov/publications/332/pub5405.pdf.
[9] Internal Revenue Service, “Federal Tax Compliance Research: Tax Gap Estimates for Tax Years 2014–2016,” https://www.irs.gov/pub/irs-pdf/p1415.pdf.
[10] Using the exclusive tax rate to calculate the revenue raised by a consumption taxA consumption tax is typically levied on the purchase of goods or services and is paid directly or indirectly by the consumer in the form of retail sales taxes, excise taxes, tariffs, value-added taxes (VAT), or income taxes where all savings are tax-deductible. would overstate the nominal revenue raised; for example, see Joint Committee on Taxation, “Background on Cash-Flow and Consumption-Based Approaches to Taxation,” Dec. 6, 2023, https://www.jct.gov/getattachment/7514f4dc-4656-485a-a2a8-78cd727c851c/x-58-23.pdf: “A proportional tax on consumption at a rate of 25 percent would be equivalent to the 20-percent wage tax. To understand why, note that a 25-percent consumption tax means that for each $100 that the individual is willing to spend on consumption goods, only $80 worth of consumption goods can be purchased. The other $20 (25 percent of $80) is needed to pay the consumption tax.” If instead one calculated that the 25-percent consumption tax would raise $25 dollars based on $100 of consumer spending, the implicit assumption would be that consumer spending rises by the amount of the tax, overstating the nominal revenue raised.
[11] Joint Committee on Taxation, “Income And Payroll Tax Offsets To Changes In Excise Tax Revenues For 2024–2034,” Mar. 14, 2024, https://www.jct.gov/publications/2024/jcx-9-24/.
[12] That is, it is generally difficult to reduce nominal wages paid to workers.
[13] See Alan Viard, “Tax Increases and the Price Level,” Tax Notes, Jan. 6, 2014, https://www.aei.org/wp-content/uploads/2014/01/-viard-tax-increases-and-the-price-level_091340576369.pdf?x85095.
[14] See discussion in Kyle Pomerleau and Erica York, “Understanding the Effects of Tariffs,” AEI Economic Perspectives, forthcoming.
[15] Temporary or chaotic tariffs may have a more muted impact on currency values. See discussion in Alan Cole, “How Will President Trump’s Tariffs Affect the Value of the Dollar?,” Tax Foundation, Apr. 2, 2025, https://taxfoundation.org/blog/trump-tariffs-us-dollar-currency-appreciation/.
[16] Pomerleau and York, “Understanding the Effects of Tariffs.”
[17] Ibid.
Share this article