Note: All data and methodological notes are accessible in our GitHub repository.
Key Findings
- A capital allowanceA capital allowance is the amount of capital investment costs, or money directed towards a company’s long-term growth, a business can deduct each year from its revenue via depreciation. These are also sometimes referred to as depreciation allowances. is the amount of capital investment costs a business can deduct from its revenue through the taxA tax is a mandatory payment or charge collected by local, state, and national governments from individuals or businesses to cover the costs of general government services, goods, and activities. code via depreciationDepreciation is a measurement of the “useful life” of a business asset, such as machinery or a factory, to determine the multiyear period over which the cost of that asset can be deducted from taxable income. Instead of allowing businesses to deduct the cost of investments immediately (i.e., full expensing), depreciation requires deductions to be taken over time, reducing their value and disco.
- Ideally, countries should provide higher capital allowances, as they can boost business investment which, in turn, spurs economic growth.
- The average of OECD countries’ capital allowances gradually decreased between 2000 and 2017, but then increased between 2018 and 2022.
- Many temporary measures of accelerated depreciation introduced in response to the pandemic-induced economic crisis are set to expire in 2023. If these changes are not made permanent, businesses might consider postponing or reducing investment.
- Even relatively low rates of inflationInflation is when the general price of goods and services increases across the economy, reducing the purchasing power of a currency and the value of certain assets. The same paycheck covers less goods, services, and bills. It is sometimes referred to as a “hidden tax,” as it leaves taxpayers less well-off due to higher costs and “bracket creep,” while increasing the government’s spendin can significantly reduce the values of deductions for long-term investments. An increase in inflation from 2 percent to 9.5 percent reduces the investment costs businesses can recover by up to 15 percentage points.
- Rising inflation creates pressure on business investment, and Mexico and Israel are currently the only OECD countries that adjust capital allowances for inflation.
- Several smaller OECD countries not only allow higher capital allowances but also levy lower corporate income taxA corporate income tax (CIT) is levied by federal and state governments on business profits. Many companies are not subject to the CIT because they are taxed as pass-through businesses, with income reportable under the individual income tax. rates, making them more attractive for capital investment.
Table of Contents
- Introduction
- The Basics of Depreciation Schedules and Capital Allowances
- Capital Allowances and Economic Growth
- Capital Allowances in the OECD, as of 2022
- Temporary Measures of Accelerated Depreciation
- Capital Allowances in Selected OECD Countries
- Capital Cost Recovery in the OECD since 2000
- Corporate Income Tax Rates in the OECD
- Conclusion
- Appendix
Introduction
The ongoing economic uncertainty from Russia’s war in Ukraine, post-pandemic economic recovery, supply chain disruptions, and current inflationary pressures have highlighted the importance of investment. Policymakers around the world are working to support critical infrastructure, transition to an environmentally sustainable economy, and gear their economic policies toward growth.
In 2019, private sector investment in OECD countries outpaced public investment by five to one. According to data from the International Monetary Fund (IMF), the average OECD country saw nearly $300 billion in private investment compared to $55 billion in public investment. Ensuring a stable environment for business investment will be critical in the coming years.[1]
Although sometimes overlooked in discussions about corporate taxation, capital cost recoveryCost recovery refers to how the tax system permits businesses to recover the cost of investments through depreciation or amortization. Depreciation and amortization deductions affect taxable income, effective tax rates, and investment decisions. plays an important role in defining a business’s corporate tax baseThe tax base is the total amount of income, property, assets, consumption, transactions, or other economic activity subject to taxation by a tax authority. A narrow tax base is non-neutral and inefficient. A broad tax base reduces tax administration costs and allows more revenue to be raised at lower rates. and can impact these investment decisions—with far-reaching consequences. When businesses are not allowed to fully deduct capital expenditures in real terms, they make fewer capital investments, which also reduces worker productivity and wages.[2] Thus, businesses should be allowed to fully deduct their capital investments in real terms—either through full expensingFull expensing allows businesses to immediately deduct the full cost of certain investments in new or improved technology, equipment, or buildings. It alleviates a bias in the tax code and incentivizes companies to invest more, which, in the long run, raises worker productivity, boosts wages, and creates more jobs. or neutral cost recovery.[3]
Capital cost recovery varied greatly across OECD countries in 2022, ranging from 100 percent in real terms in Chile, Estonia, and Latvia to only 49.6 percent in New Zealand and 58 percent in Colombia (covering industrial buildings, machinery, and intangibles). After years in which many OECD countries changed their capital allowances rules due to the pandemic, no major changes occurred in 2022. However, many of the temporary measures of accelerated depreciation will end in 2023.
On average, businesses in the OECD can recover 70.7 percent of the cost of capital investments in real terms. Investments in machinery enjoy the best treatment, with an OECD average of 87.2 percent, followed by intangibles (77.5 percent) and industrial buildings (50.7 percent). In 2000, businesses were able to recover on average 70.4 percent of capital investment costs in the OECD, followed by a gradual decline and then an increase beginning in 2018.
Inflationary pressures will decrease the value of capital cost allowances and thus increase the cost of new investments. For consistency, this report assumes an inflation rate of 2 percent, but such a low inflation rate is rare in the current economy. Mexico and Israel are currently the only OECD countries to adjust capital allowances for inflation.
Since 2000, statutory corporate income tax rates have declined significantly across the world and in OECD countries.[4] However, as the average tax treatment of capital investments worsened for most of the last two decades, the benefits of lower statutory rates for investment and growth were partially offset. This broadening of tax bases through lower capital allowances is one of the reasons why corporate tax revenues had been growing or were stable around the world despite declining statutory rates.[5]
The Basics of Depreciation Schedules and Capital Allowances
Before exploring the data more closely, it is worth understanding some of the terminology used in this area of corporate taxation:
- Governments set depreciation schedules to define how businesses can deduct their capital investment costs from their revenues over several years.
- The amount of investment costs a business can deduct in a year is called a capital allowance.
- Full expensing allows businesses to deduct the full cost of a capital investment in the year of acquisition rather than following a multiyear depreciation schedule.
- Accelerated depreciation or bonus depreciationBonus depreciation allows firms to deduct a larger portion of certain “short-lived” investments in new or improved technology, equipment, or buildings in the first year. Allowing businesses to write off more investments partially alleviates a bias in the tax code and incentivizes companies to invest more, which, in the long run, raises worker productivity, boosts wages, and creates more jobs. increases capital allowances in earlier years and is often used to stimulate investment during economic downturns.
- Capital cost recovery rates reflect the net present value of capital allowances a business can deduct for a given capital investment over the full depreciation period.
Businesses determine their profits by subtracting costs (such as wages, raw materials, and equipment) from revenue. However, in most jurisdictions, capital investments are not treated like other costs that can be subtracted from revenue in the year that the money is spent. This introduces a bias toward short-term projects, with little or no capital investment.
Instead, depreciation schedules specify the life span of an asset—often derived from the economic life of an asset—and determine the number of years over which an asset must be written off. By the end of the depreciation period, the business would have deducted the initial dollar cost of the asset.[6] However, in most cases, depreciation schedules do not consider the time value of money (a normal return plus inflation).[7]
Depreciation schedules can be based on different methods, with straight-line depreciation and declining-balance depreciation the most common. The methods define how annual capital allowances are calculated. While the straight-line method depreciates an asset by an equal allowance each year, the declining-balance method bases the annual allowance on the remaining book value of the asset. (See the Appendix for example calculations.)
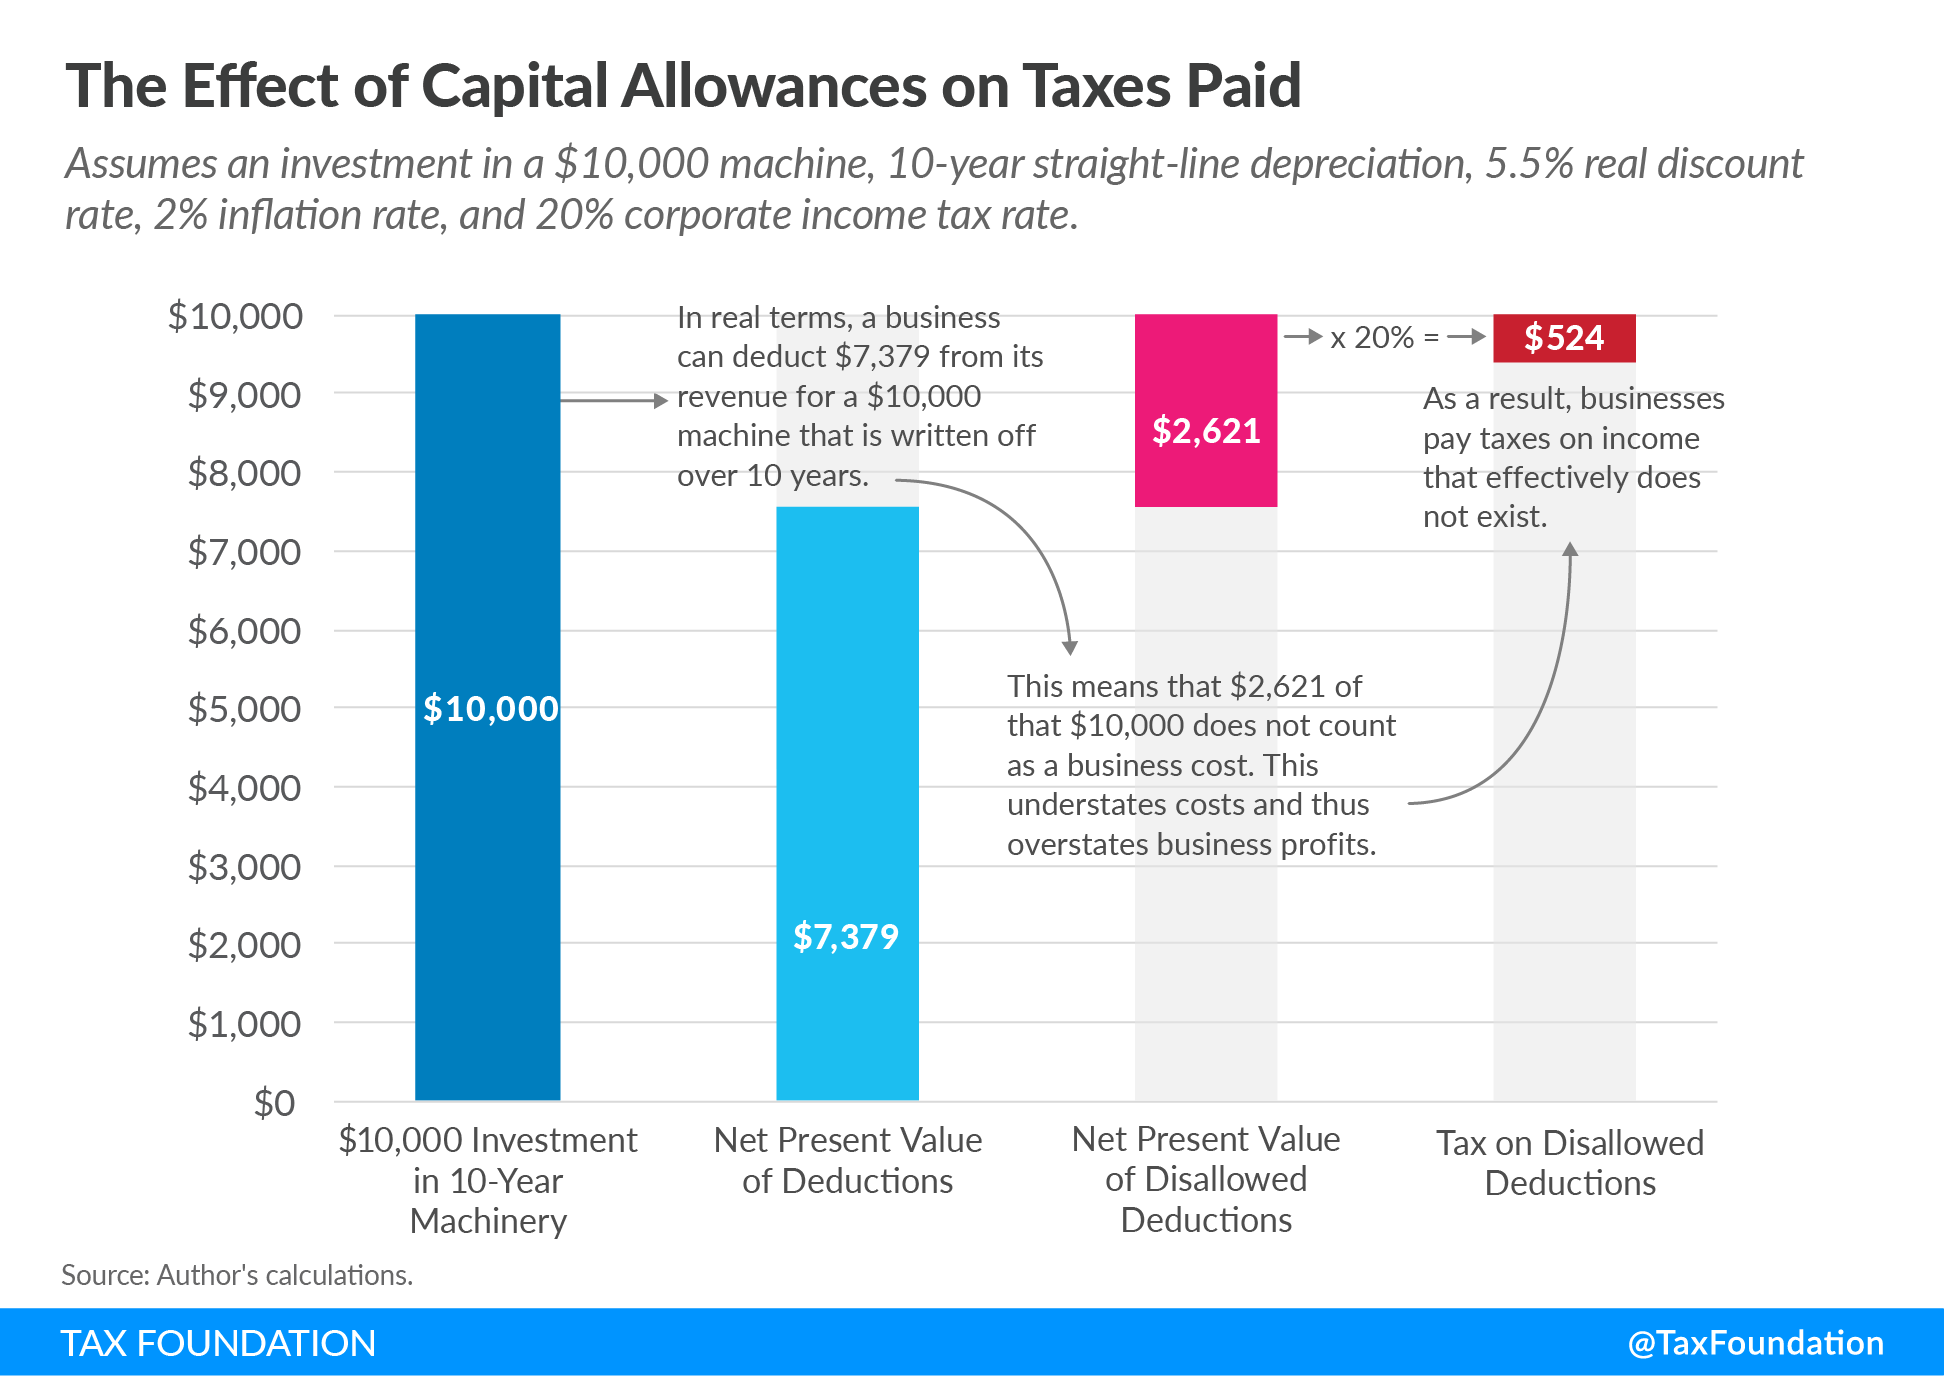
Such depreciation schedules define how much of capital investment costs a business can deduct in real terms. For instance, assume a machine costs $10,000 and is subject to a life span of 10 years. Under straight-line depreciation, a business could deduct $1,000 every year for 10 years. However, due to the time value of money, a deduction of $1,000 in later years is not as valuable in real terms as today’s deduction. If inflation is 2 percent and the required real return on investment is 5.5 percent, then at the end of the 10-year period, the value of that last deduction will be just $522 in today’s terms. In total, the business will only be able to deduct $7,379 instead of the full $10,000, just 73.8 percent of the total. This understates true business costs and inflates taxable profits, effectively taxing profits that do not exist.
This effect is exacerbated by longer depreciation schedules and higher inflation. Lower capital allowances, and thus a higher cost of capital, can lead to a decline in business investment, reductions in the productivity of capital, and lower wages.[8]
Capital allowances can be expressed as a percentage of the net present value of investment costs that businesses can write off over the life of an asset—the so-called capital cost recovery rate. A 100 percent capital cost recovery rate represents a business’s ability to deduct the full cost of the investment (including a normal return plus inflation) over its life (e.g., through full expensing or neutral cost recovery). A capital cost recovery rate above 100 percent represents the possibility for businesses to deduct more than the full cost of an investment. The lower the capital cost recovery rate, the more a business’s taxable income is inflated and the more its tax bill is overstated, making capital investment more expensive.
Capital Allowances and Economic Growth
Although sometimes overlooked as a more technical issue, capital allowances can have important economic impacts. Depending on their structure, they can either boost or slow investment which, in turn, impacts economic growth.
Lower Capital Allowances Lead to Slower Economic Growth
Any cost recovery system that does not allow the full write-off of an investment—full expensing—in the year the investment is made denies recovery of a part of that investment, inflates the taxable incomeTaxable income is the amount of income subject to tax, after deductions and exemptions. Taxable income differs from—and is less than—gross income. , and increases the taxes paid by businesses.[9] Lower capital allowances increase the cost of capital, which leads to slower investment and a reduction of the capital stock, reducing productivity, employment, and wages.[10]
Prior research has found evidence that investment is sensitive to changes in the cost of capital. In a literature review, economists Kevin Hassett and R. Glenn Hubbard found “a consensus has emerged [among economists] that investment demand is sensitive to taxation.” In other words, as a result of either longer asset lives or a higher corporate income tax rate, the demand for capital decreases and levels of investment decline, reducing the growth in the capital stock.[11] A 2023 study finds that investment is also sensitive to inflation. In a scenario with a corporate tax rate of 22 percent, a depreciation rate of 25 percent, and an inflation rate of 2 percent, a one-percentage-point increase in inflation reduces the optimal investment level by 0.42 percent.[12] A reduction in the capital stock leads to lower wages for workers and slower economic growth.[13]
In recent years, more empirical results on such investment effects have emerged. A 2017 study by economists Eric Zwick and James Mahon shows that bonus depreciation implemented in the United States raised investment in eligible capital relative to ineligible capital by 10.4 percent between 2001 and 2004 and by 16.9 percent between 2008 and 2010. In addition, their findings showed that small firms are dramatically more sensitive to the policy change than large firms.[14]
A study conducted by economists Giorgia Maffini, Jing Xing, and Michael P. Devereux estimates the effect of accelerated depreciation allowances the UK introduced in 2004. Their results show that “the investment rate of qualifying companies increased 2.1-2.5 percentage points relative to those that did not qualify.”[15] Economists Yongzheng Liu and Jie Mao found that China’s switch from a production-based VAT to a consumption-based VAT—meaning there is now an investment tax creditA tax credit is a provision that reduces a taxpayer’s final tax bill, dollar-for-dollar. A tax credit differs from deductions and exemptions, which reduce taxable income rather than the taxpayer’s tax bill directly.—also had a positive effect on investment.[16]
Unequal Capital Allowances Create a Distortion among Different Investments in the Economy
It is also important to note that capital allowances can distort the relative costs of different investments and thus alter the mix of capital in an economy. A government could lengthen depreciation schedules for machinery, which would slow investment in machinery, harming the manufacturing industry. Likewise, if depreciation schedules are shortened, or if businesses are allowed expensing of machinery, this increase in capital allowances may spur more machinery investment relative to other investment in the country.
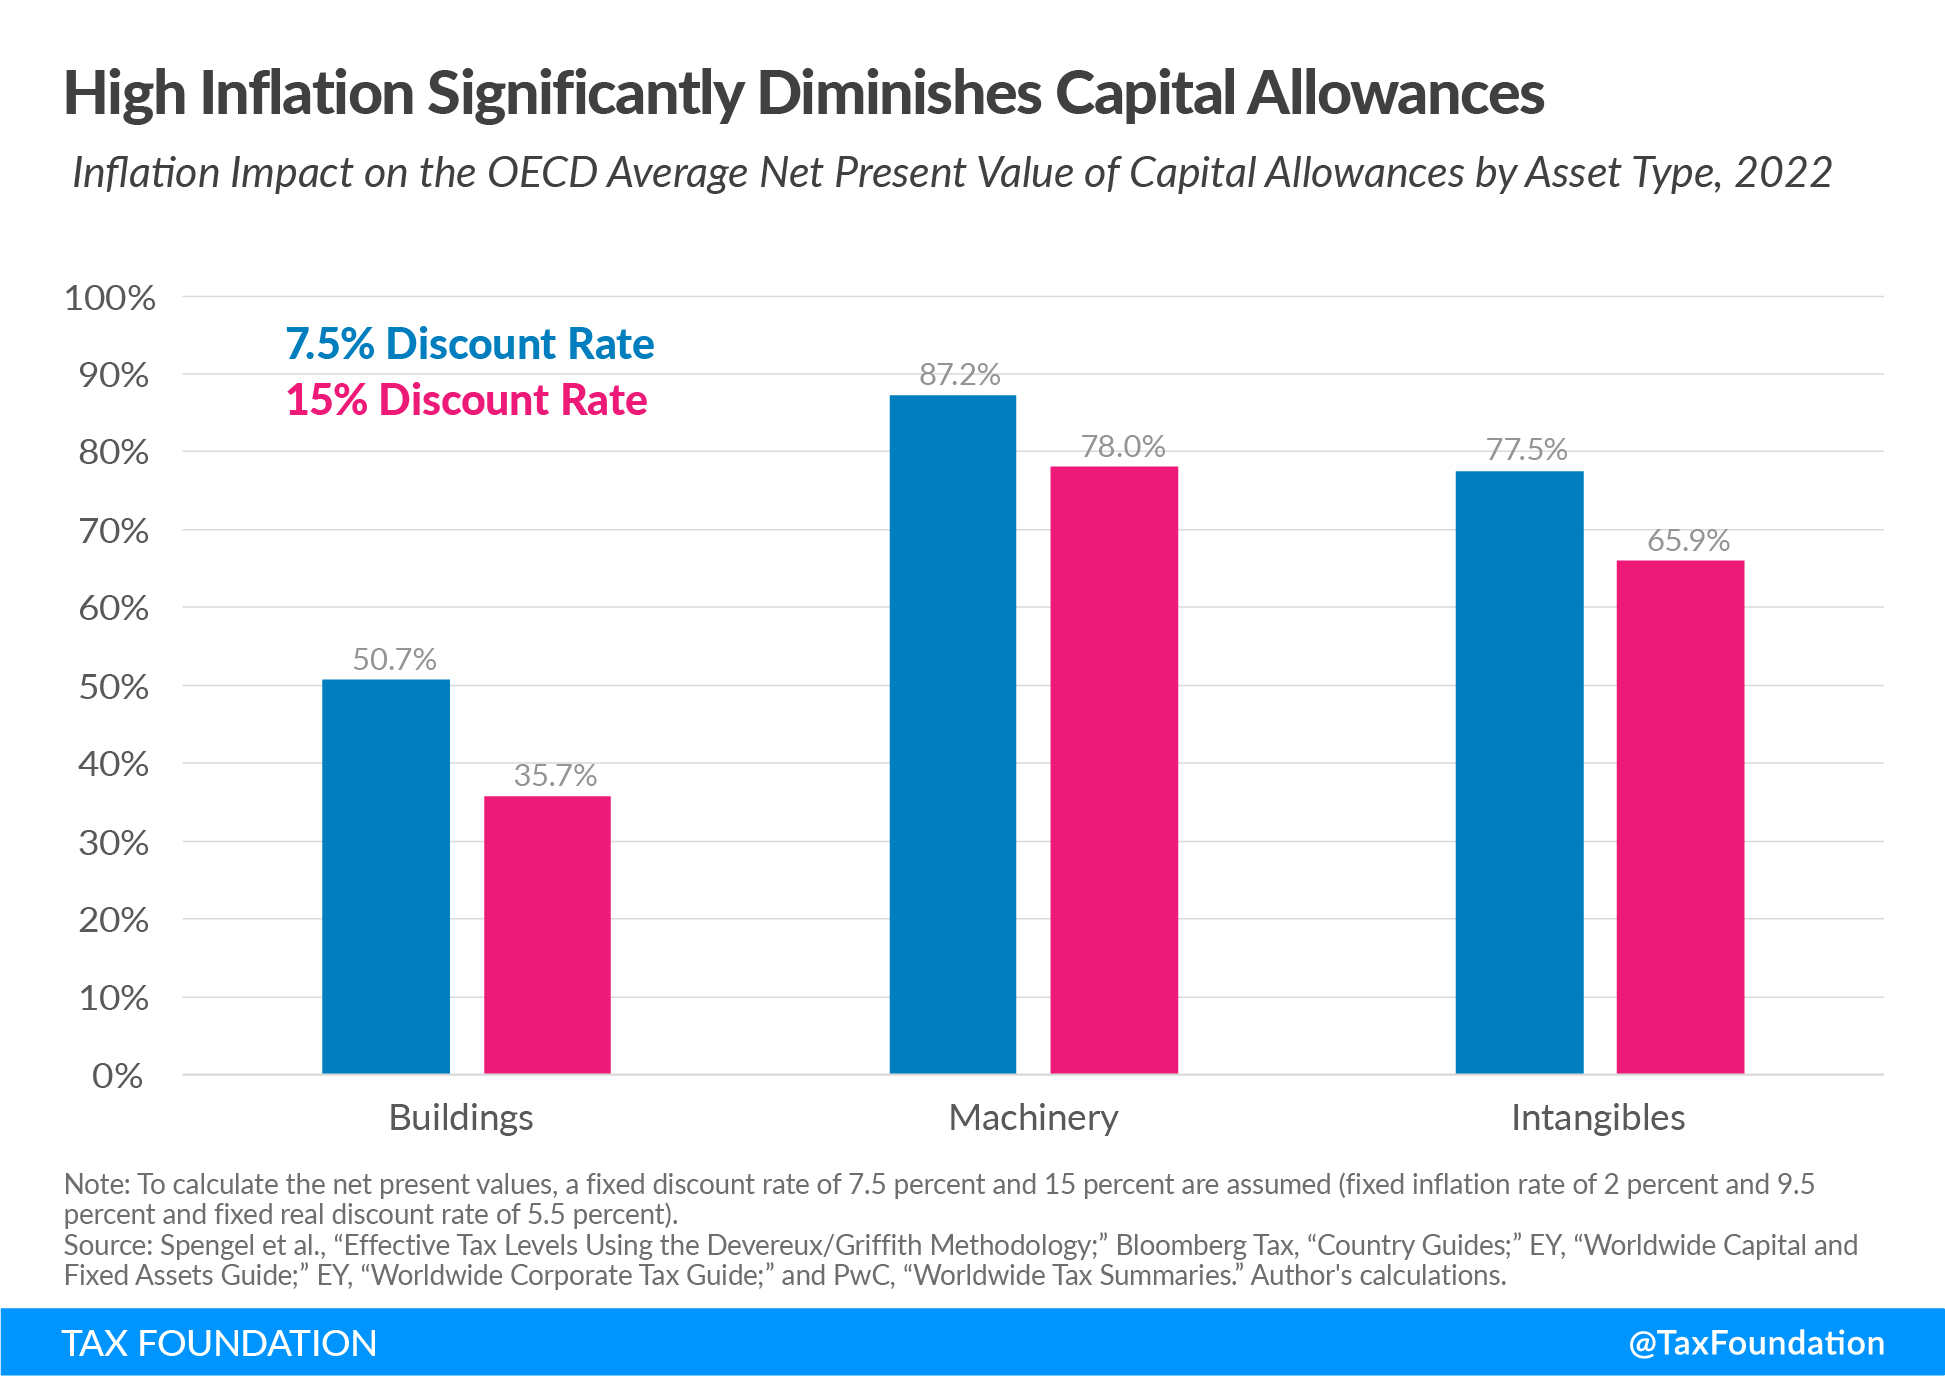
Looking at the average capital cost recovery rate in OECD countries by asset type, stark differences are evident. Businesses in the OECD are able to recover on average 87.2 percent of investment costs in machinery and 77.5 percent in intangibles, while only 50.7 percent for buildings.
Additionally, in high-inflation scenarios like the current one—where the OECD annual inflation was 9.6 percent in 2022—the investment amount businesses are able to recover is significantly diminished.[17] If inflation is 9.5 percent and the required real return on investment is 5.5 percent, then businesses in the OECD will be able to recover on average only 35.7 percent for buildings, 78 percent for machinery, and 65.9 percent for intangibles. Therefore, an increase in inflation from 2 percent to 9.5 percent reduces the amount of investment that can be recovered by up to 15 percentage points. But even relatively low rates of inflation can significantly reduce the values of deductions for long-term investments.
Tax changes in the United States have given preferential tax treatment to certain assets over others, which has led to changes in the composition of investment. In 2003, the United States passed the Jobs and Growth Tax Relief Reconciliation Act of 2003 (JGTRRA). Part of this law allowed for partial expensing of certain capital equipment, increasing capital allowances and reducing the cost of other capital investments by as much as 15 percent.[18] Research on this change found that “investment increased the most for equipment with a longer recovery period and that ‘bonus depreciation had a powerful effect on the composition of investment.’”[19]
If a country cuts its corporate tax rate while limiting capital allowances, it can lead to a shift in the economy from more capital-intensive industries to sectors that rely less on capital investment. This is the case in the 2010s in the UK, which traded longer asset lives for a lower corporate tax rate and saw business investment suffer.[20] The differential treatment of capital-intensive industries over other sectors has likely contributed to the worsening of trends that have revealed significant differences in regional economic output in the UK.[21]
Capital Allowances in the OECD, as of 2022
The treatment of capital allowances varies greatly across OECD countries. As of 2022, the lowest-ranking country, New Zealand, allowed its businesses to recover on average only 49.6 percent of capital investment costs, while the highest-ranking countries—Chile, Estonia, and Latvia—allowed their businesses to recover 100 percent. This wide range is largely due to countries’ vastly different corporate tax structures, depreciation schemes, and incentives designed to prioritize certain asset types over others.
| Country | Weighted Average Rank | Weighted Average Allowance | Buildings Rank | Buildings Allowance | Machinery Rank | Machinery Allowance | Intangibles Rank | Intangibles Allowance |
|---|---|---|---|---|---|---|---|---|
| Chile (CL) | 1 | 100.0% | 1 | 100.0% | 2 | 100.0% | 1 | 100.0% |
| Estonia (EE) | 2 | 100.0% | 2 | 100.0% | 3 | 100.0% | 2 | 100.0% |
| Latvia (LV) | 2 | 100.0% | 2 | 100.0% | 3 | 100.0% | 2 | 100.0% |
| Lithuania (LT) | 4 | 88.2% | 4 | 82.7% | 9 | 90.5% | 4 | 96.6% |
| United Kingdom (GB)* | 5 | 85.5% | 26 | 39.1% | 1 | 130.0% | 17 | 82.7% |
| Italy (IT) | 6 | 76.3% | 7 | 57.7% | 16 | 87.0% | 5 | 96.5% |
| Iceland (IS) | 7 | 74.7% | 5 | 60.2% | 21 | 86.0% | 19 | 81.2% |
| France (FR) | 8 | 74.2% | 10 | 54.8% | 12 | 88.0% | 7 | 87.0% |
| Switzerland (CH) | 9 | 74.1% | 9 | 55.5% | 21 | 86.0% | 6 | 90.5% |
| Korea (KR) | 10 | 74.0% | 10 | 54.8% | 8 | 92.2% | 22 | 73.8% |
| Slovakia (SK) | 11 | 73.9% | 10 | 54.8% | 13 | 87.4% | 7 | 87.0% |
| Belgium (BE) | 12 | 73.7% | 10 | 54.8% | 16 | 87.0% | 7 | 87.0% |
| Finland (FI) | 13 | 73.4% | 17 | 51.9% | 7 | 93.5% | 22 | 73.8% |
| Czech Republic (CZ) | 14 | 73.3% | 16 | 54.3% | 13 | 87.4% | 16 | 84.1% |
| Austria (AT) | 15 | 73.2% | 8 | 56.7% | 11 | 88.4% | 22 | 73.8% |
| Portugal (PT) | 16 | 72.6% | 10 | 54.8% | 10 | 88.8% | 22 | 73.8% |
| Luxembourg (LU) | 17 | 71.1% | 18 | 47.9% | 15 | 87.3% | 7 | 87.0% |
| Sweden (SE) | 18 | 70.3% | 18 | 47.9% | 21 | 86.0% | 15 | 86.0% |
| Canada (CA) | 19 | 68.8% | 25 | 42.6% | 3 | 100.0% | 37 | 49.0% |
| Denmark (DK) | 20 | 68.2% | 18 | 47.9% | 27 | 82.7% | 18 | 81.3% |
| United States (US) | 21 | 67.7% | 32 | 35.0% | 3 | 100.0% | 34 | 63.3% |
| Germany (DE) | 22 | 66.3% | 26 | 39.1% | 26 | 84.7% | 7 | 87.0% |
| Israel (IL) | 23 | 66.1% | 26 | 39.1% | 16 | 87.0% | 20 | 78.7% |
| Turkey (TR) | 24 | 66.1% | 24 | 43.1% | 20 | 86.4% | 32 | 69.4% |
| Mexico (MX) | 25 | 66.0% | 10 | 54.8% | 34 | 73.8% | 22 | 73.8% |
| Slovenia (SI) | 26 | 65.3% | 26 | 39.1% | 16 | 87.0% | 22 | 73.8% |
| Australia (AU) | 27 | 65.3% | 18 | 47.9% | 25 | 85.1% | 35 | 54.8% |
| Ireland (IE) | 28 | 63.9% | 18 | 47.9% | 31 | 78.7% | 33 | 64.6% |
| Greece (GR) | 29 | 63.1% | 18 | 47.9% | 34 | 73.8% | 22 | 73.8% |
| Netherlands (NL) | 30 | 62.6% | 33 | 33.8% | 30 | 81.3% | 7 | 87.0% |
| Spain (ES) | 31 | 61.3% | 26 | 39.1% | 33 | 77.9% | 22 | 73.8% |
| Japan (JP) | 32 | 60.9% | 36 | 27.9% | 24 | 85.9% | 20 | 78.7% |
| Costa Rica (CR) | 33 | 60.9% | 5 | 60.2% | 28 | 82.2% | 38 | 0.0% |
| Norway (NO) | 34 | 60.7% | 31 | 37.4% | 32 | 78.2% | 22 | 73.8% |
| Poland (PL) | 35 | 59.3% | 33 | 33.8% | 34 | 73.8% | 7 | 87.0% |
| Hungary (HU) | 36 | 58.3% | 36 | 27.9% | 29 | 81.6% | 22 | 73.8% |
| Colombia (CO) | 37 | 58.0% | 35 | 30.6% | 34 | 73.8% | 7 | 87.0% |
| New Zealand (NZ) | 38 | 49.6% | 38 | 22.6% | 38 | 73.2% | 35 | 54.8% |
| OECD Average | 70.71% | 50.67% | 87.17% | 77.53% | ||||
|
Notes: To calculate the net present values, a fixed discount rate of 7.5 percent is assumed (fixed inflation rate of 2 percent and fixed real discount rate of 5.5 percent). Weighted averages are weighted by an estimate of each asset’s respective share of the capital stock (machinery: 44 percent; industrial buildings: 41 percent; and intangibles: 15 percent). *The United Kingdom has a 130% super-deduction in place until the spring of 2023 as part of a transition from the current 19 percent corporate income tax to a proposed 25 percent corporate income tax (25 is 1.3 times 19). Sources: Christoph Spengel, Frank Schmidt, Jost Heckemeyer, and Katharina Nicolay, “Effective Tax Levels Using the Devereux/Griffith Methodology,” European Commission, October 2021, https://ec.europa.eu/taxation_customs/system/files/2022-03/final_report_2021_effective_tax_levels_revised_en.pdf; Bloomberg Tax, “Country Guides,” https://www.bloomberglaw.com/product/tax/toc_view_menu/3380/node/3380; EY, “Worldwide Capital and Fixed Assets Guide 2022,” July 27, 2022, https://www.ey.com/en_gl/tax-guides/worldwide-capital-and-fixed-assets-guide; EY, “Worldwide Corporate Tax Guide 2022,” Aug. 1, 2022, https://www.ey.com/en_gl/tax-guides/worldwide-corporate-tax-guide; PwC, “Worldwide Tax Summaries,” https://taxsummaries.pwc.com/; and author’s calculations. |
||||||||
Investment in industrial buildings has relatively poor tax treatment in the OECD, with an average allowance of only 50.7 percent. In 2022, Chile, Estonia, and Latvia had the best treatment of industrial buildings at 100 percent. Chile implemented temporary full expensing for all assets in 2020 (it expired at the end of 2022), and Estonia and Latvia operate cash-flow tax systems. The countries with the lowest capital cost recovery rates for industrial buildings are New Zealand (22.6 percent), Hungary (27.9 percent), and Japan (27.9 percent).
Machinery generally has the best tax treatment, with an OECD average allowance of 87.2 percent. As of 2022, Canada, Chile, and the United States were above average, at 100 percent, due to temporary full expensing of investments in machinery. Both the U.S. and Canada will begin to phase their allowances down soon with the U.S. phaseout beginning in 2023 and Canada’s in 2024. The United Kingdom temporarily had 130 percent deductions for machinery until the end of March 2023. From April 1, 2023, the United Kingdom temporarily has full expensing for machinery. Estonia and Latvia also have full cost recovery of investments in machinery, again due to their cash-flow tax systems. The country with the worst tax treatment of investments in machinery is New Zealand, with an allowance of only 73.2 percent.
The average capital allowance for intangibles is 77.5 percent in OECD countries. In 2022, Chile, Estonia, and Latvia led at 100 percent. Chile’s full expensing provision expired at the end of 2022. Of the countries with deductions for intangible assets, Canada has the worst tax treatment of investments in intangibles, at 49 percent, followed by Australia (54.8 percent), New Zealand (54.8 percent), and the United States (63.3 percent). Costa Rica does not provide allowances for intangible assets.
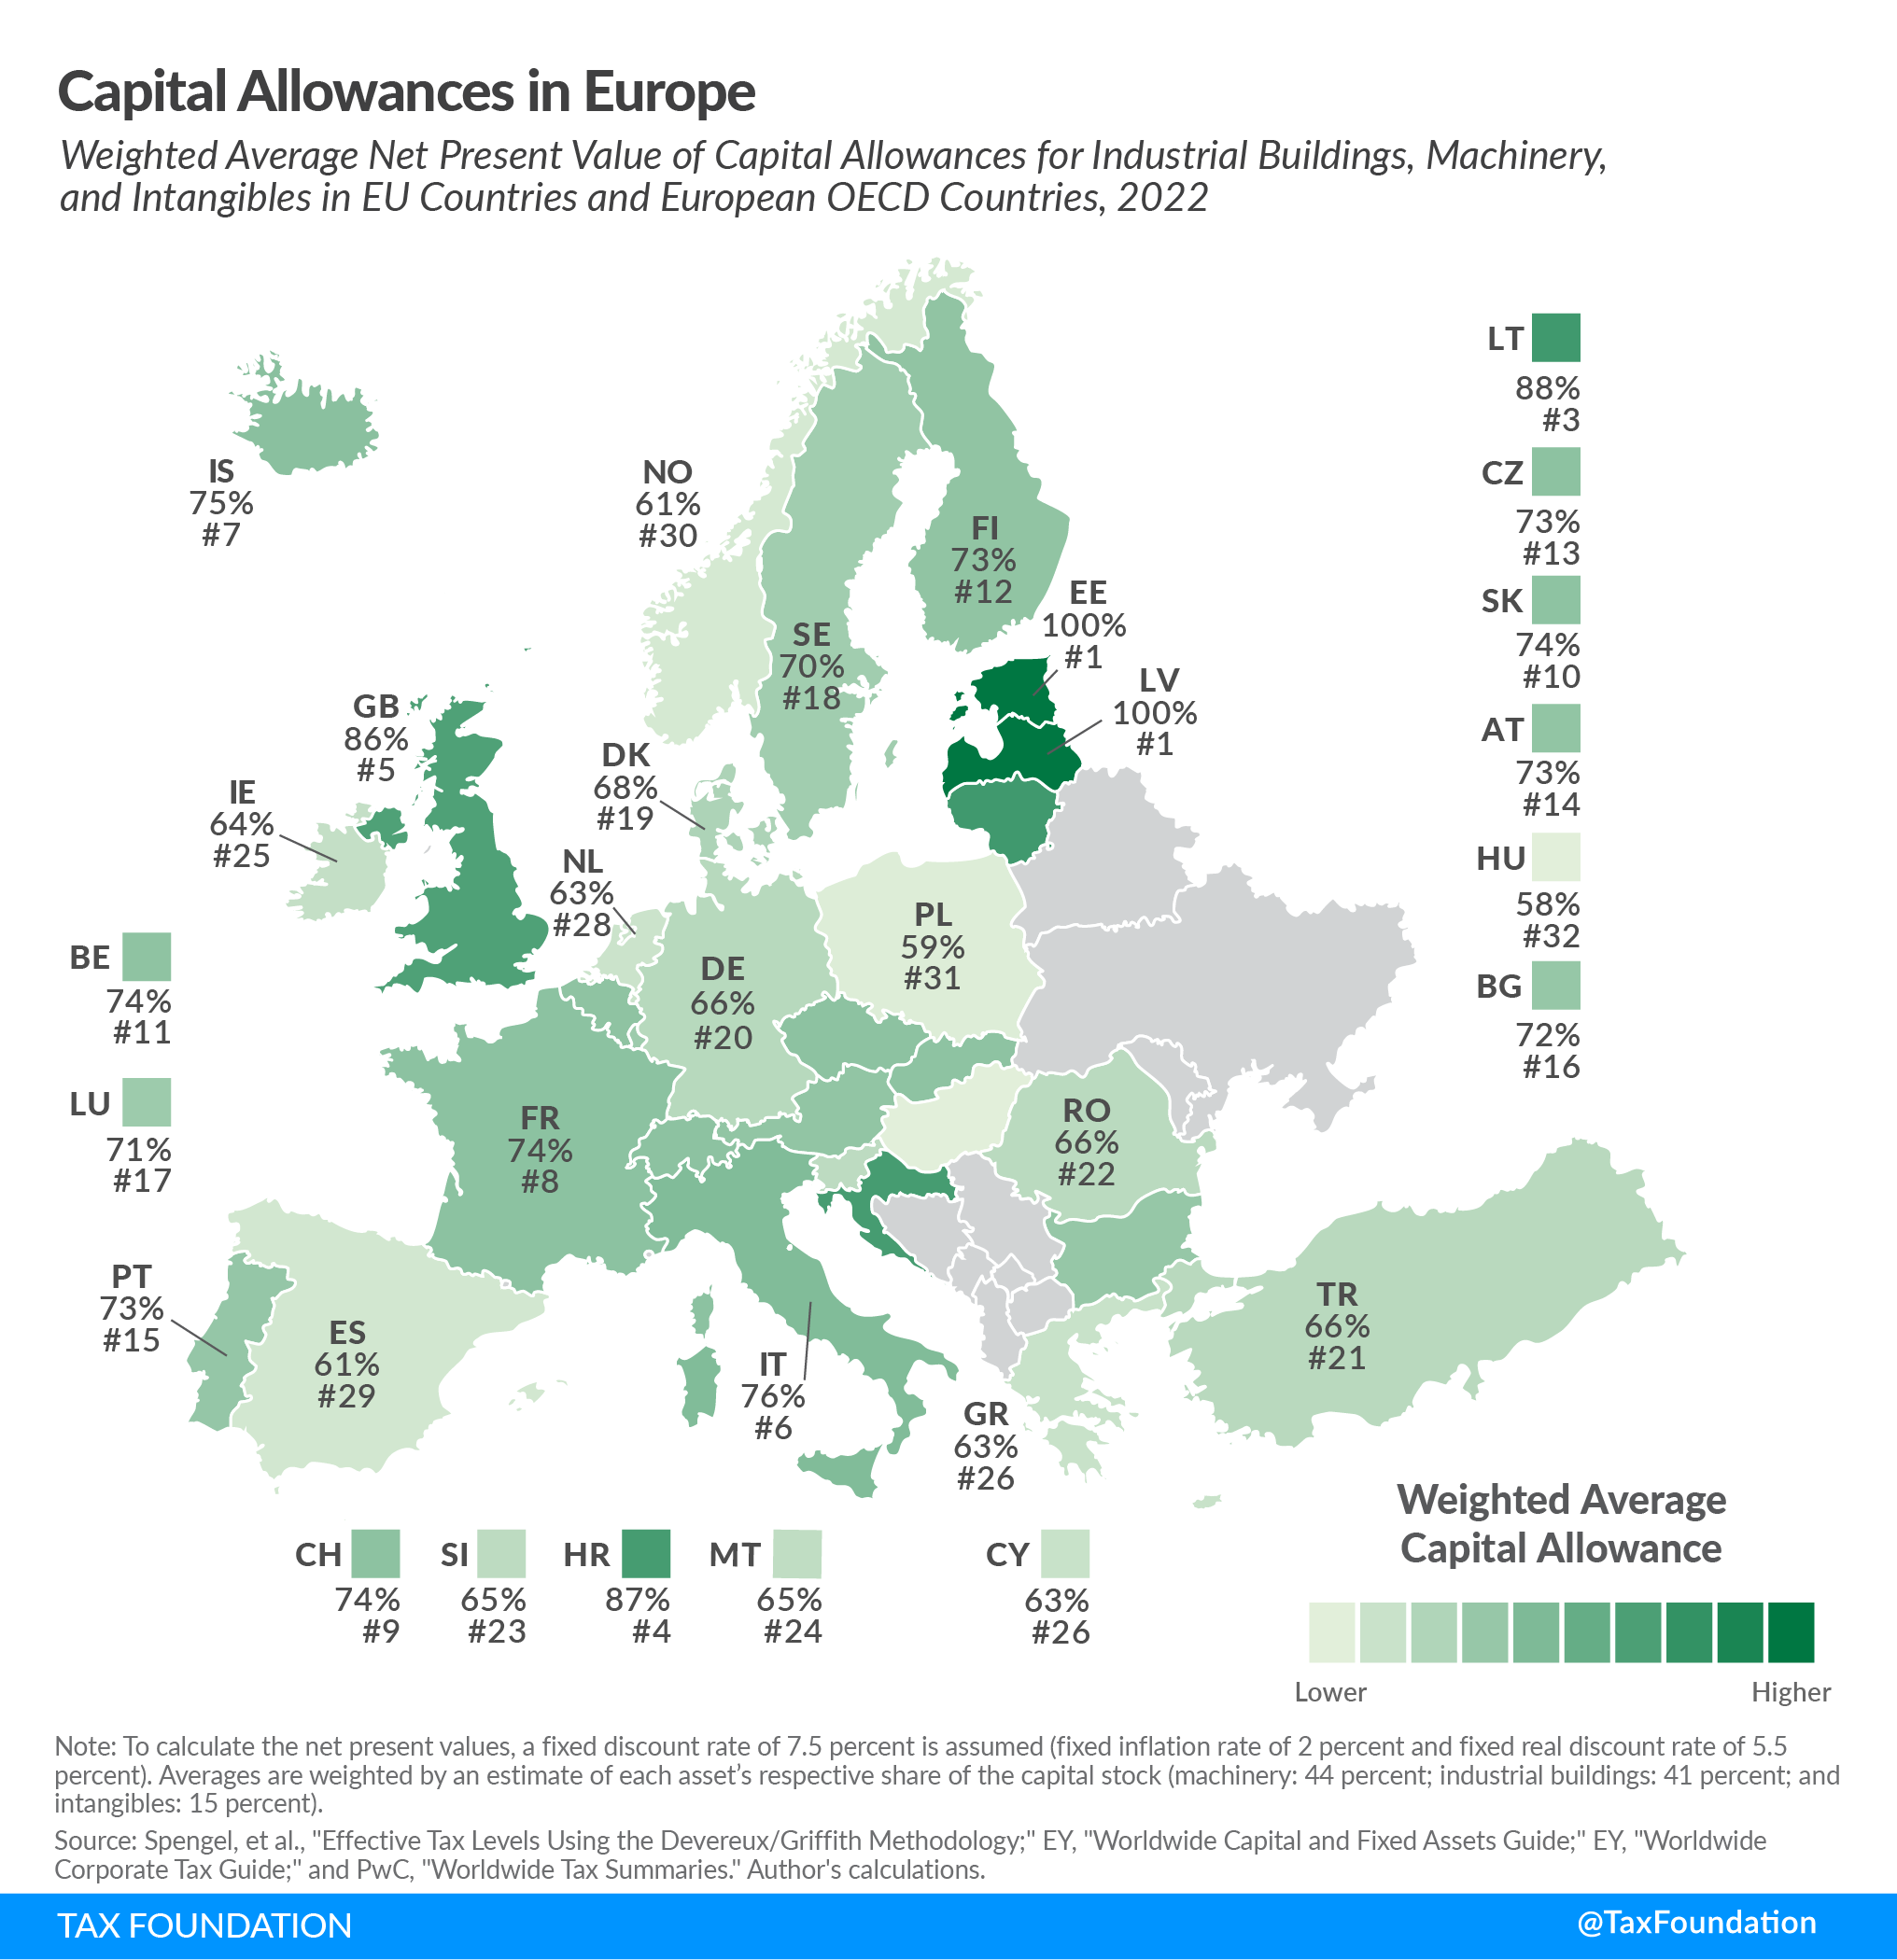
The following map shows that the extent to which businesses can deduct their capital investment costs varies greatly across Europe.
Temporary Measures of Accelerated Depreciation
To spur capital investment during economic downturns, policymakers often temporarily increase capital allowances. Several OECD countries have done so in response to the pandemic-induced economic crisis and post-pandemic slow economic growth.
- Australia implemented two temporary depreciation measures in the first half of 2020 that apply to all businesses with revenues below AUD 500 million (USD 336 million), namely an instant asset write-off (full expensing) for depreciating assets that cost less than AUD 150,000 (up from AUD 30,000) and an accelerated depreciation deduction for all depreciable assets that are not eligible for the instant write-off. At the end of 2020, Australia implemented temporary full expensing for most assets (excluding buildings) for businesses with revenues below AUD 5 billion (USD 3 billion). These temporary measures will expire on 30 June 2023.[22]
- Austria accelerated depreciation for buildings in the first two years and allows businesses to depreciate machinery at a higher rate using the declining-balance method. No end date for these accelerated depreciation methods has been set so far. Additionally, an instant asset write-off (full expensing) is available for depreciating assets that cost less than EUR 1,000 (USD 1,072).
- Chile allowed full expensing of fixed assets—such as buildings and machinery—and 100 percent amortization of intangibles until the end of 2022, making it the third OECD country after Estonia and Latvia that effectively provides full expensing for industrial buildings, machinery, and intangibles.
- Denmark made a “super deduction” available on costs concerning research and development. As a result of COVID-19, the deduction rate is increased in 2021, meaning that costs connected to research and development can be deducted at a rate of 130 percent in 2021, 105 percent in 2022, 108 percent in 2023-2025, and 110 percent from 2026 onward. Furthermore, it is expected that the 130 percent rate will also come to apply for 2023 and beyond (a proposal on this matter has been published). The “super-deductionA super-deduction is a tax deduction that permits businesses to deduct more than 100 percent of their eligible expenses from their taxable income. As such, the super-deduction is effectively a subsidy for certain costs. This policy sometimes applies to capital costs or research and development (R&D) spending.” is conditioned on the costs being connected to the taxpayer’s business. The deduction can be made either at once in the income year in which the costs are incurred, or over the course of five years, including the income year in which the costs are incurred.[23]
- Finland doubled its declining-balance depreciation rate for machinery from 25 percent to 50 percent for the years 2020 to 2023. Recently, a proposal on this matter has been published to extend the increased depreciation rules to 2025.[24]
- Germany accelerated depreciation schedules for machinery for the years 2020, 2021, and 2022. For 2023, this provision will expire unless renewed again in June 2023.
- New Zealand permanently reintroduced depreciation for commercial and industrial buildings with an estimated useful life of 50 years or more and temporarily increased the threshold for low-value assets that qualify for immediate write-off.
- Norway allows for an immediate deduction against the special tax base of new 2022 investments in fixed assets used in extractive activities subject to a special oil tax.
- The United Kingdom permanently reintroduced depreciation for industrial buildings at 2 percent in 2019 and expanded it to 3 percent in 2020. In addition, as part of the 2021 budget, the UK significantly increased capital allowances: between April 1, 2021, and March 31, 2023, businesses can deduct 130 percent of the investment costs in plant and equipment and 50 percent for other investments, including integral features to buildings. According to this year’s budget proposal, the super-deduction, set to expire on March 31, 2023, will be replaced by full expensing. If approved, this temporary measure will be in place up until April 1, 2026.[25]
While the temporary nature of most of these expensing and accelerated depreciation provisions reduces their tax revenue impact in the long run, it also limits their long-run economic benefits. Temporary provisions may encourage businesses to shift future investments forward to take advantage of the larger deductions but would not raise the level of investment permanently. Thus, permanent full expensing across all asset types—rather than targeted temporary measures—would yield the highest economic benefits.[26]
Capital Allowances in Selected OECD Countries
Capital cost recovery varies significantly across OECD countries, as shown in Table 1 above. The following examples highlight some of the differences and recent developments.
Estonia and Latvia: Cash-Flow Tax
Estonia and Latvia have both replaced their traditional corporate income tax systems with a cash-flow tax model, which allows for a capital cost recovery rate of 100 percent. Rather than requiring corporations to calculate their taxable income using complex rules and depreciation schedules on an annual basis, the Estonian and Latvian corporate income tax of 20 percent is levied only when a business distributes profits to shareholders.
This not only simplifies the calculation of taxable profit, but it also allows for treatment of capital investment that is equivalent to full expensing. Since distributed profits are the tax base, there is no need for depreciation schedules. Instead, capital costs reduce profits in the year of investment. This treatment of capital investment encourages businesses in Estonia and Latvia to use their profits to reinvest in their firms rather than distribute them to shareholders, leading to new capital formation and increased economic growth.
Canada and the United States: Temporary Expensing for Equipment and Machinery
Through 2022, the United States tax code allowed businesses to recover 67.7 percent of capital investment costs on average. This is slightly below the OECD average of 70.7 percent.
The U.S. capital allowance for intangibles is 63.3 percent, lower than the OECD average of 77.53 percent. Cost recovery of nonresidential structures is also low in the U.S., at an allowance of only 35 percent over their rather long 39-year asset lives, while the OECD average is 50.7 percent.
For machinery, the U.S. had a 100 percent capital cost recovery rate through 2022 due to temporary full expensing provided by the Tax Cut and Jobs Act (TCJA) of 2017. The OECD had an average of 87.2 percent for capital allowances for machinery.
Notably, the OECD highlighted the U.S. provision in its 2018 Economic Survey of the United States, pointing out that the policy “will likely give a substantial boost to investment activity.”[27]And it did. A 2022 study found that TCJA increased U.S. companies’ capital expenditures by approximately 0.2 percent to 0.4 percent of total assets when the mean capital expenditure of U.S. firms stands at 0.9 percent.[28]
As a response to full expensing for machinery in the U.S., Canada adopted temporary full expensing for equipment and machinery used in the manufacturing and processing of goods, and for clean energy investments.[29] These assets may be fully written off in the year the equipment or machinery is put into use, instead of being depreciated over several years.
Canada also adopted accelerated depreciation schedules for non-residential buildings.[30] Businesses that invest in buildings used in manufacturing and processing will be able to write off 15 percent of the cost in the first year (up from 5 percent), and first-year write-offs for investments in other nonresidential buildings have been increased from 3 percent to 9 percent.
The TCJA provided full expensing only through 2022, phasing it out from 2023 to 2026; Canada’s enhanced deductions will be in place through 2023, with a gradual phaseout period between 2024 and 2027. Although these reforms will temporarily boost investment activity, long-term effects would be significantly higher if the changes were made permanent.[31]
United Kingdom Super-Deduction
From April 2021 through the end of March 2023, UK businesses can deduct 130 percent of the costs of plant and equipment (labeled “machinery” in this report). This is a policy meant to assist business investment in the transition from the current 19 percent corporate tax rate to the proposed 25 percent rate which will be in place in April 2023. That’s a 130 percent increase, matching the super-deduction.
With the new budget proposal of full expensing that will substitute the super-deduction, the UK allowance for plant and equipment will shift from a 130 percent deduction to a 100 percent deduction. Such a level would place the UK in 16th place in Table 1 from its current place of 5th while tying for first place for machinery. Since full-expensing is set to expire in three years, in 2026, the UK would return to having an 18 percent declining balance allowance for plant and equipment. This would be a shift from a 100 percent deduction to a 75.8 percent deduction (in net present value terms), placing the UK in 30th place overall in Table 1.
The temporary policy results in a whiplash effect for capital allowances, effective tax rates, and overall business investment incentives.[32]
Capital Cost Recovery in the OECD since 2000
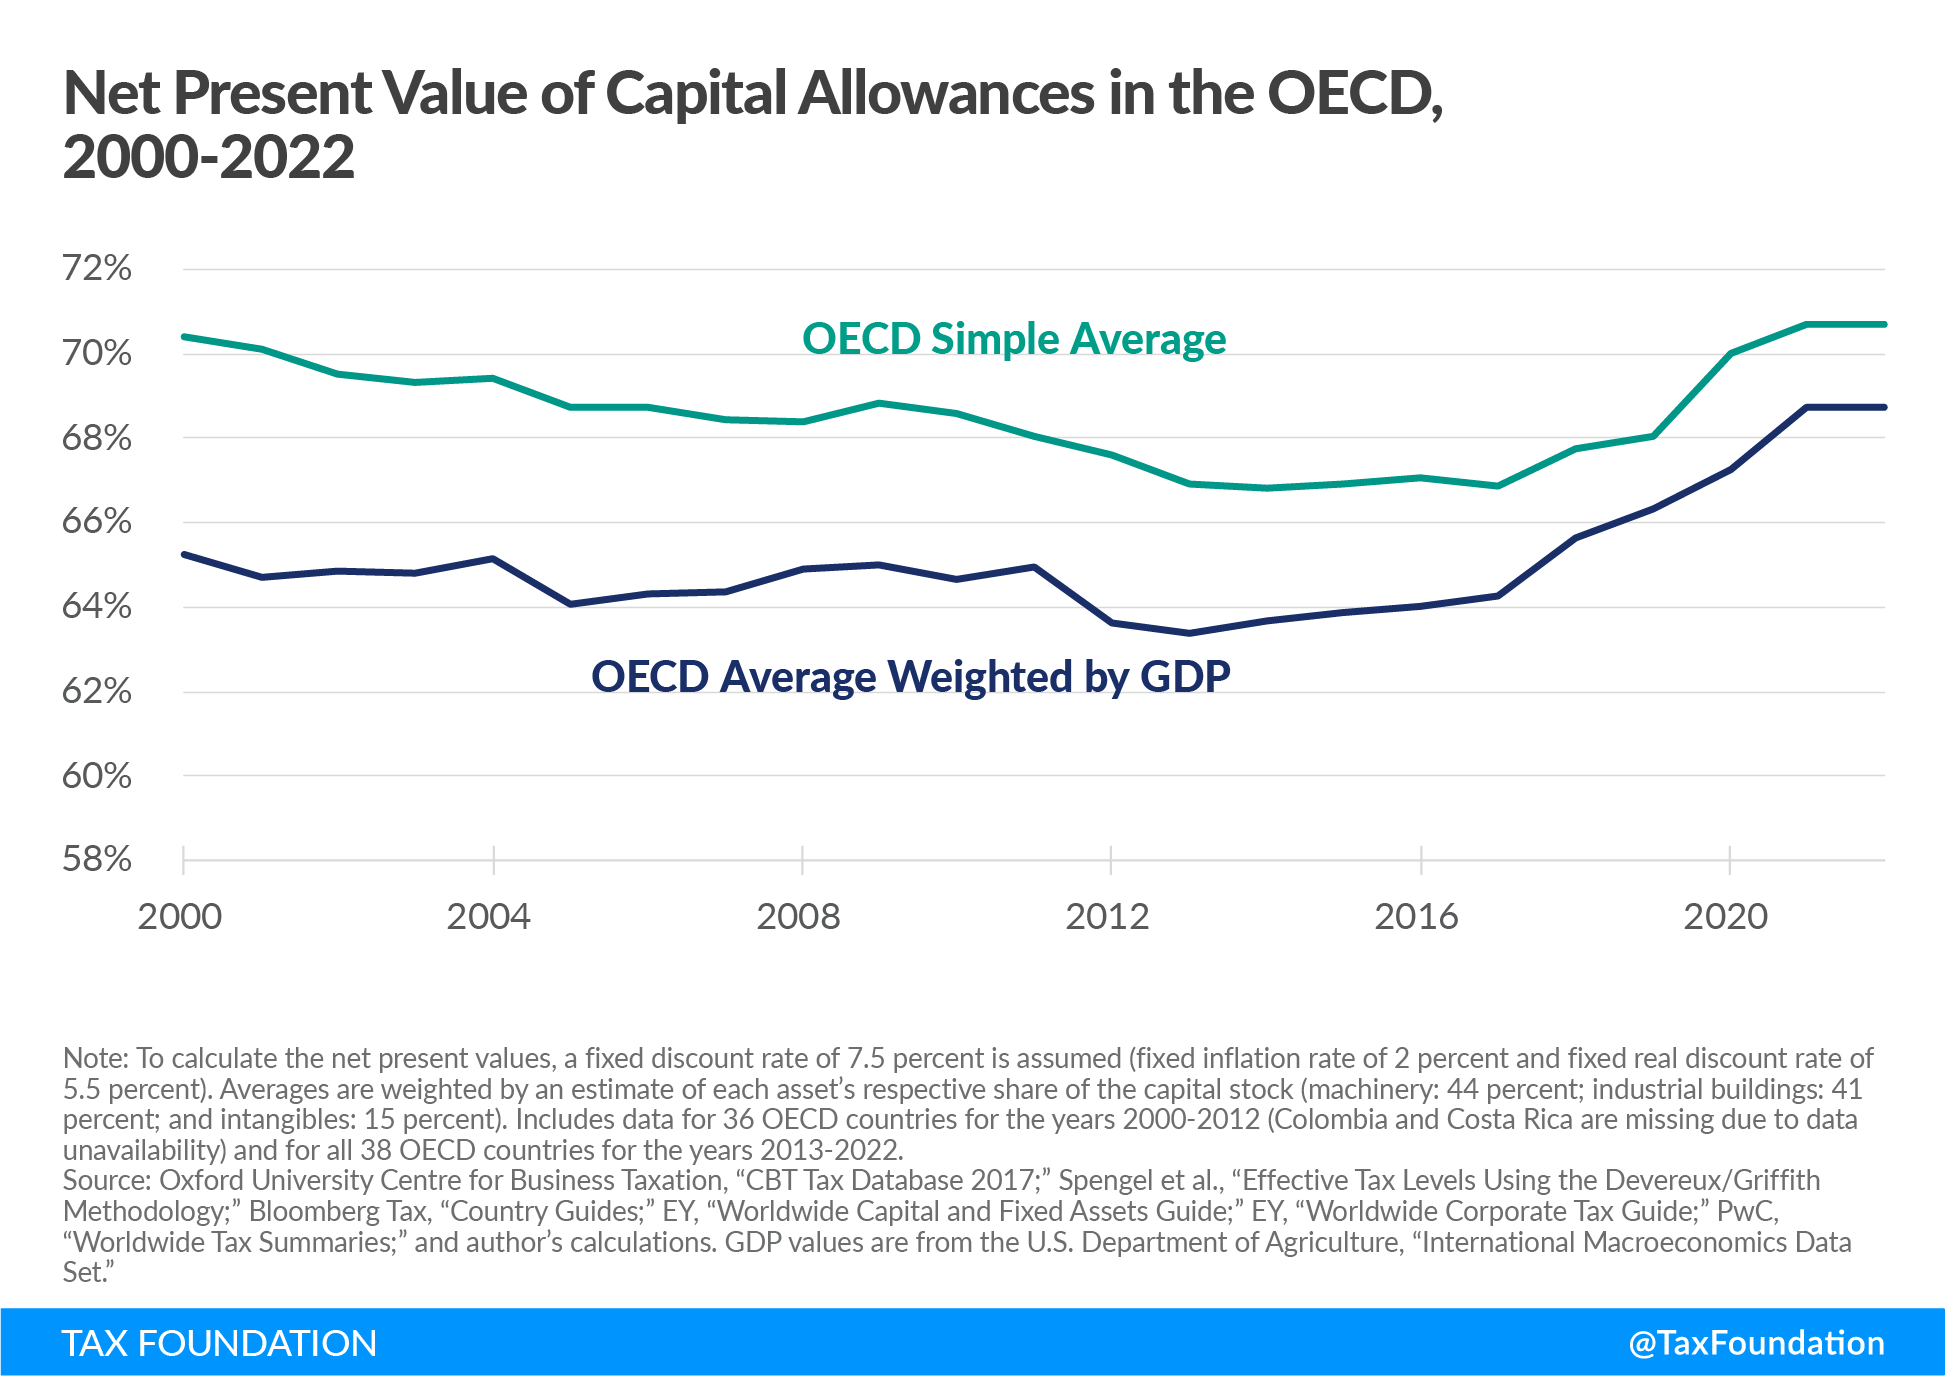
The simple average of OECD countries’ capital cost recovery rates decreased between 2000 and 2017, followed by a slight increase in 2018 and 2019,[33] and then a significant jump in 2020 and 2021 as a response to the COVID-19 pandemic. While OECD countries allowed their businesses to deduct on average approximately 70.4 percent of their capital investments in 2000, this number decreased to 66.8 percent in 2014 and now stands at 70.7 percent.
Weighted by GDP, the average OECD capital cost recovery rate declined slightly between 2000 and 2013, ranging from 65.2 percent in 2000 to 63.4 percent in 2013. After 2017, the trend started rising quickly. Full expensing for machinery in Canada and the United States, the UK’s reintroduction of capital allowances for buildings (and now the super-deduction), and newly introduced accelerated depreciation across asset types in several OECD countries due to the COVID-19 pandemic all contributed to raising the weighted average in the last five years; in 2022, it stood at 68.7 percent.
As Figure 3 shows, the OECD average capital cost recovery rate weighted by each country’s GDP is consistently lower than the simple OECD average. This is because smaller economies tend to have better tax treatment of capital investment. This is also reflected in our ranking (see Table 1): Chile, Estonia, Latvia, Lithuania, and Iceland—all relatively small economies—were the countries with the best tax treatment of capital investments in 2022.
Corporate Income Tax Rates in the OECD
More attention is generally paid to the corporate income tax rate, rather than the income tax base. However, the corporate income tax base and the corporate income tax rate are both important in determining businesses’ effective tax levels. Like low capital allowances, a high corporate income tax rate reduces corporations’ after-tax profits, increases the cost of capital, and slows the growth of the capital stock. This can lead to lower productivity, lower wages, and slower economic growth.[34]
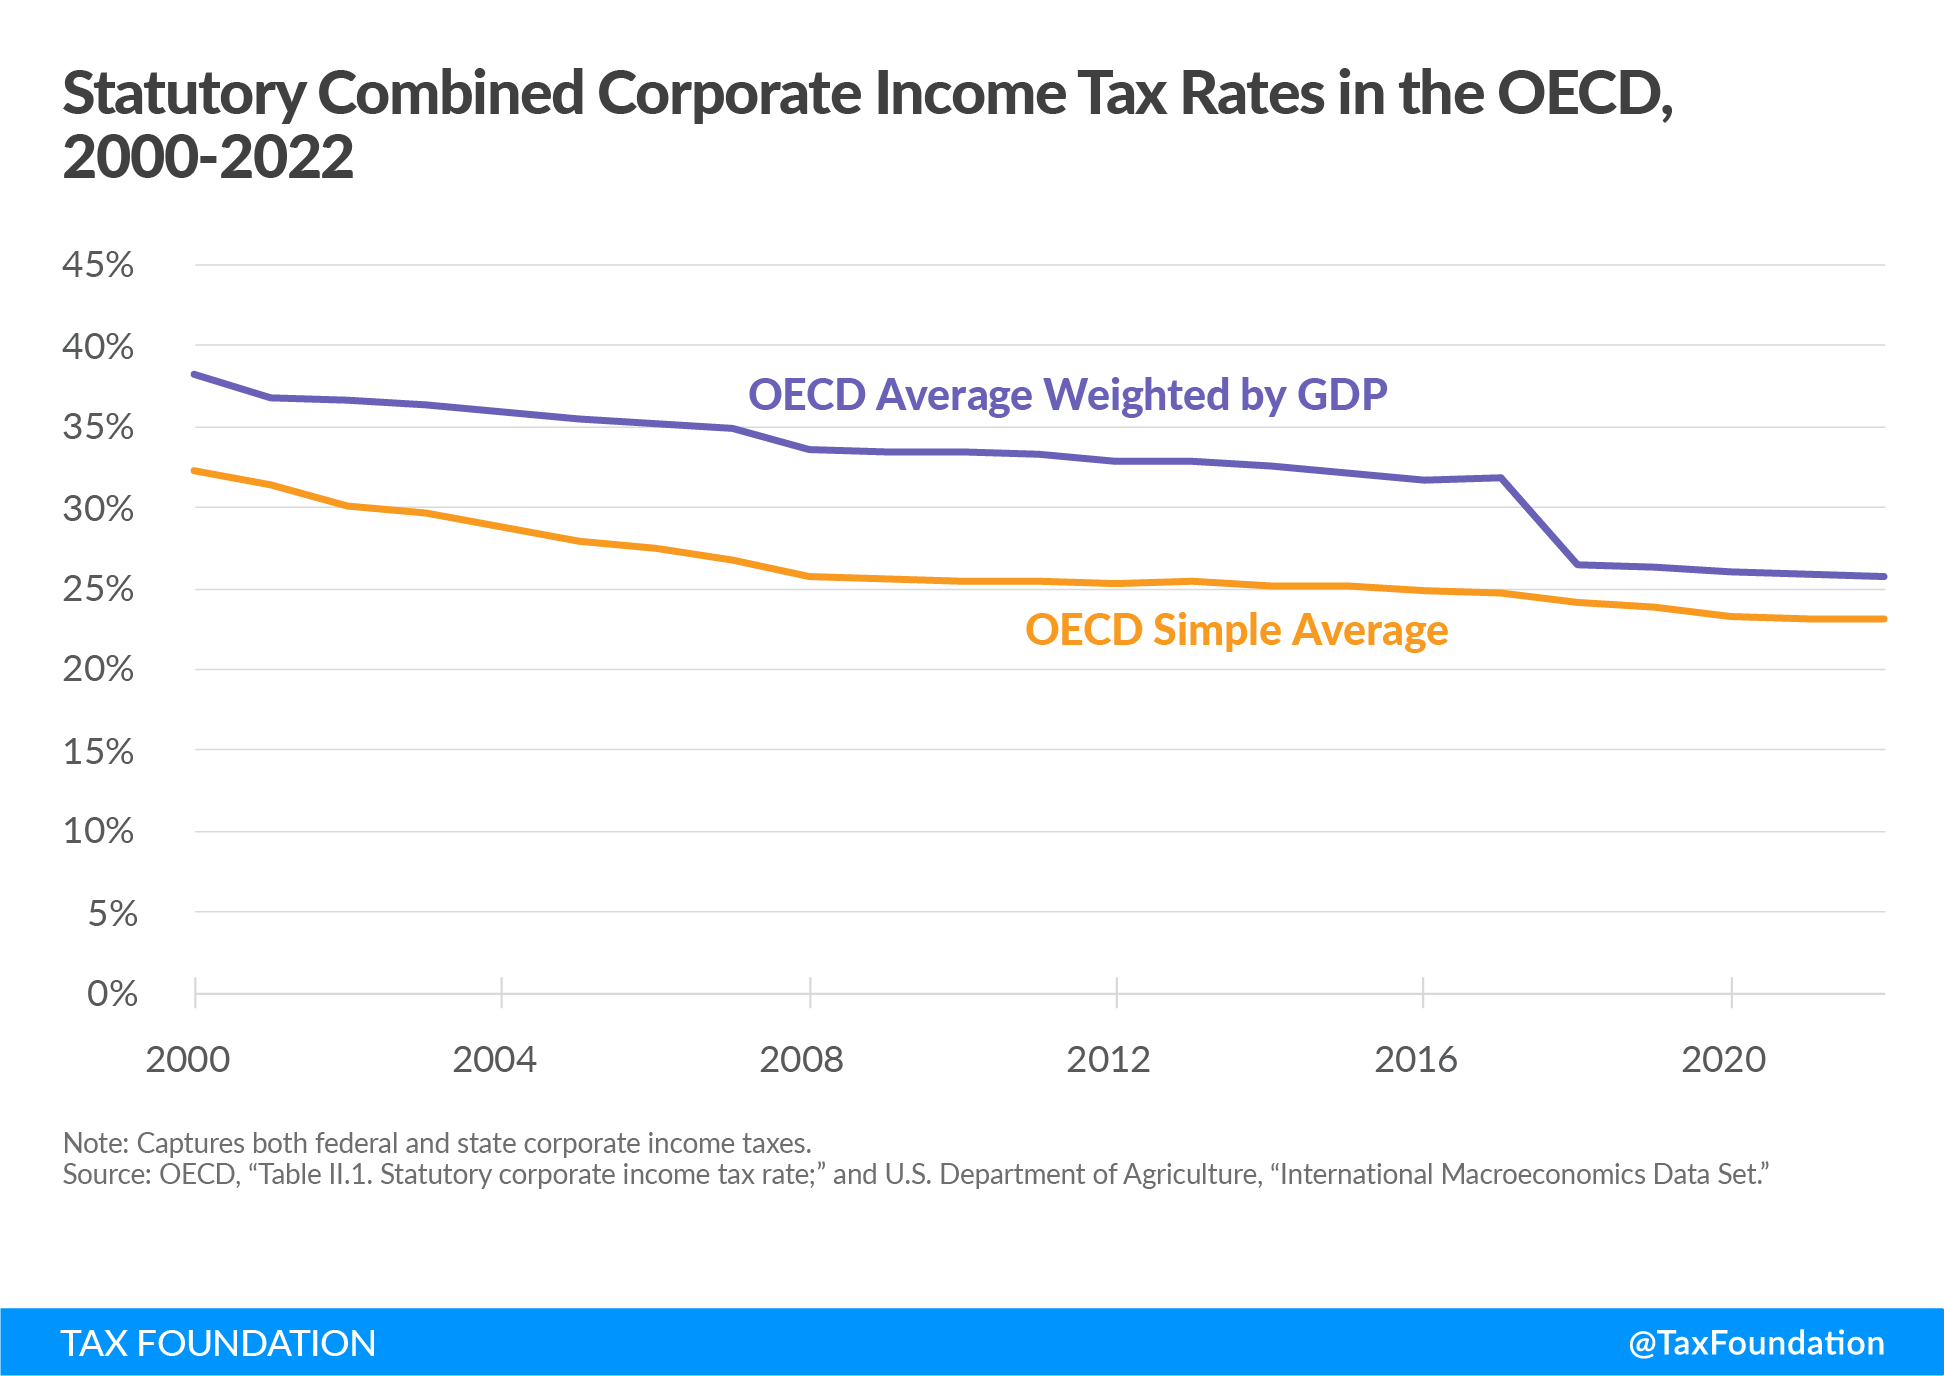
In the past 22 years, countries throughout the OECD have repeatedly reduced their statutory corporate income tax rates, pushing the average rate in OECD countries to approximately 23.1 percent in 2022.[35] The OECD average of corporate income tax rates weighted by each country’s GDP has also decreased since 2000, with a significant decline between 2017 and 2018 due to the cut in U.S. corporate income tax from about 32 percent to 26 percent.
Similar to capital allowances, the OECD average of corporate income tax rates weighted by each country’s GDP is consistently higher than the simple OECD average. This implies that some smaller countries tend to not only have higher capital allowances but also lower corporate income tax rates, making them more competitive from a tax perspective than some larger economies.
Conclusion
Although it has been important to reduce the distortionary effects of corporate income taxes by lowering statutory rates around the world, doing so without also considering capital allowances misses an important point of sound tax policy. Low capital allowances reduce incentives to invest, leading to lower wages and slower economic growth.
Besides pursuing policies of full expensing for capital investments, it is also important to make capital allowance provisions permanent. Permanency implies certainty, which is an essential factor for long-term investment decisions. For instance, the temporary Canadian and U.S. expensing and accelerated depreciation provisions are likely to spur economic growth in the short term. Their long-term effects, however, would be much higher if the changes were made permanent.
Inflation also creates a challenge for business investment that is exacerbated by long depreciation schedules.
To recover from the pandemic and put the global economy on a trajectory for growth, policymakers need to aim for more generous and permanent capital allowances. This will spur real investment and can also contribute to more environmentally friendly production across the globe.
Taxes make more sense with us in your inbox.
Subscribe to our newsletter for tax insights that cut through the noise—and make sense of it.
Sign UpAppendix
| Year | Remaining Value of Fixed Asset | Nominal Write-Off | Present Value Write-Off (Inflation Rate of 2%) | Present Value Write-Off (Inflation Rate of 9.5%) |
|---|---|---|---|---|
| 0 | $100.00 | $12.50 | $ 12.50 | $ 12.50 |
| 1 | $87.50 | $12.50 | $ 11.63 | $ 10.87 |
| 2 | $75.00 | $12.50 | $ 10.82 | $9.45 |
| 3 | $62.50 | $12.50 | $ 10.06 | $8.22 |
| 4 | $50.00 | $12.50 | $ 9.36 | $7.15 |
| 5 | $37.50 | $12.50 | $ 8.71 | $6.21 |
| 6 | $25.00 | $12.50 | $ 8.10 | $5.40 |
| 7 | $12.50 | $12.50 | $ 7.53 | $4.70 |
| Total Value: | $100.00 | $ 78.71 | $ 64.51 | |
| Total Allowance: | 100% | 78.71% | 64.51% | |
|
Note: Eight-year straight-line method at 12.5 percent. Real discount rate of 5.5 percent, inflation of 2 percent and 9.5 percent. Source: Author’s calculations. |
||||
Appendix Table 1 illustrates the calculation of a capital allowance using the straight-line method. Suppose a business made a capital investment of $100 and assume a real discount rate plus inflation that equals 7.5 percent.
In this example, the government allows investment in machinery to be deducted on a straight-line method of 12.5 percent for eight years. This means the business can deduct 12.5 percent of the initial cost of an investment each year for eight years.
Every year, the business can deduct 12.5 percent ($12.50) of the initial investment from taxable income. In the first year, the nominal value equals the present value of the write-off. However, over time, the present value of each year’s write-off declines due to the time value of money.
Although the nominal value of the entire write-off is $100, the present value is only $78.71. As a result, the company can only recover 78.71 percent of the present value of the cost of the machine by the end of the period.
Now, suppose an inflation rate of 9.5 percent. This would translate into a real discount rate plus inflation of 15 percent. With a higher inflation rate, although the nominal value of the entire write-off is $100, the present value is now only $64.51. As a result, the company can only recover 64.51 percent of the present value of the cost of the machine by the end of the period.
| Year | Remaining Value of Fixed Asset | Nominal Write-Off | Present Value Write-Off (Inflation Rate of 2%) | Present Value Write-Off (Inflation Rate of 9.5%) |
|---|---|---|---|---|
| 0 | $100.00 | $20.00 | $20.00 | $20.00 |
| 1 | $80.00 | $16.00 | $14.88 | $13.91 |
| 2 | $64.00 | $12.80 | $11.08 | $9.68 |
| 3 | $51.20 | $10.24 | $8.24 | $6.73 |
| 4 | $40.96 | $8.19 | $6.13 | $4.68 |
| 5 | $32.77 | $6.55 | $4.56 | $3.26 |
| 6 | $26.21 | $5.24 | $3.40 | $2.27 |
| 7 | $20.97 | $20.97 | $12.64 | $7.88 |
| Total Value: | $100.00 | $80.94 | $68.42 | |
| Total Allowance: | 100% | 80.94% | 68.42% | |
|
Note: Seven-year declining-balance method at 20 percent plus final year. Real discount rate of 5.5 percent, inflation of 2 percent and 9.5 percent. Source: Author’s calculations. |
||||
Appendix Table 2 illustrates the calculation of a capital allowance using the declining-balance method. Suppose a business made a capital investment of $100 and assume a real discount rate plus inflation that equals 7.5 percent.
Also, suppose the government allows investment in machinery to be deducted on a declining balance method of 20 percent for eight years. This means the business can deduct 20 percent of the remaining cost of an investment each year and the residual amount in the eighth year.
In the initial year, the business can deduct 20 percent ($20) of the initial investment from taxable income. That $20 is subtracted from the initial value of the machine. The next year, the machine has a remaining value of only $80 (the initial $100 minus the 20 percent deduction in the initial year) and, once again, 20 percent, or $16, is deducted from taxable income and subtracted from the value of the machine. In the next year, another 20 percent is deducted from the remaining $64 value of the machine, or $12.80. This method continues until the final year, when the remaining $20.97 of the investment is deducted.
Over time, the net present value of each year’s write-off declines due to the time value of money (real discount rate plus inflation). Although the nominal value of the entire write-off is $100, the present value is only $80.94. As a result, the company can only recover 80.94 percent of the present value of the cost of the machine by the end of the period.
Now, suppose an inflation rate of 9.5 percent. This would translate into a real discount rate plus inflation of 15 percent. With a higher inflation rate, although the nominal value of the entire write-off is $100, the present value is now only $68.42. As a result, the company can only recover 68.42 percent of the present value of the cost of the machine by the end of the period.
Countries with Unique Depreciation Schedules
While most OECD countries follow either the straight-line or declining-balance depreciation methods (or a combination of both) to determine annual capital allowances, there are some notable exceptions. The Czech Republic and Slovakia have unique depreciation schedules, and Mexico and Israel allow businesses to adjust their capital allowances for inflation.
Czech Republic and Slovakia: Specific Accelerated Depreciation Method
Besides the straight-line method, businesses may elect to depreciate buildings (only in the Czech Republic[36]) and machinery (in both countries) using a specific accelerated method. Under this method, depreciation for the first year is calculated by dividing the cost of the asset by the number of years reflecting the useful life of an asset. For subsequent years, accelerated depreciation is calculated by multiplying the residual tax value of the asset by two and then dividing it by the remaining years of depreciation plus one year.[37]
Despite this comparably complex calculation of depreciation values, Slovakia ranks 11th (73.9 percent) and the Czech Republic 14th (73.3 percent) in our comparison of capital cost recovery in the OECD, making them above average as places for business investment.
Israel and Mexico: Inflation-Adjustment for Capital Allowances
Businesses in Israel and Mexico are allowed to adjust their capital allowances for inflation—a unique feature among OECD countries’ depreciation methods.[38] This allows businesses to recover a larger share of their investment costs in real terms than they otherwise would, making it a partial form of neutral cost recovery. Such inflation adjustments reduce the negative impact of long depreciation schedules on investment incentives and economic growth.
[1] IMF, “IMF Investment and Capital Stock Dataset, 2021,” May 2021, https://infrastructuregovern.imf.org/content/dam/PIMA/Knowledge-Hub/dataset/IMFInvestmentandCapitalStockDataset2021.xlsx.
[2] Stephen J. Entin, “The Tax Treatment of Capital Assets and Its Effect on Growth: Expensing, Depreciation, and the Concept of Cost Recovery in the Tax System,” Tax Foundation, Apr. 24, 2013, https://www.taxfoundation.org/tax-treatment-capital-assets-and-its-effect-growth-expensing-depreciation-and-concept-cost-recovery/.
[3] Stephen J. Entin, “The Neutral Cost Recovery System: A Pro-Growth Solution for Capital Cost Recovery,” Tax Foundation, Oct. 29, 2013, https://www.taxfoundation.org/article/neutral-cost-recovery-system-pro-growth-solution-capital-cost-recovery.
[4] OECD, “Table II.1. Statutory corporate income tax rate,” updated May 2022, https://stats.oecd.org/Index.aspx?DataSetCode=TABLE_II1.
[5] OECD, “Corporate Tax Statistics, Fourth Edition” 2022, https://www.oecd.org/tax/tax-policy/corporate-tax-statistics-fourth-edition.pdf.
[6] Stephen J. Entin, “The Tax Treatment of Capital Assets and Its Effect on Growth: Expensing, Depreciation, and the Concept of Cost Recovery in the Tax System.”
[7] This can be thought of as the opportunity cost of tying up the money in a particular investment. See Stephen J. Entin, “The Neutral Cost Recovery System: A Pro-Growth Solution for Capital Cost Recovery.”
[8] Stephen J. Entin, “The Tax Treatment of Capital Assets and Its Effect on Growth: Expensing, Depreciation, and the Concept of Cost Recovery in the Tax System.”
[9] Another—although slightly more complicated—way to achieve full cost recovery is a neutral cost recovery system. Under that system, write-offs are spread over time, but the deferred amounts are increased each year at a market interest rate to preserve a net present value equal to expensing. See Stephen J. Entin, “The Neutral Cost Recovery System: A Pro-Growth Solution for Capital Cost Recovery.”
[10] Stephen J. Entin, “The Tax Treatment of Capital Assets and Its Effect on Growth: Expensing, Depreciation, and the Concept of Cost Recovery in the Tax System.”
[11] Kevin A. Hassett and R. Glenn Hubbard, “Tax Policy and Business Investment,” Handbook of Public Economics 3 (2002), https://www.sciencedirect.com/science/article/pii/S1573442002800246.
[12] Sebastian Beer, Mark Griffiths, and Alexander Klemm, “Tax Distortions from Inflation: What are they and How to Deal with them?,” IMF Working Papers 23:18 (January 2023), https://www.imf.org/en/Publications/WP/Issues/2023/01/27/Tax-Distortions-from-Inflation-What-are-They-How-to-Deal-with-Them-528666.
[13] Stephen J. Entin, “The Tax Treatment of Capital Assets and Its Effect on Growth: Expensing, Depreciation, and the Concept of Cost Recovery in the Tax System.”
[14] Eric Zwick and James Mahon, “Tax Policy and Heterogeneous Investment Behavior,” American Economic Review 107:1 (January 2017): 217–248, https://www.aeaweb.org/articles?id=10.1257/aer.20140855.
[15] Giorgia Maffini, Jing Xing, and Michael P. Devereux, “The Impact of Investment Incentives: Evidence from UK Corporation Tax Returns,” American Economic Journal: Economic Policy 11:3 (August 2019): 361-89, https://www.aeaweb.org/articles?id=10.1257/pol.20170254.
[16] Yongzheng Liu and Jie Mao, “How Do Tax Incentives Affect Investment and Productivity? Firm-Level Evidence from China,” American Economic Journal: Economic Policy 11:3 (August 2019): 261-91, https://www.aeaweb.org/articles?id=10.1257/pol.20170478.
[17] OECD, “Consumer Price Indices (CPIs),” https://stats.oecd.org/Index.aspx?DataSetCode=PRICES_CPI.
[18] Kevin A. Hassett and Kathryn Newmark, “Taxation and Business Behavior: A Review of the Recent Literature,” in John W. Diamond and George R. Zodrow, eds., Fundamental Tax Reform: Issues, Choices, and Implications (Cambridge, MA: MIT Press, 2008), 205.
[19] Id., at 206.
[20] Kyle Pomerleau, “Trading Longer Asset Lives for Lower Corporate Tax Rates in the United Kingdom,” Tax Foundation, Jan. 29, 2014, https://www.taxfoundation.org/trading-longer-asset-lives-lower-corporate-tax-rates-united-kingdom/.
[21] Ben Gardiner, Ron Martin, Peter Sunley, and Peter Tyler, “Spatially Unbalanced Growth in the British Economy,” Journal of Economic Geography 13:6 (November 2013): 889-928.
[22] The data shown in this report reflects capital allowances granted to all businesses regardless of size. Due to the revenue threshold, Australia’s accelerated depreciation and full expensing policies are not reflected in the data.
[23] EY, “Worldwide Corporate Tax Guide 2022,” Aug. 1, 2022, https://www.ey.com/en_gl/tax-guides/worldwide-corporate-tax-guide.
[24] EY, “Worldwide Capital and Fixed Assets Guide 2022,” Jul. 27, 2022, https://www.ey.com/en_gl/tax-guides/worldwide-capital-and-fixed-assets-guide.
[25] Bloomberg Tax, “Hunt Says UK to Avoid RecessionA recession is a significant and sustained decline in the economy. Typically, a recession lasts longer than six months, but recovery from a recession can take a few years. and Cut Inflation This Year (1),” Mar. 15, 2023, https://news.bloombergtax.com/daily-tax-report-international/hunt-says-says-uk-to-avoid-recession-halve-inflation-this-year.
[26] For further analysis, see Kyle Pomerleau, “Economic and Budgetary Impact of Temporary Expensing,” Tax Foundation, Oct. 4, 2017, https://www.taxfoundation.org/economic-budgetary-impact-temporary-expensing/.
[27] OECD, “OECD Economic Surveys United States,” June 2018, https://read.oecd-ilibrary.org/economics/oecd-economic-surveys-united-states-2018_eco_surveys-usa-2018-en#page12.
[28] Steve Crawford and Garen Markarian, “The Effect of the Tax Cuts and Jobs Act of 2017 on Corporate Investment,” SSRN Electronic Journal (October 6, 2020), http://dx.doi.org/10.2139/ssrn.4239855.
[29] Department of Finance Canada, “Investing in Middle Class Jobs,” Fall Economic Statement 2018, https://budget.gc.ca/fes-eea/2018/docs/statemein 2015, nt-enonce/fes-eea-2018-eng.pdf.
[30] Id.
[31] Kyle Pomerleau, “Economic and Budgetary Impact of Temporary Expensing;” and William Gbohoui, “Do Temporary Business Tax Cuts Matter? A General Equilibrium Analysis,” IMF, Feb. 15, 2019, https://www.imf.org/en/Publications/WP/Issues/2019/02/15/Do-Temporary-Business-Tax-Cuts-Matter-A-General-Equilibrium-Analysis-46524.
[32] Daniel Bunn and Kyle Pomerleau, “Marginal Effective Tax Rates and the 2021 UK Budget,” Tax Foundation, Mar. 23, 2021, https://www.taxfoundation.org/2021-uk-budget-tax-proposals/.
[33] The increases in 2018 and 2019 are mainly due to the introduction of temporary full expensing for machinery in Canada and the United States, as well as the reintroduction of capital allowances for industrial buildings in the United Kingdom.
[34] William McBride, “What Is the Evidence on Taxes and Growth?” Tax Foundation, Dec. 18, 2012, https://www.taxfoundation.org/article/what-evidence-taxes-and-growth.
[35] OECD, “Table II.1. Statutory corporate income tax rate.”
[36] In 2015, Slovakia switched from its unique accelerated depreciation method for buildings to the straight-line method. It kept its accelerated method for machinery.
[37] Example: In the first year in the case of an asset with a useful life of six years, depreciation is 16.7 percent (100/6). The following years, the residual value is multiplied by two and divided by the remaining years of depreciation plus one year; i.e., for the second year: (100-16.7%) x 2 / (6-1+1) = 27.77%.
[38] EY, “Worldwide Capital and Fixed Assets Guide”; and PKF, “International Worldwide Tax Guide 2022-23,” Jul. 31, 2022, https://www.pkf.com/publications/tax-guides/worldwide-tax-guide-2022-23/.
Share this article