Key Findings
- The Ohio Commercial Activity TaxA tax is a mandatory payment or charge collected by local, state, and national governments from individuals or businesses to cover the costs of general government services, goods, and activities., a 0.26 percent tax on business gross receipts above $1 million, is a throwback to an earlier era of taxation, bringing back a tax type that had been in steady retreat for nearly a century.
- Because profit margins vary widely across industries and even across individual businesses, and because intermediate transactions are taxed in a gross receipts taxGross receipts taxes are applied to a company’s gross sales, without deductions for a firm’s business expenses, like compensation, costs of goods sold, and overhead costs. Unlike a sales tax, a gross receipts tax is assessed on businesses and applies to transactions at every stage of the production process, leading to tax pyramiding. regime (resulting in tax pyramidingTax pyramiding occurs when the same final good or service is taxed multiple times along the production process. This yields vastly different effective tax rates depending on the length of the supply chain and disproportionately harms low-margin firms. Gross receipts taxes are a prime example of tax pyramiding in action.), businesses can face wildly disparate effective tax rates under the CAT.
- The CAT met with a more favorable reception than it might have otherwise because it replaced the state’s corporate franchise tax (a corporate income taxA corporate income tax (CIT) is levied by federal and state governments on business profits. Many companies are not subject to the CIT because they are taxed as pass-through businesses, with income reportable under the individual income tax. with a capital stock component) and tangible personal property taxA property tax is primarily levied on immovable property like land and buildings, as well as on tangible personal property that is movable, like vehicles and equipment. Property taxes are the single largest source of state and local revenue in the U.S. and help fund schools, roads, police, and other services., and was paired with individual income taxAn individual income tax (or personal income tax) is levied on the wages, salaries, investments, or other forms of income an individual or household earns. The U.S. imposes a progressive income tax where rates increase with income. The Federal Income Tax was established in 1913 with the ratification of the 16th Amendment. Though barely 100 years old, individual income taxes are the largest source rate reductions, resulting in a substantial tax cut overall.
- It is difficult to attribute any positive economic outcomes to the tax package that introduced the Ohio CAT even though it represented a significant reduction in overall tax burdens.
- The CAT employs broad nexus standards which have led to extensive litigation and leaves many important legal questions unanswered.
- Ohio is one of only five states with a statewide gross receipts tax, but faced with declining corporate income tax revenues, other states are beginning to look to the Ohio CAT as a model.
- Most other states considering a gross receipts tax on the Ohio model are contemplating it atop their existing business tax regimes, rather in lieu of them, which is likely to be far more economically destructive.
- The factors which led states to abandon gross receipts taxes have not changed; they remain an inefficient and inequitable form of taxation long since superseded by more modern revenue tools.
Introduction
With cat-like tread, Ohio’s Commercial Activity Tax (CAT) strode into view in 2005, unleashing a torrent of criticism, concerns, timid defenses, and regrettable puns. In some respects, that CAT marked a return to an older tax regime; in others, it reflected an innovation in state taxation; and in all respects, it represents an experiment which continues to the present day, simultaneously inspiring would-be imitators and informing cautionary tales.
As a gross receipts tax, the Ohio CAT represents a throwback to a far earlier era, bringing back a form of taxation once on the path to extinction. Such taxes were nearly done in by a consensus that levying a tax on the basis of gross revenues was inequitable, promoted otherwise inefficient economic decision-making, and impeded growth. The adoption of the CAT, therefore, was—and remains—a matter of significant controversy, as well as the subject of considerable interest for policymakers and tax economists.
The CAT, then, is not just an element of Ohio’s revenue structure; it has emerged as the focal point of an emerging national debate over the role, if any, of gross receipts taxes in a modern tax code. Over a decade after its introduction, perhaps the time has come to consider the Ohio CAT anew.
Origin of the Ohio CAT
Ohio’s Commercial Activity Tax is imposed at a rate of 2.6 mills (0.26 percent) on business gross receipts in excess of $1 million. Additionally, a tiered minimum tax is imposed on all businesses with taxable gross receipts of $150,000 or more, at amounts ranging from $150 for filers less than $1 million in receipts to $2,600 for filers with more than $4 million in receipts.[1] As a gross receipts tax, the CAT is levied on the entirety of a company’s Ohio business receipts, without deductions for compensation, costs of goods sold, or other expenses.[2]
| Annual Gross Receipts | Minimum Tax Liability | CAT Liability |
|---|---|---|
| $0 – $150,000 | n/a | n/a |
| $150,001 – $1,000,000 | $150 | n/a |
| $1,000,001 – $2,000,000 | $800 | 0.26% on receipts > $1 million |
| $2,000,001 – $4,000,000 | $2,100 | 0.26% on receipts > $1 million |
| $4,000,001+ | $2,600 | 0.26% on receipts > $1 million |
The tax casts a broad net, applying to any person or business which “owns or uses any capital in Ohio, is authorized to do business in Ohio, has bright line presence, or can otherwise be reached by Ohio for taxation under the U.S. Constitution.”[4] Because profit margins vary widely across industries and even across individual businesses, and because intermediate transactions are taxed under the CAT, businesses can face wildly disparate effective tax rates. Indeed, there is a broad consensus that gross receipts taxes are nonneutral and economically destructive, and such taxes had largely fallen out of favor in the modern era.
The adoption of a gross receipts tax in 2005, therefore, was in many respects anachronistic, given the steady retreat of gross receipts taxes over the course of the 20th century. Nevertheless, the tax structure it supplanted was no less archaic, which is perhaps one reason why a tax generally deplored by the business community has been met with a comparatively less hostile reception in Ohio. The state’s corporate franchise tax (CFT), a business privilege tax first imposed in 1902, was levied on the greater of net income or net worth.[5] The tangible personal property (TPP) tax, termed “the tax every businessman loves to hate” by then-Governor Bob Taft,[6] was levied on machinery, inventory, furniture, fixtures, and other business equipment.[7] In such an environment, even an arbitrary mode of taxation could be an attractive alternative.
The central revenue feature of Ohio House Bill 66 of 2005 (which was also the biennial budget), the Commercial Activity Tax was designed to phase in as corporation franchise and tangible personal property taxes phased out. The legislation enacted other tax changes as well. It established a schedule of rate reductions on the individual income tax culminating in 21 percent across-the-board rate reductions once fully phased in. The sales taxA sales tax is levied on retail sales of goods and services and, ideally, should apply to all final consumption with few exemptions. Many governments exempt goods like groceries; base broadening, such as including groceries, could keep rates lower. A sales tax should exempt business-to-business transactions which, when taxed, cause tax pyramiding. rate, which had been temporarily increased from 5.0 to 6.0 percent, was set permanently at 5.5 percent. The bill eliminated a 10 percent rollback on commercial and industrial property, more than doubled the cigarette tax, and repealed a supplemental estate taxAn estate tax is imposed on the net value of an individual’s taxable estate, after any exclusions or credits, at the time of death. The tax is paid by the estate itself before assets are distributed to heirs. (a so-called “sponge tax”) imposed at the amount which could be taken as a credit against the federal estate tax.[8]
| *Rate was 23 percent for inventory and 25 percent for manufacturing machinery, equipment, furniture, and fixtures.[9] | |||||||||||||||||||||||||||||||||||||||||||||||||||||||||||||||||||||||||||||||||||||||||||||||||||
| Year | CAT | TPP | CFT | PIT | |||||||||||||||||||||||||||||||||||||||||||||||||||||||||||||||||||||||||||||||||||||||||||||||
|---|---|---|---|---|---|---|---|---|---|---|---|---|---|---|---|---|---|---|---|---|---|---|---|---|---|---|---|---|---|---|---|---|---|---|---|---|---|---|---|---|---|---|---|---|---|---|---|---|---|---|---|---|---|---|---|---|---|---|---|---|---|---|---|---|---|---|---|---|---|---|---|---|---|---|---|---|---|---|---|---|---|---|---|---|---|---|---|---|---|---|---|---|---|---|---|---|---|---|---|
| 2005 | 0.06% | 23/25% assessment ratio* | 100% of liability | 4.2% cut from 2004 rates | |||||||||||||||||||||||||||||||||||||||||||||||||||||||||||||||||||||||||||||||||||||||||||||||
| 2006 | 0.104% | 18.75% assessment ratio | 80% of liability | 8.4% cut from 2004 rates | |||||||||||||||||||||||||||||||||||||||||||||||||||||||||||||||||||||||||||||||||||||||||||||||
| 2007 | 0.156% | 12.5% assessment ratio | 60% of liability | 12.6% cut from 2004 rates | |||||||||||||||||||||||||||||||||||||||||||||||||||||||||||||||||||||||||||||||||||||||||||||||
| 2008 | 0.028% | 6.25% assessment ratio | 40% of liability | 16.8% cut from 2004 rates | |||||||||||||||||||||||||||||||||||||||||||||||||||||||||||||||||||||||||||||||||||||||||||||||
| 2009 | 0.26% | — | 20% of liability | 21.0% cut from 2004 rates | |||||||||||||||||||||||||||||||||||||||||||||||||||||||||||||||||||||||||||||||||||||||||||||||
| 2010 | 0.26% | — | — | 21.0% cut from 2004 rates | |||||||||||||||||||||||||||||||||||||||||||||||||||||||||||||||||||||||||||||||||||||||||||||||
Ohio’s old corporate franchise tax, now fully repealed, consisted of an 0.4 percent capital stock tax imposed on a company’s net worth and a two-rate corporate net income tax, with the top marginal rate of 8.5 percent imposed on all income in excess of $50,000. Companies were required to calculate their liability under both the net worth and net income provisions and remit payment under whichever was greater.[10] In fiscal year 2005, the last full year before the tax began phasing out, the tax raised $1.1 billion.[11]
Most states levy corporate income taxes. However, capital stock taxes, which disincentivize the accumulation of capital, distort firm sizes, and are levied even (or in the case of Ohio’s tax, especially) when a firm experiences net losses, have largely fallen out of favor, and only 16 states still impose them as of 2017. Three of these states—Connecticut, New York, and Wyoming—impose taxes mirroring the old Ohio corporate franchise tax, under which businesses pay the greater of net worth or net income liability.[12] Beginning in 2006, Ohio CFT liability declined in increments of 20 percent a year, with firms responsible for 80 percent of their standard liability that year, 60 percent in 2007, and so on until 2010, when the tax was eliminated.
Ohio’s tangible personal property tax, levied by local taxing authorities alongside real property taxes, raised a combined $1.7 billion in local revenues in fiscal year 2005, much of which flowed to school districts ($1.2 billion), though counties ($319 million), cities and villages ($92 million), and townships ($67 million) also leaned on the tax as a source of revenue.[13] Tangible personal property taxes are “taxpayer active,” meaning that taxpayers bear the compliance burden of identifying, describing, and valuing each article of property, and remitting the tax on its depreciated value. Taxes on machinery and equipment create an incentive for mobile capital to flow to other states, which has increasingly led states to place tangible personal property taxes on the chopping block.[14]
Property taxes (both real and personal) are often subject to what is known as an assessment ratio, which specifies the percentage of the property’s value subject to the tax millage. For tangible personal property in Ohio prior to the four-year pro rata phasedown of the tax under HB 66, that rate was 25 percent for manufacturing machinery, equipment, furniture, and fixtures and 23 percent for inventory.[15]
The structure of the state’s nine-bracket individual income tax remained the same under HB 66, but the rates did not. Beginning in 2005, rates began what was to culminate in a 21 percent across-the-board reduction by 2011, with the top marginal rate falling from 7.5 percent to 5.925 percent. The legislature briefly postponed the fifth and final rate reduction, but ultimately implemented it and adopted bracket indexing beginning in 2010, later initiating a new schedule of rate reductions.[16] The top marginal rate currently stands at 4.997 percent, where it has been since 2015.
Pass-through businesses (S Corporations, partnerships, and sole proprietorships), so called because their income “passes through” to the individual income tax form, are subject to the CAT but were not liable under the old corporate franchise tax. Because many of these businesses are smaller than the typical C Corporation, they may be more likely to outsource certain business activities and thus experience above-average tax exposure under a gross receipts tax. The reduction in individual income tax rates under HB 66, however, does help these pass-through entities, as does the repeal of tangible personal property taxes for some businesses.
| Bracket Start Point | Year of Rate Change | |||||||||
|---|---|---|---|---|---|---|---|---|---|---|
| Initial | Final | 2004 | 2005 | 2006 | 2007 | 2008 | 2011 | 2013 | 2014 | 2015 |
| $0 | $0 | 0.743% | 0.712% | 0.681% | 0.649% | 0.618% | 0.587% | 0.54% | 0.528% | 0.495% |
| $5,000 | $5,250 | 1.486% | 1.424% | 1.361% | 1.299% | 1.236% | 1.174% | 1.074% | 1.057% | 0.990% |
| $10,000 | $10,500 | 2.972% | 2.847% | 2.722% | 2.598% | 2.473% | 2.348% | 2.148% | 2.113% | 1.980% |
| $15,000 | $15,800 | 3.715% | 3.559% | 3.403% | 3.247% | 3.091% | 2.935% | 2.686% | 2.642% | 2.476% |
| $20,000 | $21,100 | 4.457% | 4.270% | 4.083% | 3.895% | 3.708% | 3.521% | 3.222% | 3.169% | 2.969% |
| $40,000 | $42,100 | 5.201% | 4.983% | 4.764% | 4.546% | 4.327% | 4.109% | 3.760% | 3.698% | 3.465% |
| $80,000 | $84,200 | 5.943% | 5.693% | 5.444% | 5.194% | 4.945% | 4.695% | 4.296% | 4.226% | 3.960% |
| $100,000 | $105,300 | 6.900% | 6.610% | 6.320% | 6.031% | 5.741% | 5.451% | 4.988% | 4.906% | 4.597% |
| $200,000 | $210,600 | 7.500% | 7.185% | 6.870% | 6.555% | 6.240% | 5.925% | 5.421% | 5.333% | 4.997% |
This was the context in which a gross receipts tax could look, and perhaps actually be, attractive: as an alternative to high, nonneutral taxes on business equipment and corporate valuations, and as a means of reducing the state’s high individual income tax rates.[18] Although repealing the rollback for commercial and industrial property increased tax costs on real property (land and buildings) owned by businesses, and the sales tax rate was not permitted to fully sunset to its prior 5.0 percent rate, the net result was a significant tax reduction for many businesses and individuals alike.
Shortcomings and Complexities of Gross Receipts Taxation
Gross receipts taxes once dotted the landscape of the United States, with much of their expansion a desperate response to the ravages of the Great Depression,[19] but over time most were repealed or struck down. By 1987, following the repeal of West Virginia’s statewide Business & Occupation tax, only three statewide gross receipts taxes—in Delaware, Indiana, and Washington[20]—were left standing, and Indiana finally repealed its tax in 2002.[21] No state adopted a new gross receipts tax in the entire second half of the 20th century.[22] Since then, three states adopted but quickly repealed a gross receipts tax (Kentucky, Michigan, and New Jersey), while besides Ohio, only two other states (Nevada and Texas) have adopted and thus far retained their taxes.[23]
Because gross receipts taxes are imposed at intermediate stages of production and do not allow deductions for costs, they are not based on profits or net income (like a corporate income tax) or final consumption (like a well-constructed sales tax). They provide an advantage to businesses with high profit margins or considerable vertical integration, while they penalize companies with narrow margins or multiple transacted stages of production. Whereas other states have elected to set rates by industry category,[24] Ohio’s CAT is levied at a single rate.
| State | Name of GRT | No. of Rates | Lowest Rate | Highest Rate | Retail Rate |
|---|---|---|---|---|---|
| Delaware | Gross Receipts Tax | 54 | 0.1006% | 0.7543% | 0.7543% |
| Ohio | Commercial Activity Tax | 1 | 0.26% | 0.26% | 0.26% |
| Texas | Franchise (Margin) Tax | 2 | 0.375% | 0.75% | 0.375% |
| Nevada | Commerce Tax | 26 | 0.051% | 0.331% | 0.111% |
| Washington | Business & Occupation Tax | 35 | 0.13% | 3.3% | 0.471% |
Ohio’s CAT currently generates 6.3 percent of the state’s own-source tax revenue, which is slightly higher than average state reliance on a corporate net income tax, but the state and local taxes it displaced represented a still greater overall burden. Among states with gross receipts taxes, Ohio’s level of reliance is roughly on par with the taxes imposed in Delaware and Texas, and far less than Washington state’s 17.8 percent reliance on its Business & Occupation (B&O) tax. Notably, Ohio and three of the other four states which currently impose a statewide gross receipts tax do so in lieu of levying a corporate income tax. Currently, only Delaware imposes both taxes.
| State | Name of GRT | GRT Revenue | Share of State Revenue |
|---|---|---|---|
| Delaware | Gross Receipts Tax | $234.1 million | 5.9% |
| Ohio | Commercial Activity Tax | $1.75 billion | 6.3% |
| Texas | Franchise (Margin) Tax | $4.66 billion | 4.3% |
| Nevada | Commerce Tax | $143.5 million | 2.4% |
| Washington | Business & Occupation Tax | $3.63 billion | 17.8% |
By their very design, gross receipts taxes lack transparency. With the tax embedded in the price of goods and services, often several times over, it is difficult if not impossible to determine the total tax cost associated with a final transaction. Because gross receipts taxes are indifferent to ability to pay, moreover, they impose especially harsh burdens on low-margin firms or those posting losses. Such burdens can be particularly problematic for startups, which often lose money in their first few years of operations.[27]
In producing a good or delivering a service, businesses must make economic decisions about whether to handle processes (be they engineering, manufacturing, packaging, distribution, human resources, marketing, legal representation, retail sales, or anything else) in-house or to contract out to other providers. Ideally, this decision would be rendered based solely on the economic merits and without regard to tax planning, but under a gross receipts tax regime, a company able to bring more of the production process in-house receives an advantage over one that is not, which must bear the cost of the tax being imposed again at each external production stage.
This introduces inefficiency, to the extent that businesses make economic decisions hinging on tax arbitrage and avoidance strategies, and inequity, to the extent that businesses are unable to respond in this manner. When taxes are imposed at each stage of production, falling on intermediate business-to-business transactions, the result is what is known as tax pyramiding, with the cost of multiple levels of taxation ultimately passed along to the consumer.[28]
The figure below provides a stylized illustration of how the imposition of gross receipts taxes at each step of the production process leads to tax pyramiding. This results in an effective tax rate on the final transaction that can be multiples of the statutory tax rate.
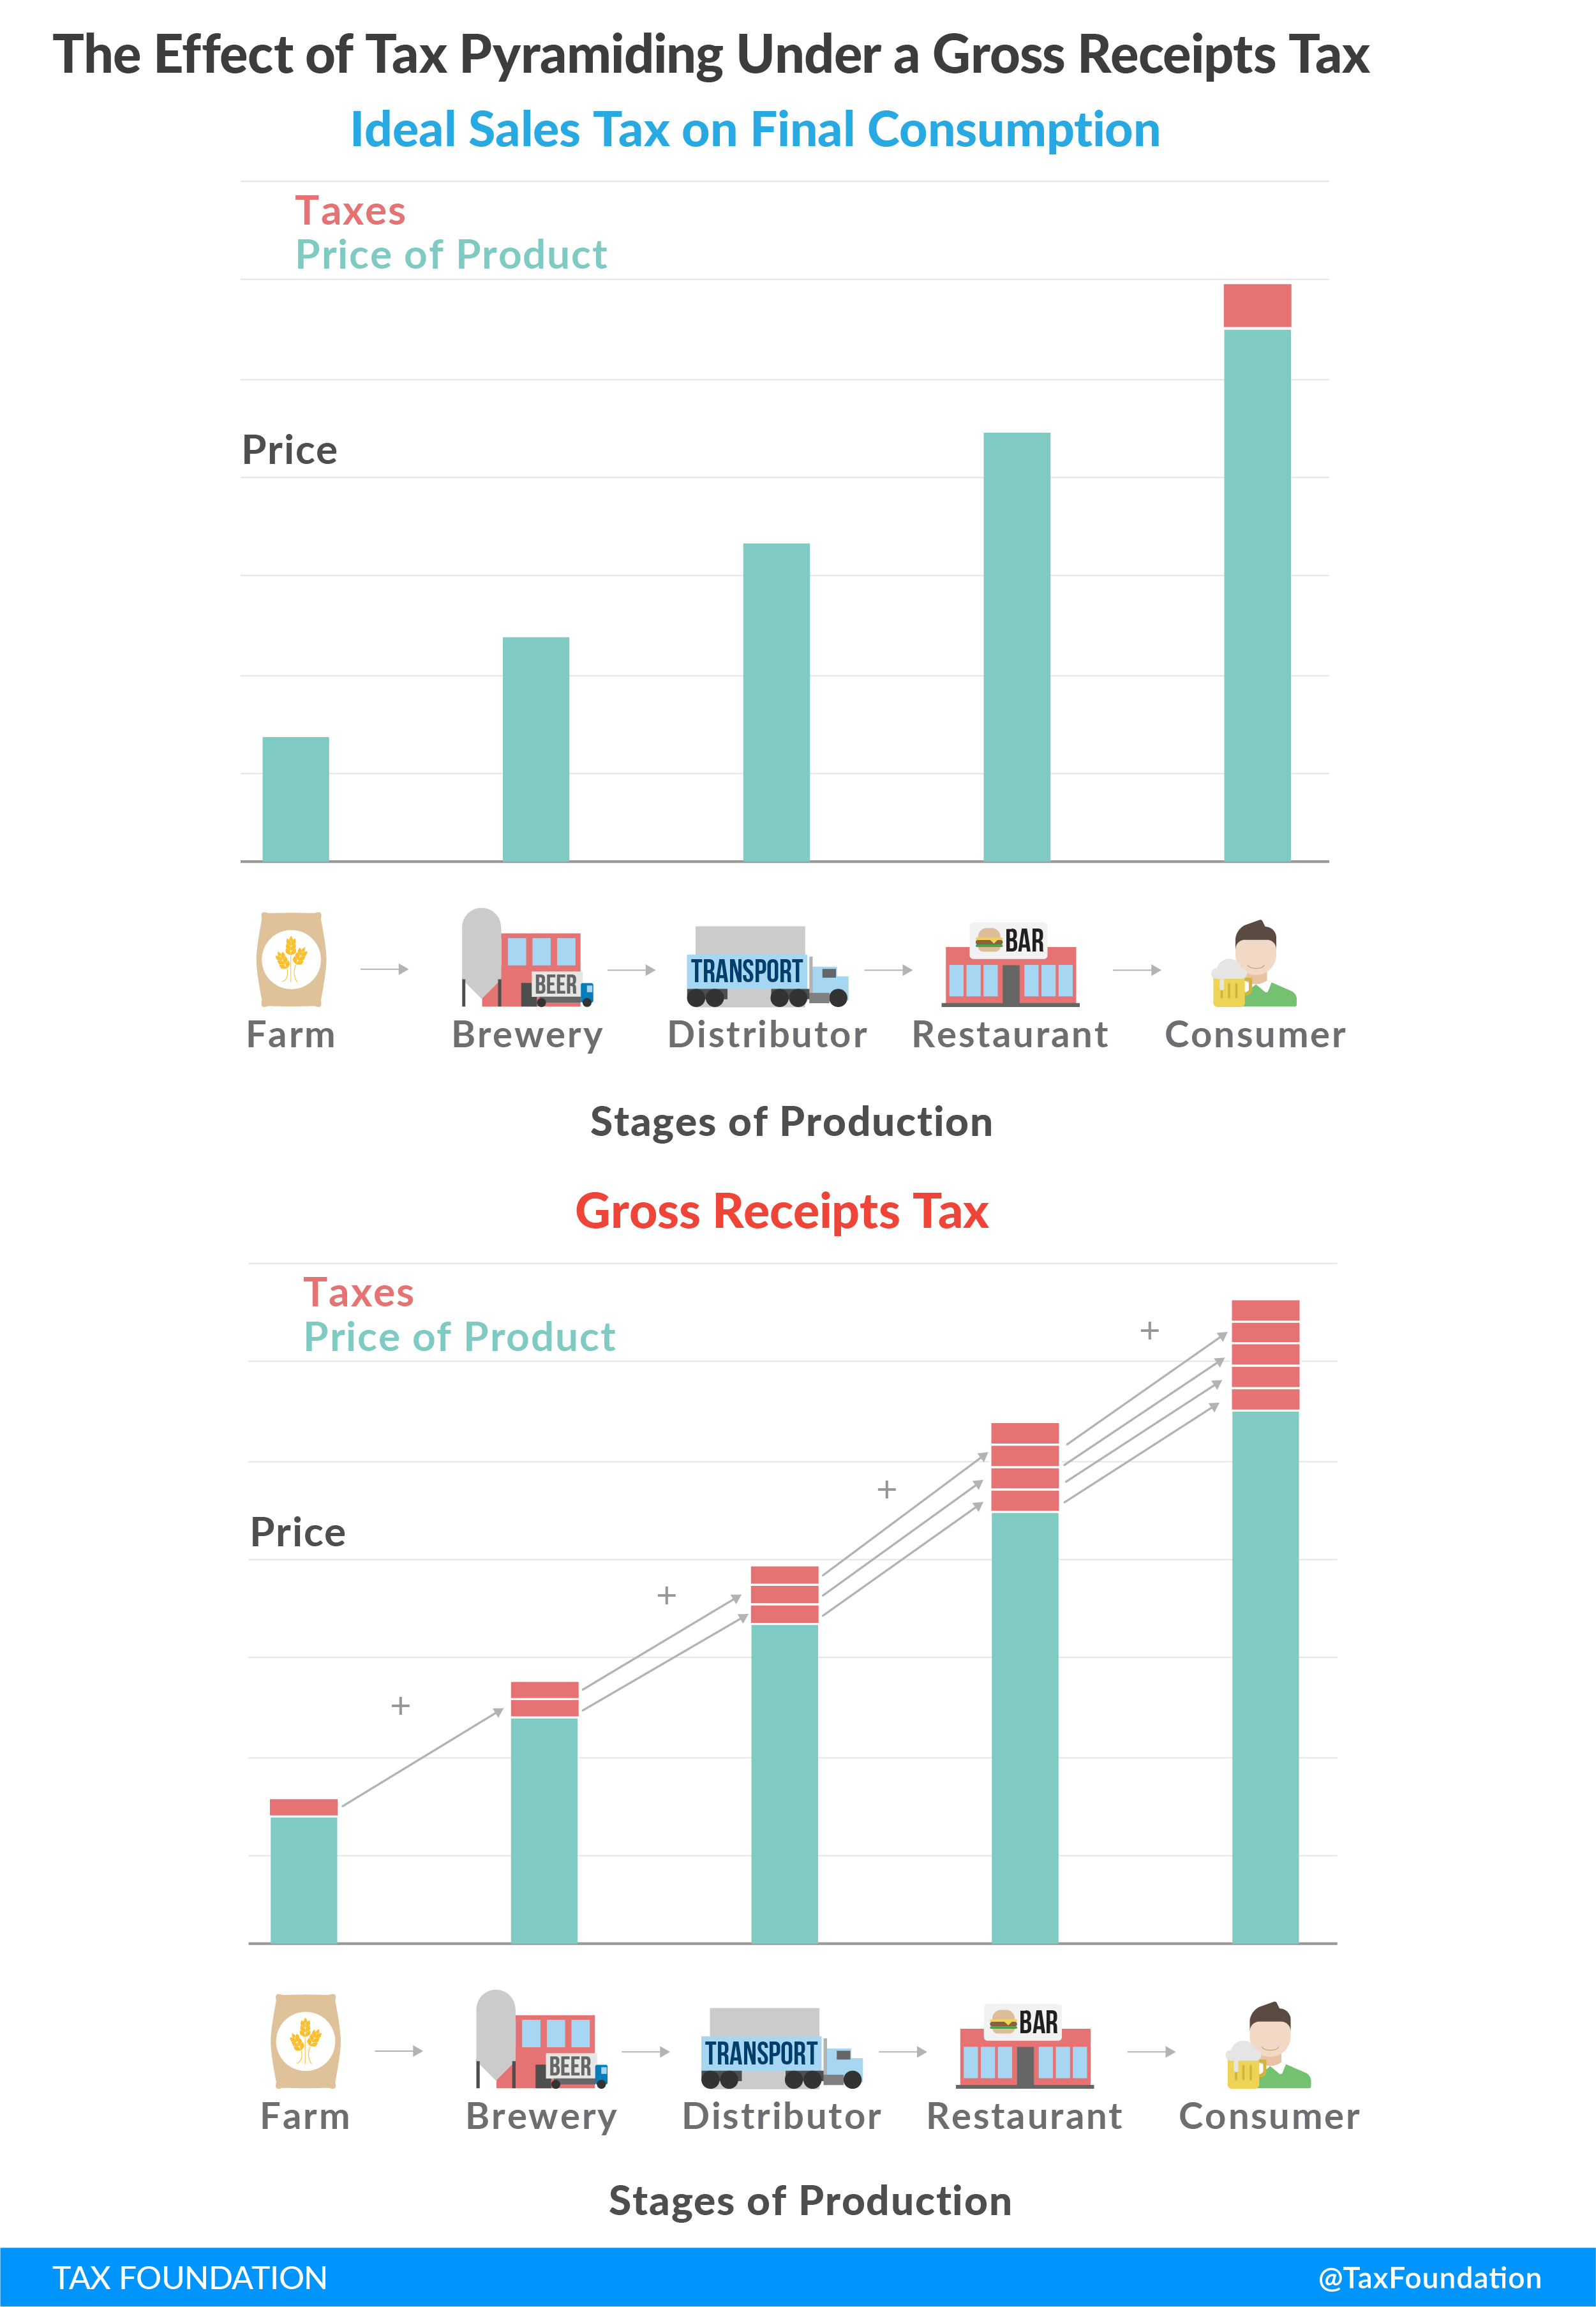
As far back as 1925, Dr. Edwin Seligman, a prominent economist, could write that “[t]axes on output or gross receipts which make no allowance for the expenses constitute a rough and ready system, suitable only for the more primitive stages of economic life.” He continued by noting that “in modern times … the tax on gross receipts is everywhere giving way to the tax on profits or net receipts” and terming gross receipts taxes “exceedingly inequitable as between various classes of business, or as between different individuals in the same class,” observing that in some cases, the gross receipts taxes of the era could be equivalent to a net income tax levied at 30 times the rate.[29] If anything, his case is even more compelling in the 21st century.
Governments sometimes favor gross receipts taxes for their deceptively low rates (since they are imposed on an extremely broad base) and their ability to generate large and stable amounts of revenue. There are, however, other taxes that likewise offer revenue stability, and their stability alone has generally been held insufficient as a justification for a tax which fails so dramatically on horizontal equity, the measure of whether a tax falls similarly on similarly situated taxpayers.
The second-oldest surviving gross receipts tax in the United States, Washington’s Business & Occupation (B&O) Tax,[30] comes in for routine criticism even from state government sources. A tax reform commission appointed by the state legislature in 2002 concluded that the tax system created substantial nonneutralities, that the tax pyramided an average of 2.5 times, and that it caused pyramiding of up to 6.7 times on some manufacturing industries, creating significant economic distortions.[31] Similar findings accompany other gross receipts taxes.
A gross receipts tax can also disadvantage in-state activity by incentivizing companies to work with out-of-state vendors to avoid pyramiding on those business inputs. Meanwhile, goods and services substantially or wholly produced outside of the state, and thus not subject to the tax, would stand to benefit. In response, Ohio and some other states with gross receipts taxes have adopted aggressive tax nexus standards which have invited lengthy legal battles.
Tax economist John Mikesell maintains that “there is no sensible case for gross receipts taxation”[32] and John Due, with whom he has collaborated on the standard work on state sales taxes, has documented how European and Latin American countries, many of which adopted gross receipts (or “turnover”) taxes after World War I, moved away from them as their defects came into focus.[33] Yet whereas in Washington state the B&O’s defects are widely acknowledged, the shortcomings of the Ohio CAT are often held to be largely theoretical, with the tax’s actual effects relatively benign. This perception is worth exploring, both to discover whether it is true and what implications the resulting conclusion has for other states considering a similar method of taxation.
Ohio’s Experience with a Gross Receipts Tax
Despite the well-documented shortcomings of gross receipts taxes, business reactions to the Ohio CAT have been subdued or even positive. It is this seeming lack of opposition, and the sense that the CAT has not harmed the state’s economy, that has allowed Ohio’s gross receipts tax structure to emerge as a model for other states. The response from the business community, however, is more complicated than it might seem at first glance, and to understand it, one must understand not only what the tax replaced, but also the tax package’s impact on state revenues.
In fiscal year 2004, the last full fiscal year before any provisions of HB 66 went into effect, the individual income tax, corporate franchise tax, and tangible personal property tax raised a combined $12.3 billion, representing 2.7 percent of Ohio gross state product. In fiscal year 2012, once all provisions of HB 66 were fully in effect, the individual income tax and Commercial Activity Tax raised $11.5 billion, representing 2.1 percent of gross state product. In real (inflationInflation is when the general price of goods and services increases across the economy, reducing the purchasing power of a currency and the value of certain assets. The same paycheck covers less goods, services, and bills. It is sometimes referred to as a “hidden tax,” as it leaves taxpayers less well-off due to higher costs and “bracket creep,” while increasing the government’s spendin-adjusted) terms, this represented a reduction of 23.6 percent in revenue from the affected taxes.[34]
Put another way, HB 66 provided both individuals and businesses with a substantial tax cut, even if the incidence of the new tax regime was somewhat arbitrary. The amount raised by the CAT in fiscal year 2012 is not only less than the amount raised by the two taxes it replaced, but actually trails tangible personal property tax receipts alone from fiscal year 2004 ($1.5 billion vs. $1.6 billion in nominal terms). For many business taxpayers, the CAT is largely unobjectionable not because it is a neutral or economically efficient form of taxation, but rather because the magnitude of the business tax cuts embodied in HB 66 is of sufficient size to silence most complaints about the resulting tax structure.
The degree to which the previous tax regime was also nonneutral, moreover, is difficult to overstate. The manufacturing industry, for instance, tends to be disadvantaged under a gross receipts tax due to tax pyramiding across the production and distribution chain. This is evidenced by the fact that the manufacturing sector remits 26.1 percent of the CAT’s total tax burden, far outstripping the industry’s share of net income in the state economy. Under the old regime, though, manufacturing concerns remitted a full 48.6 percent of the combined corporate franchise and tangible personal property tax collections. However inequitable the industry’s treatment under the CAT, it is far preferable to manufacturing’s tax exposure under the old system.[35]
The following table enumerates the percentage of total liability under the now-repealed corporate franchise and tangible personal property taxes, as well as the replacement Commercial Activity Tax, by select industries.[36] Some industries, like mining and construction, experienced an increase in the share of tax revenue for which they are responsible (though not necessarily an increase in their actual liability), while others, like manufacturing and wholesale/retail, took on a smaller share.[37] Reducing production costs for the state’s struggling manufacturing sector was an express goal of HB 66, and although some have questioned whether any effect is significant,[38] it appears that the state succeeded in this aim.
| Industry | CFT | TPP | Combined | CAT | |
|---|---|---|---|---|---|
| Old Tax System | |||||
| Agriculture and Forestry | 0.3% | 0.1% | 0.2% | 0.8% | |
| Mining | 0.6% | 0.2% | 0.3% | 1.8% | |
| Construction | 3.9% | 1.0% | 2.0% | 5.5% | |
| Manufacturing | 27.6% | 59.0% | 48.6% | 26.1% | |
| Wholesale and Retail Trade | 23.0% | 28.4% | 26.6% | 12.8% | |
| Finance, Insurance, and Real Estate | 7.9% | 2.0% | 4.0% | 5.7% | |
The professional services firm EY (formerly Ernst & Young) calculated effective tax rates as a percentage of net income for major industry sectors (by NAICS code) under the CAT using profits/receipts ratios. For instance, wholesalers have average profit margins of 3 percent, so the CAT’s 0.26 percent rate on gross receipts yields an effective rate of 8.3 percent of net income. The EY analysis yields a weighted average 4.7 percent expected tax rate on profits for businesses with $10 million in taxable receipts,[40] with effective rates ranging from 0.4 percent on corporate management to 8.6 percent on construction. Most notably, this analysis only considers one side of the coin—profit margins—and not another equally significant factor: tax pyramiding.
| Industry Sector | Profit/Receipts Ratio | Effective Tax Rate |
|---|---|---|
| Agriculture, Forestry, Hunting, and Fishing | 5% | 4.7% |
| Mining | 4% | 6.7% |
| Construction | 3% | 8.6% |
| Manufacturing | 6% | 4.0% |
| Wholesale | 3% | 8.3% |
| Retail | 3% | 7.9% |
| Transportation and Warehousing | 4% | 7.0% |
| Information | 8% | 3.4% |
| Real Estate and Rental & Leasing | 18% | 1.4% |
| Professional, Scientific, and Technical Services | 5% | 5.0% |
| Management of Companies (Holding Companies) | 70% | 0.4% |
| Administrative/Support, Waste Management | 4% | 6.3% |
| Educational Services | 6% | 4.5% |
| Health Care and Social Assistance | 6% | 4.4% |
| Arts, Entertainment, and Recreation | 4% | 6.2% |
| Accommodation, Food Services, Drinking Places | 6% | 4.4% |
| Other Services | 4% | 6.0% |
| Weighted Average | 5% | 4.7% |
Any process of production involves intermediate steps, but how many—and crucially, how many of them involve transactions with third parties—will vary across industries and individual firms. Since the CAT is imposed on receipts from all transactions, any stages in the production process which are performed by separate entities will be subject to the CAT on the total value of that transaction. The EY report sets up a hypothetical involving a perfectly plausible six-stage production process with a 30 percent value-add at each stage. In this scenario, the effective rate would be 3.43 times higher than the statutory tax rate would suggest. A hypothetical manufactured good (4.0 percent effective rate before pyramiding) with six stages of production, then, would be subject to a tax equivalent to 13.73 percent of net income.[42]
In 2002, the Washington State Legislature commissioned a report on its tax code which found, among other things, that production subject to the B&O tax pyramided an average of 2.5 times. This does not simply mean that, on average, there are 2.5 stages of production, but rather that the stages of production are sufficient for the tax to be imposed 2.5 times on the resulting process.[43]
Estimated rates of pyramiding vary greatly in the Washington study, from 1.4 times for computer and data services to 6.7 times for food manufacturing and petroleum refining. While we might expect some regional variation in industry practices,[44] these estimates provide a helpful frame of reference in analyzing other systems of gross receipts taxation.
Ohio ranks second in the nation in raw steel production.[45] If we take the 4.1 degrees of pyramiding associated with metal manufactures under the B&O and apply it to the 4.0 percent effective rate calculated by EY, the result is an astonishing 16.4 percent effective rate against net income.[46] A typical wholesaler, experiencing an 8.3 percent pre-pyramiding effective rate, might face a tax rate equal to 15.8 percent of net income under the CAT. Such effective rates are easily more than half the tax liability such firms would experience under the federal corporate income tax, with a top statutory tax rate of 35 percent.[47]
A sense of the magnitude of the Ohio CAT can be gleaned from the fact that the current federal corporate income tax, with a top rate of 35 percent, could be replaced by a 1.1 percent gross receipts tax, with no deductions, exemptions, or credits, without loss of revenue. (If the current ratio of tax deductions, exemptions, and credits were maintained, the required rate would be 1.6 percent, and this may be a better point of comparison, since it includes deductions for foreign taxes paid.)[48] Even with its $1 million exemption, the Ohio CAT, at 0.26 percent, raises 11.6 percent of the amount generated from Ohio businesses by the federal corporate income tax.[49]
At the federal level, the Internal Revenue Service reports gross receipts, net income, and tax liability across all industry sectors. While the ratios of industry net income to gross receipts in Ohio may differ somewhat from the national ratios, this nonetheless provides a useful point of comparison, allowing us to contemplate what the tax rates would be on each major sector if the Ohio CAT were converted into a corporate income tax. Since, in practice, corporate income taxes tend to be carved out with a range of tax preferences, an actual replacement corporate income tax would likely have far higher statutory tax rates than the following calculated effective rates, but they provide a further indication of how disparate the treatment of different industries is under the CAT.
| Industry Sector | Effective Rate as % of Net Income | Variation from Avg. Effective Rate |
|---|---|---|
| Agriculture, Forestry, Hunting, and Fishing | 3.3% | 11.0% |
| Mining | 2.9% | -4.4% |
| Utilities | 11.7% | 290.9% |
| Construction | 5.5% | 83.2% |
| Manufacturing | 3.5% | 17.4% |
| Wholesale and Retail Trade | 7.2% | 140.5% |
| Transportation and Warehousing | 4.9% | 62.4% |
| Information | 2.1% | -30.0% |
| Finance and Insurance | 0.9% | -68.5% |
| Real Estate and Rental & Leasing | 0.8% | -74.4% |
| Professional, Scientific, and Technical Services | 3.2% | 6.5% |
| Management of Companies (Holding Companies) | 0.3% | -91.2% |
| Administrative/Support, Waste Mgmt., Remediation | 4.6% | 52.6% |
| Educational Services | 3.5% | 17.8% |
| Health Care and Social Assistance | 3.6% | 20.2% |
| Arts, Entertainment, and Recreation | 3.2% | 8.3% |
| Accommodation, Food Services, Drinking Places | 3.4% | 13.7% |
| Other Services | 4.3% | 44.2% |
| Total | 3.0% | 0.0% |
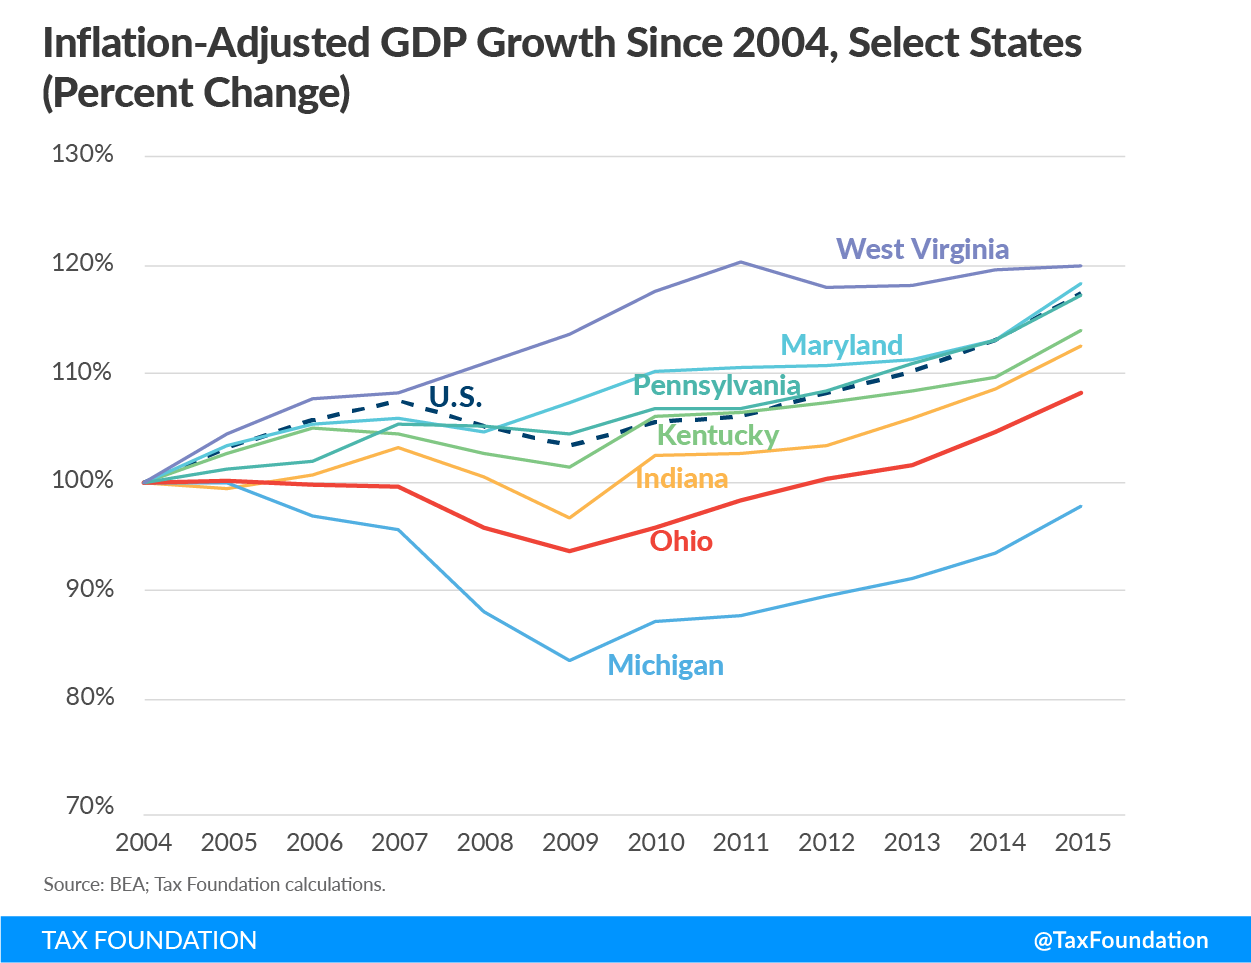
Despite representing a substantial tax cut, it is difficult to identify any economic gains associated with the adoption of HB 66. Certainly, the Ohio CAT is not the impediment to growth that Washington state’s much larger B&O gross receipts tax is, and the taxes it replaced were arguably more of a hindrance to capital formation than the CAT is, for all its flaws. Since the adoption of HB 66, Ohio’s economic growth has lagged that of the nation as a whole and trailed all of its regional competitors except Michigan.[51] At the height of the Great RecessionA recession is a significant and sustained decline in the economy. Typically, a recession lasts longer than six months, but recovery from a recession can take a few years., unemployment rose as high as 11.0 percent, again worse than most regional competitors but better than the even more manufacturing-heavy Michigan economy.[52]
At the same time, however, any Rust Belt state with Ohio’s industry mix was bound to face headwinds over the past decade. While HB 66 was designed to help diversify Ohio’s economy and promote economic expansion, it must be judged in relative terms, not with the expectation that any tax reform could have addressed every challenge buffeting the state. Perhaps the most we can say is that the CAT has not notably improved economic outcomes in Ohio despite being part of a large tax cut package.
Aggressive Nexus Standards Under a Gross Receipts Regime
The perception that the preexisting tax structure fell heavily on Ohio-based companies but raised little revenue from out-of-state companies lacking significant in-state operations was a stated motivation for adopting a gross receipts tax, which could, proponents hoped, bring additional economic activity within its scope.[53] Accordingly, the CAT adopts an aggressive nexus standard, one that has drawn—and will continue to draw—a series of legal challenges.
States may only levy taxes on individuals and businesses which have “nexus” with the state, meaning that they meet certain legal standards regarding their presence in the state. Most states only impose taxes on individuals and businesses with some physical presence in the state, both in accordance with court rulings and on the theory that taxes should bear some relation to benefits received.
The text of the Ohio CAT statute, however, stakes out an exceedingly broad definition of nexus for purposes of the tax, one that encompasses any person or business which (1) owns or uses part or all of its capital in Ohio, (2) holds a license authorizing it to conduct business in the state, (3) has a “bright-line” presence in the state, or (4) otherwise has nexus under the U.S. Constitution. In practice, however, the Ohio Department of Taxation has focused exclusively on persons with a bright-line presence, which is defined as meeting any of the following qualifications:[54]
- Possessing at least $50,000 in Ohio property at any time during the calendar year;
- Having at least $50,000 in Ohio payroll during a calendar year;
- Having at least 25 percent of property, payroll, or sales in Ohio;
- Generating at least $500,000 in taxable gross receipts in Ohio during the calendar year; or
- Being domiciled in Ohio.[55]
Of these, two stand out: the ability for substantial nexus to be achieved through $500,000 in taxable gross receipts or through 25 percent of sales coming into Ohio. These are notable because neither requires any actual physical presence in the state of Ohio. It does not require ownership of any property in Ohio, having any employees based there, or for that matter anyone ever setting foot in Ohio.
The U.S. Supreme Court, in Complete Auto Transit, Inc. v. Brady, established the nexus requirement, instituting a four-part mandating that a taxed activity (1) have substantial nexus with the taxing state, (2) be fairly apportioned to activities carried out by the taxpayer within the state, (3) not discriminate against interstate commerce, and (4) be fairly related to the services the state provides in order to be compliant with the Commerce Clause of the U.S. Constitution. In Quill Corp. v. North Dakota, the Court clarified that—at least for sales and use taxes, and possibly but not indisputably for other taxes—nexus requires that a business be physically present in the state.[56] Another case, Tyler Pipe v. Washington Department of Revenue, established that independent contractors in the state were sufficient to meet physical presence requirements under that state’s B&O tax.
The bright-line test employed by the Ohio CAT, which requires what is known as “factor presence” rather than physical presence,[57] has drawn numerous legal challenges including, most recently, Crutchfield v. Testa, Newegg v. Testa, and Mason Companies v. Testa. All three involved out-of-state retailers without employees or facilities in Ohio. In November of 2016, the Ohio Supreme Court ruled that the bright-line presence standard satisfied the requirements of the Commerce Clause,[58] becoming the first state supreme court to have reached such a conclusion.[59] The state supreme court’s conclusion that the $500,000 threshold provided an “adequate qualitative standard” is one likely to be reviewed by the U.S. Supreme Court.
These three cases are just the most recent of a spate of challenges to the nexus standards employed under the CAT, which are uncommonly aggressive among state tax regimes. Even if the U.S. Supreme Court someday settles the broader question in Ohio’s favor, which is uncertain, the many complexities of the tax (how, for instance, should the tax fall upon a transaction which involves both goods and services, if the services benefit activities in multiple states?), all but guarantee future litigation.
Other States Turning to the CAT
The perceived success of the Ohio Commercial Activity Tax has spawned would-be imitators. Proposals closely modeled on the CAT, and even called by the same nomenclature, emerged in states as disparate as Louisiana, Oklahoma, Oregon, and West Virginia in 2017. The CAT has also been used as a point of comparison for much higher-rate gross receipts tax proposals, such as Oregon Measure 97 (2016), which would have imposed a 2.5 percent tax on gross receipts in excess of $25 million.[60]
That Ohio’s CAT is considered a success story is to some extent a product of lowered expectations considering widespread recognition of the deficiencies of prior statewide gross receipts taxes, many of which have been repealed. Nevertheless, the circumstances and implementation of Ohio’s gross receipts tax regime markedly differ from many of the tax systems for which CAT-style gross receipts taxes have been proposed more recently.
Louisiana, Oklahoma, Oregon, and West Virginia all have one feature of their tax code that Ohio forgoes: a corporate income tax. Ohio repealed its corporate income tax (a component of its corporate franchise tax, imposed on the greater of corporate net income or corporate franchise tax liability) in adopting the CAT. Conversely, proposals in three of the four states contemplating a gross receipts tax in 2017 anticipated levying a CAT-like tax in addition to, or as a minimum tax under, the corporate income tax. Currently, only Delaware imposes both a statewide gross receipts tax and a corporate income tax.
Ohio, moreover, is unique in maintaining a single low rate (0.26 percent) rather than adopting a schedule of industry-specific rates. Other states’ rate schedules are intended to help ameliorate the disparities in effective rates experienced by different industries, but their proliferation—which situates taxpayers in competing camps—also appears to weaken commitments to keeping rates low and incentivizes a range of economically inefficient tax arbitrage activities.
Layering a CAT-like gross receipts tax atop an existing tax code necessarily increases economic distortions and further undermines tax neutrality. An ideal tax code raises the intended revenue with the least possible impact on economic decision-making. Whereas the CAT, despite its many shortcomings, replaced taxes responsible for even greater economic distortions, most efforts to imitate the CAT propose it as a supplement to, and not a replacement for, existing elements of the tax code, most of which introduce fewer distortions. Furthermore, states adopting the Ohio CAT model would take a significant revenue hit should the Supreme Court ultimately rule against its lenient nexus standards.
Alternatives to Gross Receipts Taxes
After a half century of pariah status, the archaic gross receipts tax is suddenly new again. The tax’s superficial appeal is obvious enough: a stable source of revenue at a time when traditional corporate income tax revenues are eroding, with a seemingly low rate and a base which captures businesses which lack corporate income tax liability in the state.[61] However, the factors which led states to abandon gross receipts taxes have not changed. The passage of time has rendered them no less of an impediment to economic growth. Even when corporate income taxes are bogged down by inefficient base-narrowing tax preferences and saddled by competing apportionment rules, as is often the case, they remain economically superior to a tax on gross receipts.
Where revenues are required, other options—like broadening the sales tax base or eliminating preferences in an existing corporate income tax—are far less economically destructive than modeling a tax provision based on the Ohio CAT. The resurgence of interest in gross receipts taxation is a throwback in the worst sense, the embrace of an inefficient and inequitable tax long since superseded by more modern revenue tools. Ohio’s experience, at most, offers a cautionary tale about capital stock and tangible personal property taxes, not a recommendation of gross receipts taxes. By learning the wrong lessons from the Buckeye State, other states risk embarking on a perilous course. Proponents hope the CAT has many lives—but for this CAT, even one life is one too many.
Stay informed on the tax policies impacting you.
Subscribe to our free newsletter to get the latest tax data, news and analysis.
Subscribe[1] O.R.C. § 5751.03.
[2] Limited deductions are permitted to account for cash discounts taken, product returns, and bad debts on which the tax has been paid previously. See O.R.C. § 5751.01(E); and Brian Ertmer & Robert Sash, “The Ohio Commercial Activity Tax,” Journal of State Taxation 24 (Mar-Apr 2006): 14.
[3] Ohio Department of Taxation, “2015 Annual Report”: 38-39. http://www.tax.ohio.gov/Portals/0/communications/publications/annual_reports/2015_Annual_Report/2015_AR.pdf.
[4] O.R.C. § 5751.01(H).
[5] Ohio Department of Taxation, “Corporation Franchise Tax”: 1-2. http://www.tax.ohio.gov/portals/0/communications/publications/corporation_franchise_tax.pdf.
[6] April L. Butler, “A Look at What the CAT Dragged In: The Problems Inherent in Ohio’s Commercial Activity Tax,” University of Dayton Law Review 32, Vol. 1 (2006-2007): 105.
[7] Ohio Department of Taxation, “2007 Annual Report: 140. http://www.tax.ohio.gov/portals/0/communications/publications/annual_reports/2007_annual_report/ar_2007_entire.pdf.
[8] Id., “2005 Annual Report”: 15-16. http://www.tax.ohio.gov/portals/0/communications/publications/annual_reports/2005_annual_report/coverandtext.pdf.
[9] Ohio Department of Development, “Major Tax Changes in Ohio Tax Law” (July 14, 2005). http://www.clermontcountyohio.biz/wp-content/uploads/ohiotaxreformsummary.pdf; and Ohio Department of Taxation, “2007 Annual Report.”
[10] Bloomberg BNA, “Corporate Income Tax State Rates”: (2005).
[11] Ohio Department of Taxation, “2005 Annual Report”: 59.
[12] Tax Foundation, “Facts & Figures 2017.” https://taxfoundation.org/facts-figures-2017/.
[13] Ohio Department of Taxation, “2007 Annual Report”: 143.
[14] See generally, Joyce Errecart, Ed Gerrish, & Scott Drenkard, “States Moving Away from Taxes on Tangible Personal Property,” Tax Foundation Background Paper No. 63: (Oct. 4, 2012). https://taxfoundation.org/states-moving-away-taxes-tangible-personal-property/.
[15] The phasedowns proceeded from an initial rate of 25 percent. The inventory tax rate was harmonized with the other tangible personal property tax rates in the first year of assessment ratio reductions.
[16] Ohio Department of Revenue, “Ohio Individual Income Tax Rates: 2005-2016.” http://www.tax.ohio.gov/ohio_individual/individual/annual_tax_rates.aspx.
[17] Id.
[18] See, e.g., William Testa & Richard Mattoon, “Is There a Role for Gross Receipts Taxation?” National Tax Journal 60, No. 3 (Dec. 2007): 837.
[19] Id.: 821.
[20] John Mikesell, “Gross Receipts Taxes in State Government Finances: A Review of Their History and Performance,” Tax Foundation Background Paper No. 53 (Jan. 31, 2007): 5-6. https://taxfoundation.org/gross-receipts-taxes-state-government-finances-review-their-history-and-performance/.
[21] Nicole Kaeding & Erica Wilt, “Gross Receipts Taxes: Lessons from Previous State Experiences,” Tax Foundation Fiscal Fact No. 523 (Aug. 10, 2016): 3. https://taxfoundation.org/gross-receipts-taxes-state-experiences/.
[22] Andrew Chamberlain & Patrick Fleenor, “Tax Pyramiding: The Economic Consequences of Gross Receipts Taxes,” Tax Foundation Special Report No. 147 (Dec. 4, 2006): 3. https://taxfoundation.org/tax-pyramiding-economic-consequences-gross-receipts-taxes/.
[23] In Texas, recently adopted legislation reducing the rate of the state’s gross receipts tax includes language signaling the legislature’s intent to phase the tax out entirely over time.
[24] Texas only distinguishes between retail/wholesale and all other transactions.
[25] Delaware Division of Revenue, “Gross Receipts Tax Frequently Asked Questions.” http://revenue.delaware.gov/information/faqs_gr.shtml; Texas Comptroller of Public Accounts, “Franchise Tax.” https://comptroller.texas.gov/taxes/franchise/; Nevada Department of Taxation, “Commerce Tax Questions and Answers.” https://tax.nv.gov/uploadedFiles/taxnvgov/Content/FAQs/Commerce_Tax_FAQs.pdf; Washington Department of Revenue, “Business & Occupation Tax Classifications.” http://dor.wa.gov/Content/FindTaxesAndRates/BAndOTax/BandOrates.aspx; and Id., “Business Tax Basics.” http://dor.wa.gov/docs/Pubs/ExciseTax/BusinessTaxBasics.pdf
[26] Delaware Department of Finance, “DEFAC General Fund Revenue Worksheet.” http://finance.delaware.gov/publications/defac/03_17/revenues.pdf; Ohio Department of Taxation, “2015 Annual Report.” http://www.tax.ohio.gov/Portals/0/communications/publications/annual_reports/2015_Annual_Report/2015_AR.pdf; Texas Comptroller of Public Accounts, “Revenue by Source for Fiscal Year 2015.” https://comptroller.texas.gov/transparency/reports/revenue-by-source/; Nevada Department of Taxation, “Annual Report Fiscal Year 2016.” https://tax.nv.gov/uploadedFiles/taxnvgov/Content/TaxLibrary/Annual%20Report%20FY16%20FINAL%20FINAL(1).pdf; and Washington Department of Revenue, “Summary of Washington State Tax Collections.” http://www.dor.wa.gov/Docs/Reports/2016/Tax_Statistics_2016/Table1.pdf.
[27] Butler: 122.
[28] Justin Ross, “Gross Receipts Taxes: Theory and Recent Evidence,” Tax Foundation Fiscal Fact No. 529 (Oct. 6, 2016): 6-7. https://taxfoundation.org/gross-receipts-taxes-theory-and-recent-evidence/.
[29] Edwin R.A. Seligman, Studies in Public Finance, New York: The Macmillan Company, 1925, 134-135.
[30] The persistence of Washington’s B&O is likely due to constitutional constraints which have prevented the state from levying taxes on income, including corporate income.
[31] See generally, Washington State Tax Structure Study Committee, “Tax Alternatives for Washington State: A Report to the Legislature,” Vols. 1 & 2 (Nov. 2002).
[32] Mikesell: 2.
[33] John Due, Indirect Taxation in Developing Countries, Revised Edition, Baltimore: Johns Hopkins Press, 1988, 92-93.
[34] Ohio Department of Taxation, “Annual Report” (multiple years); Tax Foundation calculations. These calculations neglect the rate change in the state sales tax, which stood at 6.0 percent prior to the adoption of HB 66. This rate was intended to be temporary, with an ultimate restoration of the old 5.0 percent rate. The 2005 tax package set a rate of 5.5 percent, a reduction against the status quo but an increase against a baseline that anticipated a forthcoming rate reduction.
[35] Ohio Department of Revenue, “Annual Reports” (multiple years); Tax Foundation calculations.
[36] A lack of comparable categories across Ohio Department of Revenue annual reports limits the ability to expand this analysis to a broader array of industries.
[37] Ohio Department of Revenue, “2006 Annual Report”: 63, 168-169. http://www.tax.ohio.gov/portals/0/communications/publications/annual_reports/2006_annual_report/2006ar_entire_report.pdf; Id., “2015 Annual Report”: 42.
[38] Jon Honeck, “The 2005 Tax Overhaul and Ohio’s Economy,” Policy Matters Ohio (Jan. 2009): 10.
[39] Ohio Department of Revenue, “Annual Reports” (multiple years); Tax Foundation calculations.
[40] EY’s focus on firms with at least $10 million in taxable receipts is not about tax exposure per se, as the CAT falls on all receipts above $1 million. Rather, their analysis models the profit margins of larger firms.
[41] Daniel Mullins, Andrew Phillips, & Daniel Sufranski, “Analysis of Proposed Changes to Select Ohio Taxes Included in the Ohio Executive Budget and Ohio House Bill Number 64,” State Tax Research Institute and EY Quantitative Economics and Statistics Practice (Mar. 2015): 20. http://www.cost.org/WorkArea/DownloadAsset.aspx?id=89660.
[42] Id.
[43] Washington State Tax Structure Study Committee, “Tax Alternatives for Washington State: A Report to the Legislature,” Vol. 2 (Nov. 2002): 41.
[44] In particular, Ohio has an exemption for qualifying distribution center receipts, exempting the distribution stage for companies with large amounts of tangible property flowing through warehouses. See, e.g., Ohio Department of Taxation, “Commercial Activity Tax: Qualified Distribution Centers” (Nov. 2014). http://www.tax.ohio.gov/commercial_activities/information_releases/cat200607.aspx.
[45] Ohio Department of Development, “Economic Overview.” https://development.ohio.gov/files/research/E1000.pdf.
[46] Washington State Tax Structure Study Committee: 41
[47] Internal Revenue Service, “Corporation Data by Sector,” Statistics of Income, 2014. https://www.irs.gov/uac/soi-tax-stats-corporation-data-by-sector-or-industry; Id., “Tax Stats – Gross Collections.” https://www.irs.gov/uac/soi-tax-stats-gross-collections-by-type-of-tax-and-state-irs-data-book-table-5.
[48] Id., “Corporation Data by Sector.”
[49] Id., “Tax Stats – Gross Collections.”
[50] Ohio Department of Revenue, “2015 Annual Report”: 42; Internal Revenue Service, “Corporation Data by Sector.”
[51] Bureau of Economic Analysis, “Gross Domestic Product for States and Metropolitan Areas.” https://www.bea.gov/iTable/index_regional.cfm.
[52] Bureau of Labor Statistics, “Local Area Unemployment Statistics.” https://www.bls.gov/lau/.
[53] Butler: 104.
[54] Thomas Niedzielski, “Ohio’s Commercial Activity Tax: Tax Reform and the Cost of Doing Business,” Journal of State Taxation 27 (2008-2009): 27.
[55] O.R.C. § 5751.01(I).
[56] See, e.g., Chris Atkins, “Important Tax Cases: Quill Corp v. North Dakota and the Physical Presence Rule for Sales Tax Collection,” Tax Foundation Policy Blog (July 19, 2005). https://taxfoundation.org/important-tax-cases-quill-corp-v-north-dakota-and-physical-presence-rule-sales-tax-collection/.
[57] See, e.g., Joe Neff, Michael Williams, & Mike Draper, “The Emergence of Factor Presence Nexus Standards,” The Tax Adviser (Apr. 1, 2011). http://www.thetaxadviser.com/issues/2011/apr/clinic-story-12.html.
[58] Crutchfield Corp. v. Testa, Slip Opinion No. 2016-Ohio-7760. https://www.supremecourt.ohio.gov/rod/docs/pdf/0/2016/2016-Ohio-7760.pdf
[59] Patrick Skeehan, “The Impact of ‘Crutchfield’: Bright-Line Presence and the Erosion of ‘Quill,’” Bloomberg BNA Daily Tax Report (Mar. 7, 2017). https://www.bna.com/impact-crutchfield-brightline-n57982084841/.
[60] See, e.g., Oregon Legislative Revenue Office, “Measure 97: Description and Analysis,” Research Report #3-16 (Sept. 2016). https://www.oregonlegislature.gov/lro/Documents/RR%203-16%20Measure%2097.pdf.
[61] For a cautious defense of low-rate gross receipts taxes in an environment of declining corporate income tax revenues, see William Fox, LeAnn Luna, & Matthew Murray, “Emerging State Business Tax Policy: More of the Same, or Fundamental Change?” State Tax Notes 44 (May 7, 2007): 393-405.
Share this article