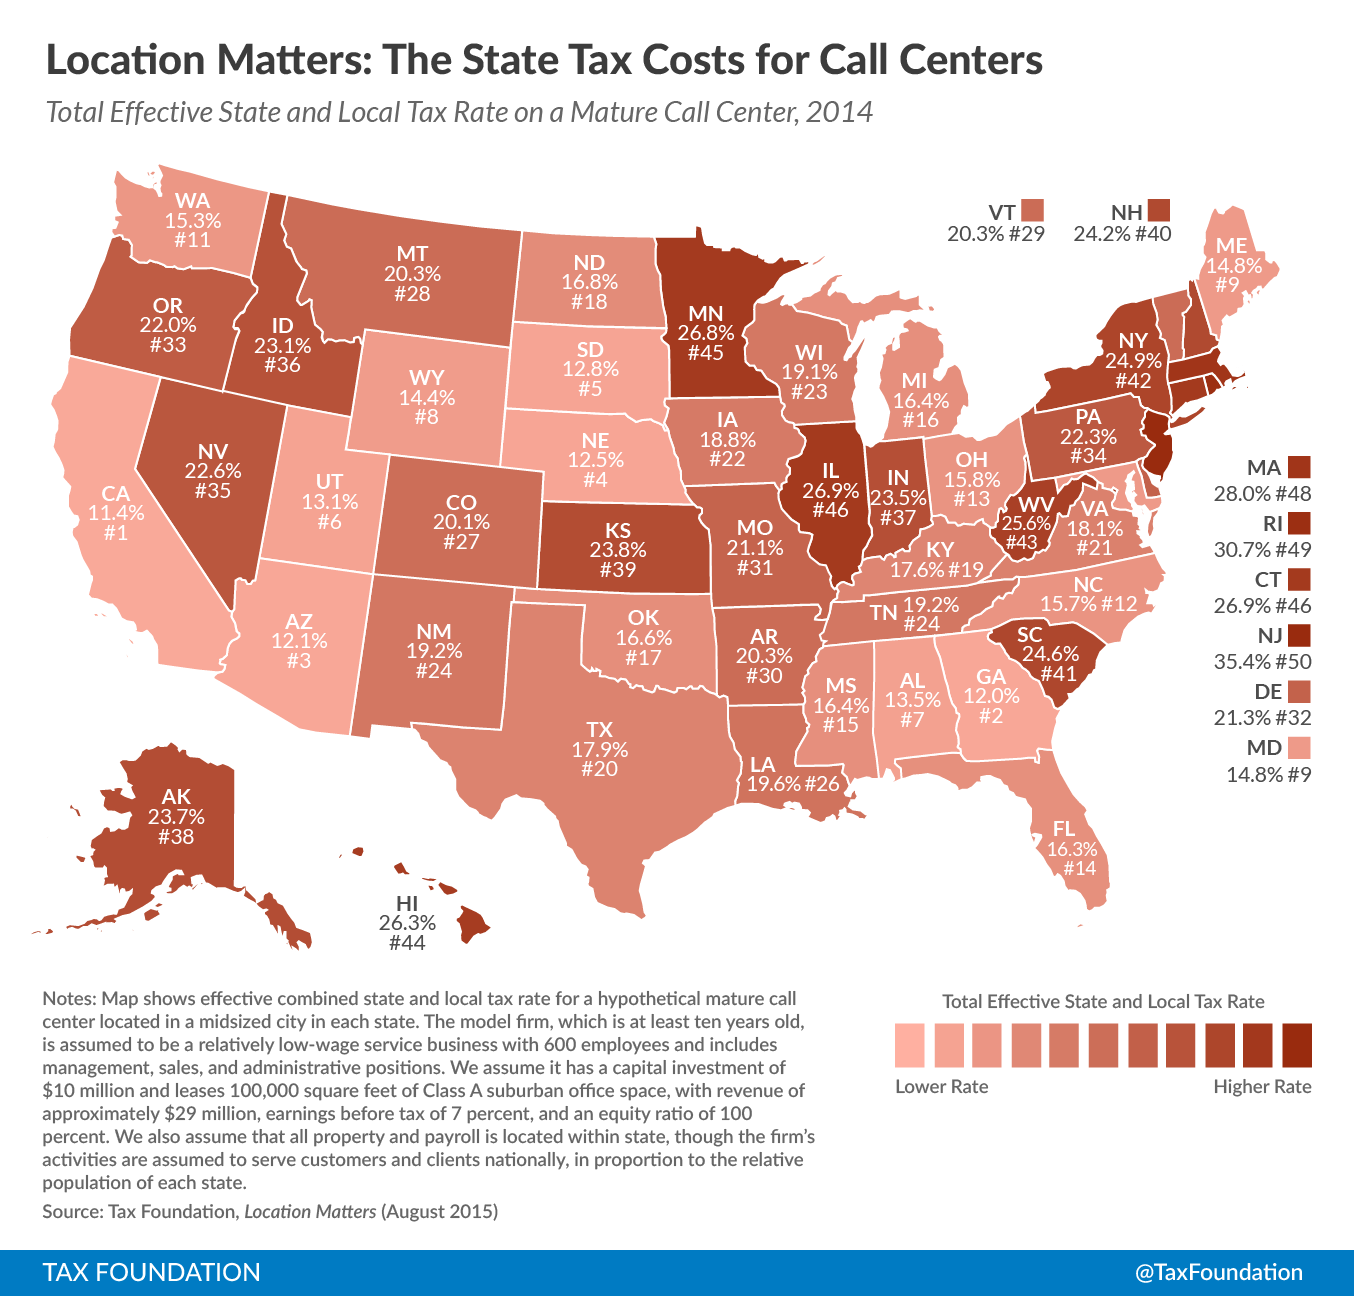
New Jersey’s effective tax rate on mature call centers is 35.4 percent, the highest in the nation. New Jersey’s effective taxA tax is a mandatory payment or charge collected by local, state, and national governments from individuals or businesses to cover the costs of general government services, goods, and activities. rate on new call centers is -53.5 percent (yes, negative), far and away the lowest in the nation. And therein lies the story of just how significant (and distortive) tax incentives can be, and how radically tax burdens can differ across both firm types and firm maturity.
We look at call centers in Location Matters (a study which calculates the tax bills of seven model firms across all fifty states) because they are an excellent proxy for a certain kind of operation: labor-intensive, relatively low-wage and low-skill, and reasonably mobile.
Click on map to enlarge. (See our reposting policy here.)
Call centers can pop up just about anywhere. They employ a lot of people (economic development agencies love that) and don’t require a lot of lead time to get started (ditto). Conversely, though, the jobs generally aren’t highly paid and it’s easier for a firm to relocate (say, after tax incentives run out) than it would be for a more capital-intensive operation.
Because such firms are labor-intensive but comparatively light on capital, unemployment insurance taxes—which track employment costs, not revenue or capital—are more significant to these operations than they are to the average company, while corporate income and property taxes may matter somewhat less. In fact, the burden of UI taxes is frequently higher than the corporate income tax burden for these firms. In some states, however, it all comes down to incentives.
States often turn to job creation credits to induce economic development. There is always the risk, in offering any such incentives, that the incentives will flow to companies which would have created the jobs anyway, or will encourage relocation rather than growth. And any sort of tax expenditure has to be offset somewhere else in the system, meaning higher taxes on other operations—which can, of course, cost jobs elsewhere.
The downside for other taxpayers can loom particularly large when those job creation incentives actually outstrip recipient firms’ total tax liability, which sometimes happens. Job incentives often take the form of withholding tax rebates. Sometimes job creation credits are denominated in a set dollar amount per job created, as in New Jersey, where a refundable $5,000 credit is offered per hire. The result is that, rather than the firm paying taxes to the state, the state actually winds up paying the firm.
New Jersey’s -53.5 percent rate for new call centers is, of course, atypical, but fourteen states offer withholdingWithholding is the income an employer takes out of an employee’s paycheck and remits to the federal, state, and/or local government. It is calculated based on the amount of income earned, the taxpayer’s filing status, the number of allowances claimed, and any additional amount the employee requests. tax rebates to new call centers, which greatly reduce their tax burdens. Since call centers are service operations, favorable sourcing rules (which source service income to the location where the benefits are received rather than taxing everything in-state) and the lack of a throwback rule (which taxes income earned in other states but not subject to those states’ taxes) can also be extremely important for such firms.
The following table shows the five highest and lowest tax cost states for mature call centers:
| The Five Lowest Tax Cost States | The Five Highest Tax Cost States |
|---|---|
| 1. California (11.4%) | 46. Connecticut (26.9%) |
| 2. Georgia (12.0%) | 47. Illinois (26.9%) |
| 3. Arizona (12.1%) | 48. Massachusetts (28.0%) |
| 4. Nebraska (12.5%) | 49. Rhode Island (30.7%) |
| 5. South Dakota (12.8%) | 50. New Jersey (35.4%) |
To read the full report, click here.
For the rest of the maps in this series, click the following links: Corporate Headquarters, Capital and Labor-Intensive Manufacturing, Research and Development Facilities, Distribution Centers, Retail Stores
(note: links will be updated throughout the week as new maps are posted)
Share this article