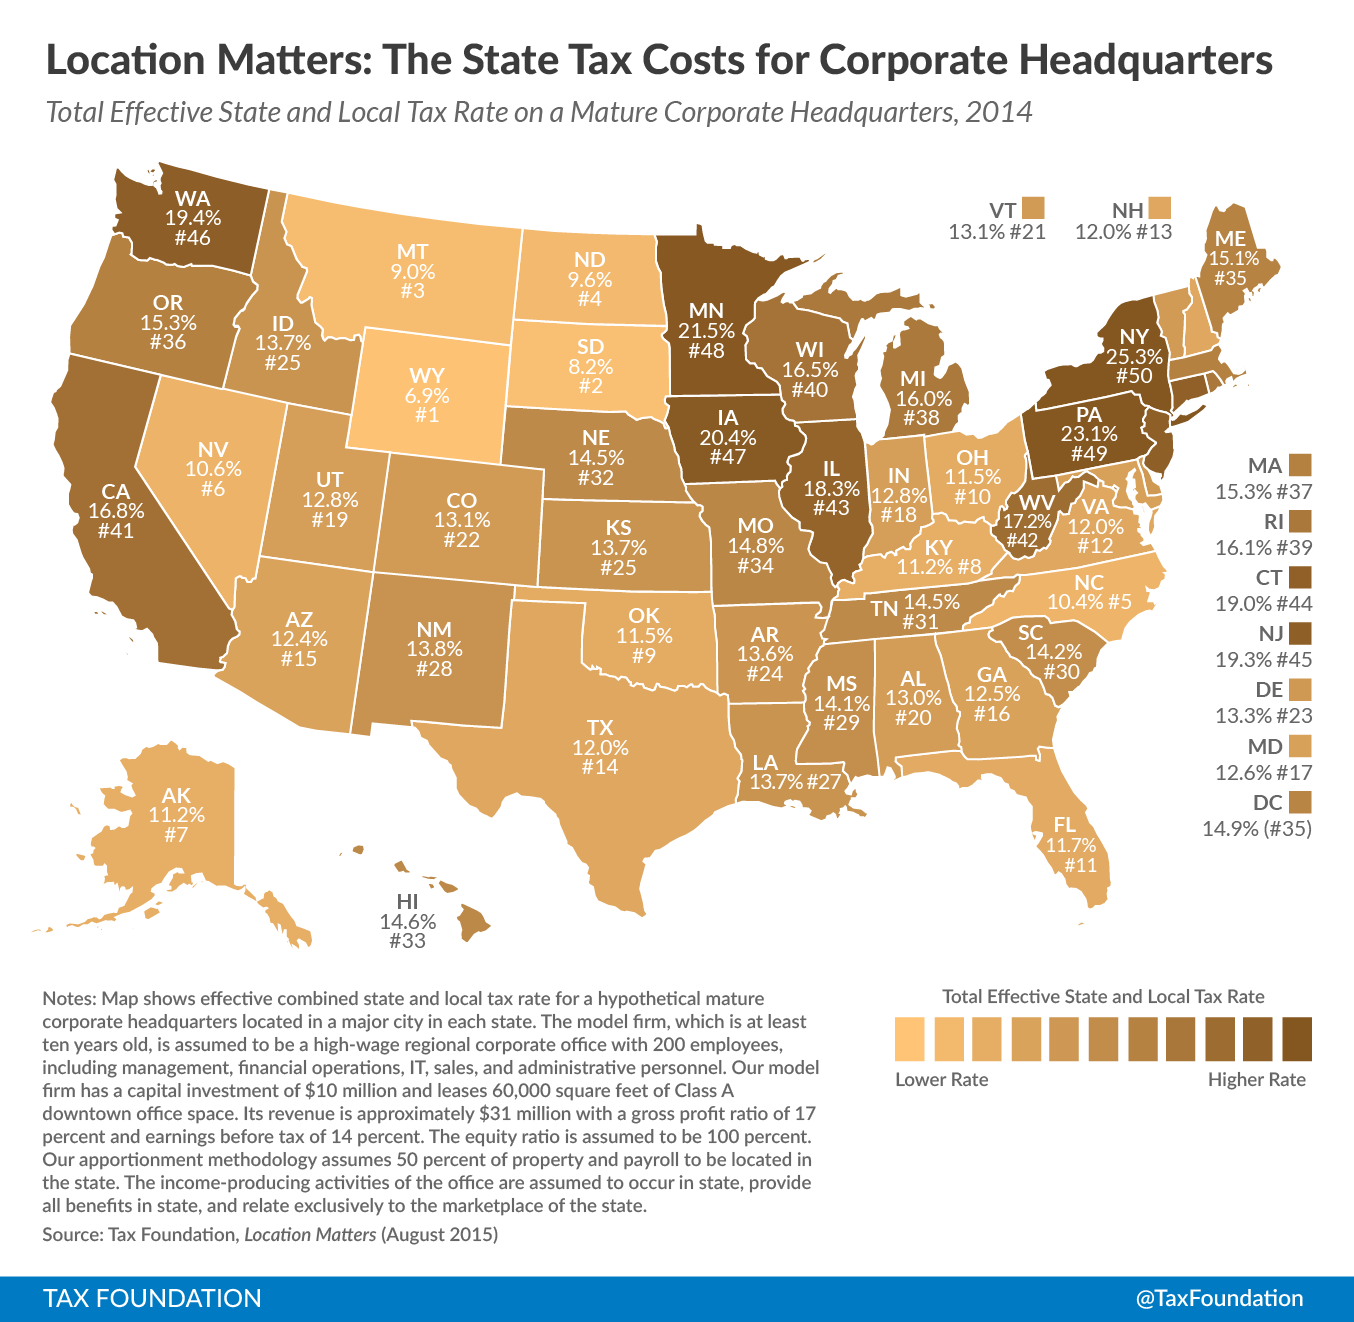
When the Connecticut legislature passed a budget increasing the burden of the state’s already high corporate taxes earlier this year, major employers like General Electric initiated a very public search for a new home. Taxes are but one of many factors companies weigh while making location decisions—a state like New York, for instance, can be a popular place to locate corporate headquarters despite high taxA tax is a mandatory payment or charge collected by local, state, and national governments from individuals or businesses to cover the costs of general government services, goods, and activities. burdens—but in many cases, they can be a very important one.
Last week, we published (in collaboration with the accounting firm KPMG) the second edition of Location Matters, which calculates the tax bills of seven model firms, first as mature firms and then again as new firms more likely to be eligible for state incentives, in all fifty states, allowing for an apples-to-apples comparison of how state taxes fall on distinct business types. The study offers unique insights into how tax burdens can vary from firm to firm, from new to mature, and of course from state to state.
Today we’ll take a look at states’ effective tax rates on new and mature corporate headquarters.

Stay informed on the tax policies impacting you.
Subscribe to get insights from our trusted experts delivered straight to your inbox.
SubscribeMany of the states with the lowest total tax costs for mature corporate headquarters do without one or more of the major taxes, such as a corporate income or sales tax. Wyoming and South Dakota, both of which forego corporate income taxes, offer the lowest effective tax rates for mature corporate headquarters at 6.9 percent and 8.2 percent respectively, and Montana and Alaska, which do without state sales taxes, are also very competitive at 9.0 and 11.2 percent. A highly competitive business tax structure and favorable legal and regulatory environment combine to make Wyoming one of the most popular states in which to incorporate. Conversely, high statutory corporate tax rates are responsible for the preponderance of the tax burdens experienced by these firms; six of the 10 highest tax cost states for mature corporate headquarters have statutory tax rates above 8.5 percent, led by Iowa’s 12 percent top marginal rate.
The majority of the lowest tax burden states for new corporate headquarters offer generous tax incentive programs to minimize these firms’ tax burdens. Seven of the 10 states with the lowest tax costs for new corporate headquarters offer generous withholding tax credits that greatly reduce the corporate income taxA corporate income tax (CIT) is levied by federal and state governments on business profits. Many companies are not subject to the CIT because they are taxed as pass-through businesses, with income reportable under the individual income tax. burden for these operations, and states with the six largest withholdingWithholding is the income an employer takes out of an employee’s paycheck and remits to the federal, state, and/or local government. It is calculated based on the amount of income earned, the taxpayer’s filing status, the number of allowances claimed, and any additional amount the employee requests. tax rebates are all among the ten lowest tax cost states for new corporate headquarters. Conversely, high tax cost states for new firms tend to combine high tax rates with few incentives programs.
Unemployment insurance taxes tend to comprise a relatively modest share of the overall tax burden for high-wage firms like a regional corporate headquarters, while sales and property tax burdens can account for a substantial share of firms’ total liability, especially for new firms receiving generous income tax incentives.
The following table shows the five highest and the five lowest tax cost states, expressed in terms of total effective tax rate for mature corporate headquarters:
| The Five Lowest Tax Cost States | The Five Highest Tax Cost States |
|---|---|
| 1. Wyoming (6.9%) | 46. Washington (19.4%) |
| 2. South Dakota (8.2%) | 47. Iowa (20.4%) |
| 3. Montana (9.0%) | 48. Minnesota (21.5%) |
| 4. North Dakota (9.6%) | 49. Pennsylvania (23.1%) |
| 5. North Carolina (10.4%) | 50. New York (25.35%) |
To read the full report, click here.
For the rest of the maps in this series, click the following links: Capital and Labor-Intensive Manufacturing, Call Centers, Research and Development Facilities, Distribution Centers, Retail Stores
(note: links will be updated throughout the week as new maps are posted)
Share this article