Income inequality, and what should or should not be done about it, is one of today’s most hotly contested economic debates. And as such, it’s had a big impact on how the taxA tax is a mandatory payment or charge collected by local, state, and national governments from individuals or businesses to cover the costs of general government services, goods, and activities. policy debate has evolved recently.
Sens. Elizabeth Warren (D-MA) and Bernie Sanders (I-VT), for example, have both released detailed proposals to enact a wealth taxA wealth tax is imposed on an individual’s net wealth, or the market value of their total owned assets minus liabilities. A wealth tax can be narrowly or widely defined, and depending on the definition of wealth, the base for a wealth tax can vary. , what they see as one solution to the inequality question, and an idea that recent polling suggests a majority of Americans support.
But an important question is often left out of this inequality debate: How much is the government already redistributing income through the tax code?
According to a recent Congressional Budget Office (CBO) study titled The Distribution of Household Income, 2016, more than half of American households received more in entitlement benefits than they paid in taxes in 2016.
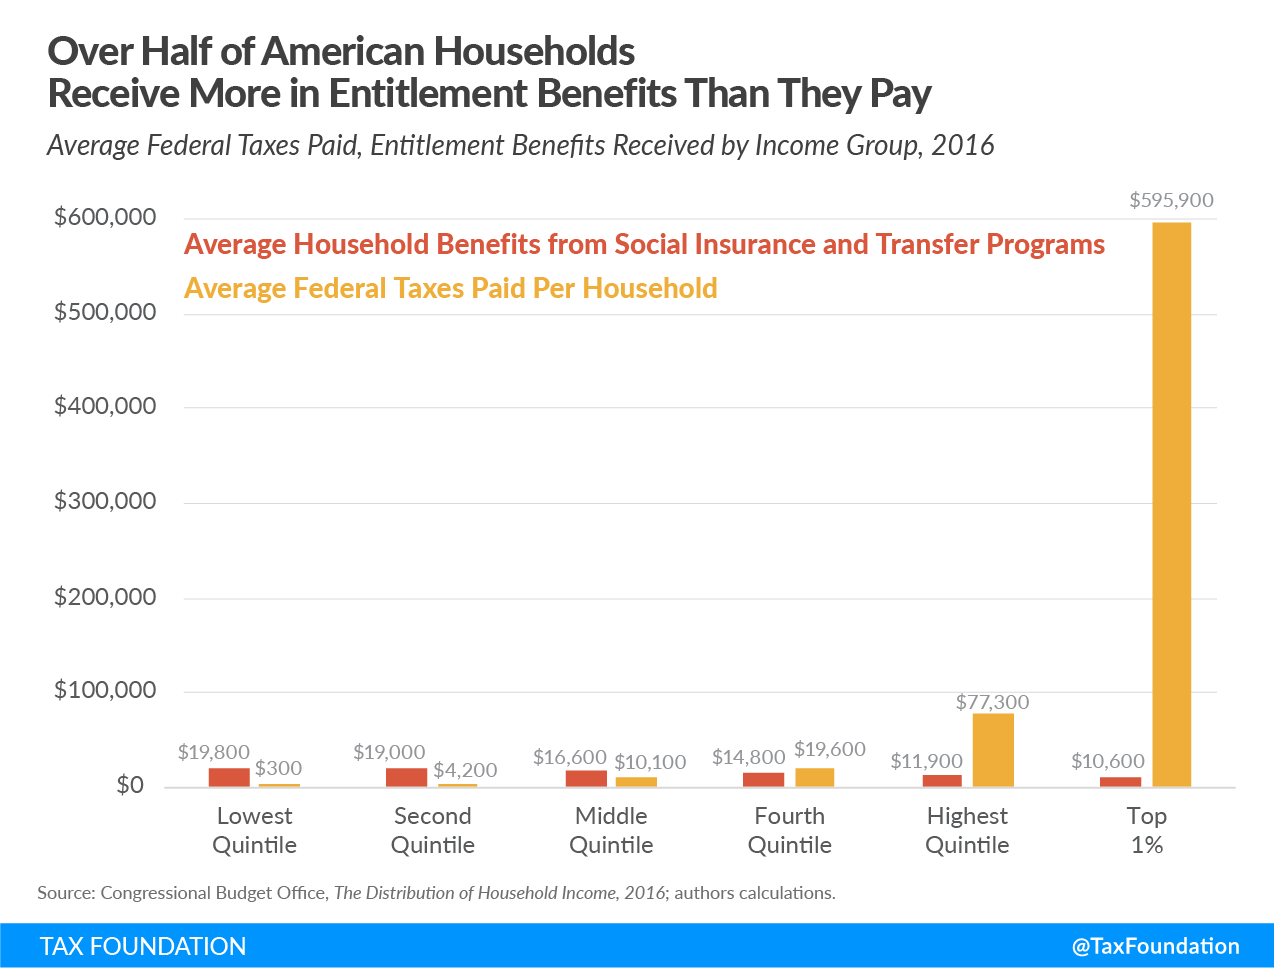
The CBO data shows that households in the poorest income group (couples earning less than $32,500) paid an average of $300 in federal taxes and received nearly $20,000 in social insurance and means-tested entitlement benefits.
In other words, they received $66 in social insurance and transfer benefits for every $1 they paid in federal taxes.
Middle-income households (couples earning $54,800-$81,800) received $1.60 in such benefits for every $1 they paid in federal taxes. Households in the top fifth (couples earning over $126,100) received $0.20 in benefits for every $1 of federal taxes paid.
By contrast, the wealthiest 1 percent of households (couples earning over $546,800) receive just $0.02 in benefits for every $1 of federal taxes they paid.
|
Source: Congressional Budget Office, The Distribution of Household Income, 2016; author’s calculations. |
||||
| Average Household Benefits from Social Insurance and Transfer Programs | Average Federal Taxes Paid per Household | Ratio of Taxes to Social Insurance and Transfers per Household | Gain or Loss in Total Income from Redistribution for Each Income Group (billions) | |
|---|---|---|---|---|
| Lowest Quintile | $19,800 | $300 | $66.0 | $483 |
| Second Quintile | $19,000 | $4,200 | $4.5 | $384 |
| Middle Quintile | $16,600 | $10,100 | $1.6 | $166 |
| Fourth Quintile | $14,800 | $19,600 | $0.8 | -$120 |
| Highest Quintile | $11,900 | $77,300 | $0.2 | -$1,628 |
| Top 1% | $10,600 | $595,900 | $0.02 | -$702 |
To put this in perspective, the typical household in the top 1 percent earned an average of $1.7 million but paid an average of $595,900 in total federal taxes in 2016, cutting their pretax income by one-third.
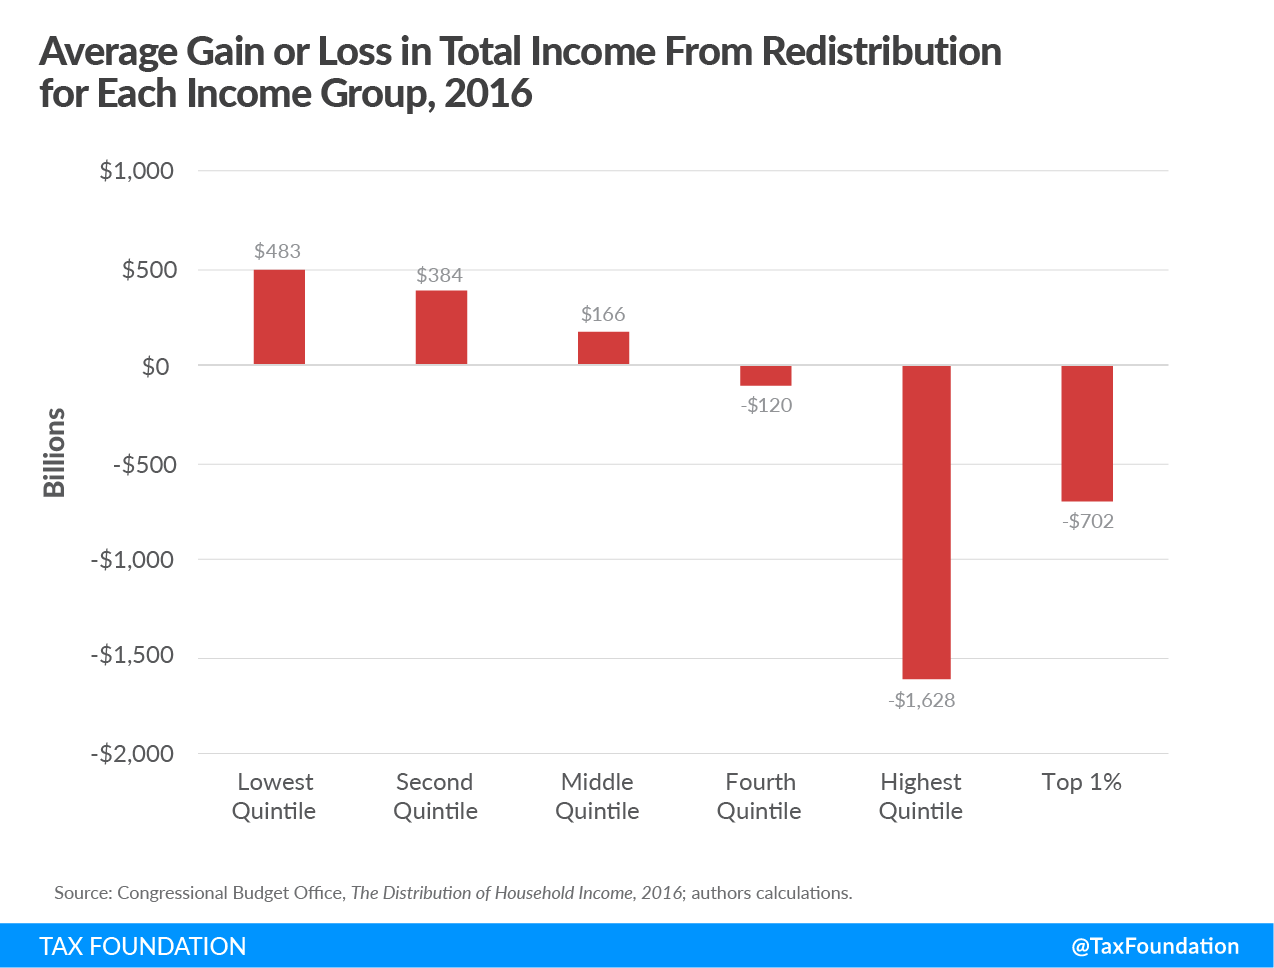
If we total these household results, we find that redistribution increased the incomes of the bottom 60 percent of households by more than $1.03 trillion, with the poorest income groups receiving the most.
By contrast, redistribution policies lowered the incomes of families in the top 40 percent of American households by nearly $1.75 trillion, taking more than $700 billion from the richest 1 percent alone.
This stands to reason—redistributive tax policies are designed to have just this effect—but it does raise another question: If the goal is to make every American household truly equal (at least in terms of income), how much more redistribution would it take?
Let’s do a thought experiment.
In 2016, the average household income after accounting for taxes and entitlement benefits was $89,000. So, in order to equalize incomes across the board, we’d have to raise taxes on households with incomes above $89,000 and use those proceeds to provide additional cash or entitlement benefits to households whose incomes remain below $89,000.
To bring “high-income” households down to the average of $89,000, we’d have to raise their taxes by an additional $3.2 trillion—$1.3 trillion of that taxed from the top 1 percent alone.
To bring “low-income” households up to $89,000, we would then have to give them an additional $3 trillion worth of cash or entitlement benefits to bring their incomes up to the average.
When we add these figures to the existing amount of redistribution, it turns out that making everyone equal would require taking nearly $5 trillion from upper-income households and giving it to lower- and middle-income households.
This would require reducing the income of the top 1 percent alone by 95 percent, or roughly $2 trillion.
I think this thought experiment is useful not because it mirrors any specific policy proposals, but because it illustrates the sheer magnitude of redistribution that already occurs, the even more extreme redistribution that true income equality would necessitate, and the absurdity of achieving all that through the tax code alone.
A more realistic and sustainable way to improve the lives of low- and middle-income Americans through the tax code would be to focus on policies that promote economic growth, create jobs, and boost real wages.
Stay informed on the tax policies impacting you.
Subscribe to get insights from our trusted experts delivered straight to your inbox.
Subscribe