In 2020 and 2021, Congress enacted three rounds of economic impact payments (EIPs) for direct relief to households amidst the pandemic-induced downturn. Survey data from the U.S. Census Bureau indicates that households increasingly saved their EIPs or used them to pay down debt rather than spend them. While the data indicates that debt and saving became more common uses of payments in later rounds, the largest share of households reported using their payments for necessities like food and other living expenses.
About 90 percent of taxA tax is a mandatory payment or charge collected by local, state, and national governments from individuals or businesses to cover the costs of general government services, goods, and activities. filers and millions of non-filers qualified for the three rounds of EIPs, administered by the Internal Revenue Service (IRS) and costing about $867 billion in total according to the Joint Committee on Taxation (JCT). Most payments have been sent out—the Committee for a Responsible Federal Budget has tracked that $811 billion of direct payments has been disbursed. The IRS is in the process of sending out the third round of payments. Some people may not get their full payments until they file their tax return. The IRS provides certain tools, such as the Get My Payment tool, for assistance.
| Total Estimated Cost | Maximum payment per filer | Maximum payment per qualifying dependent | Share of filers with a rebate | |
|---|---|---|---|---|
| Round 1, March 2020, CARES Act | $292 billion | $1,200 single/$2,400 joint | $500 | 93.6% |
| Round 2, December 2020, Consolidated Appropriations Act | $164 billion | $600 single/$1,200 joint | $600 | 91.4% |
| Round 3, March 2021, American Rescue Plan Act | $411 billion | $1,400 single/$2,800 joint | $1,400 | 89.0% |
|
Note: Share of filers with a rebate excludes non-filers who qualified for rebates. Source: Joint Committee on Taxation revenue estimates, Tax Foundation General Equilibrium Model, Tax Foundation. |
||||
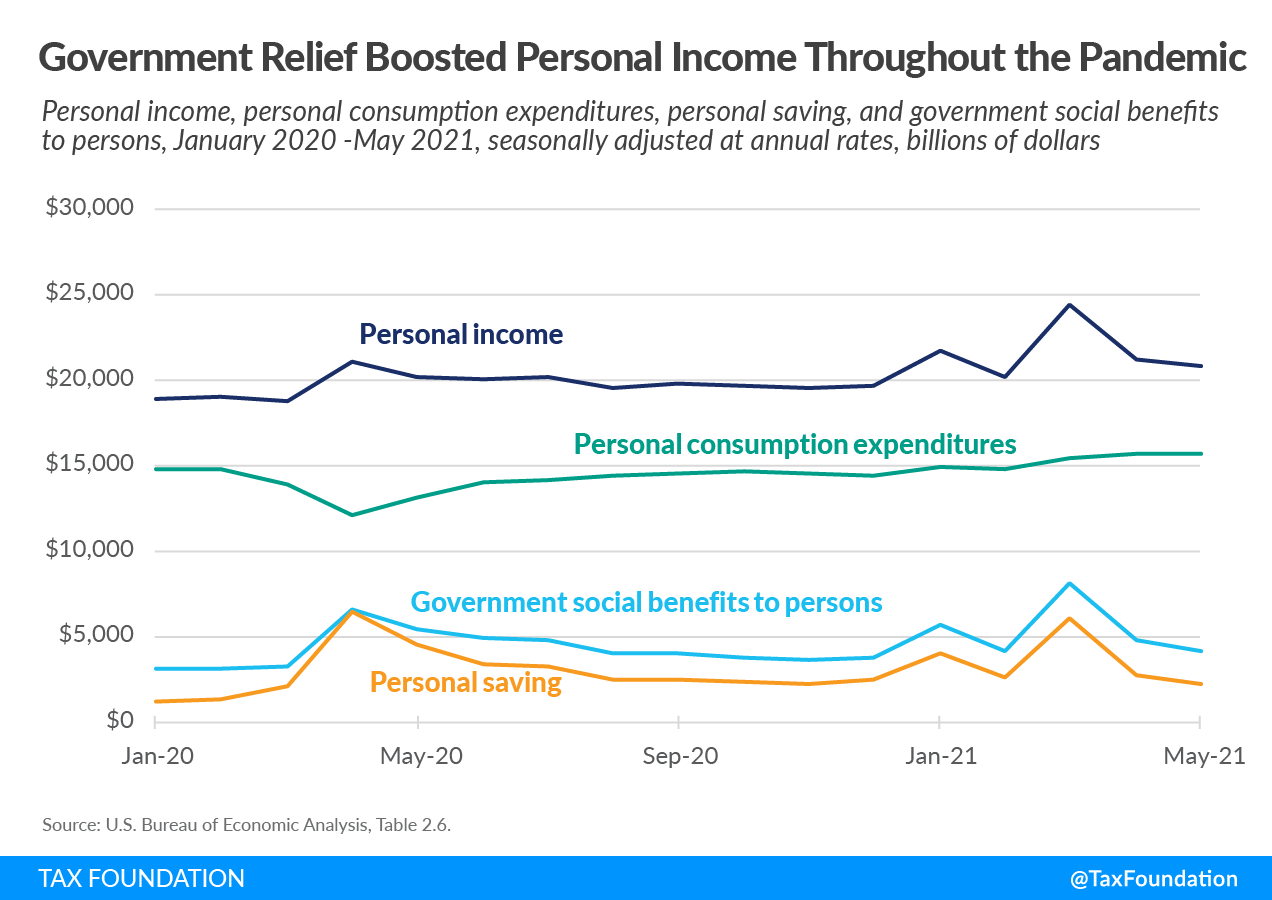
Overall, the $867 billion in direct payments, combined with the trillions of additional relief dollars enacted by Congress, prevented a drop in and actually increased personal income during the economic downturn.
The following chart illustrates how overall measures of personal income, personal consumption expenditures, personal saving, and government social benefits to persons changed from January 2020 through May 2021. Note that the amounts are shown in seasonally adjusted annual rates. From the U.S. Bureau of Economic Analysis (BEA) data, it appears that the EIPs, which began to hit bank accounts in April 2020, helped reduce a drop in consumption and may have amplified the increase in saving. In the time between rounds of economic relief, consumption and saving started returning to trend, but saving continued to jump by more and remain above trend with subsequent rounds of relief. Data from a household survey conducted by the Census Bureau largely align with the aggregate data from the BEA and can help inform how households used, or planned to use, their direct payments.
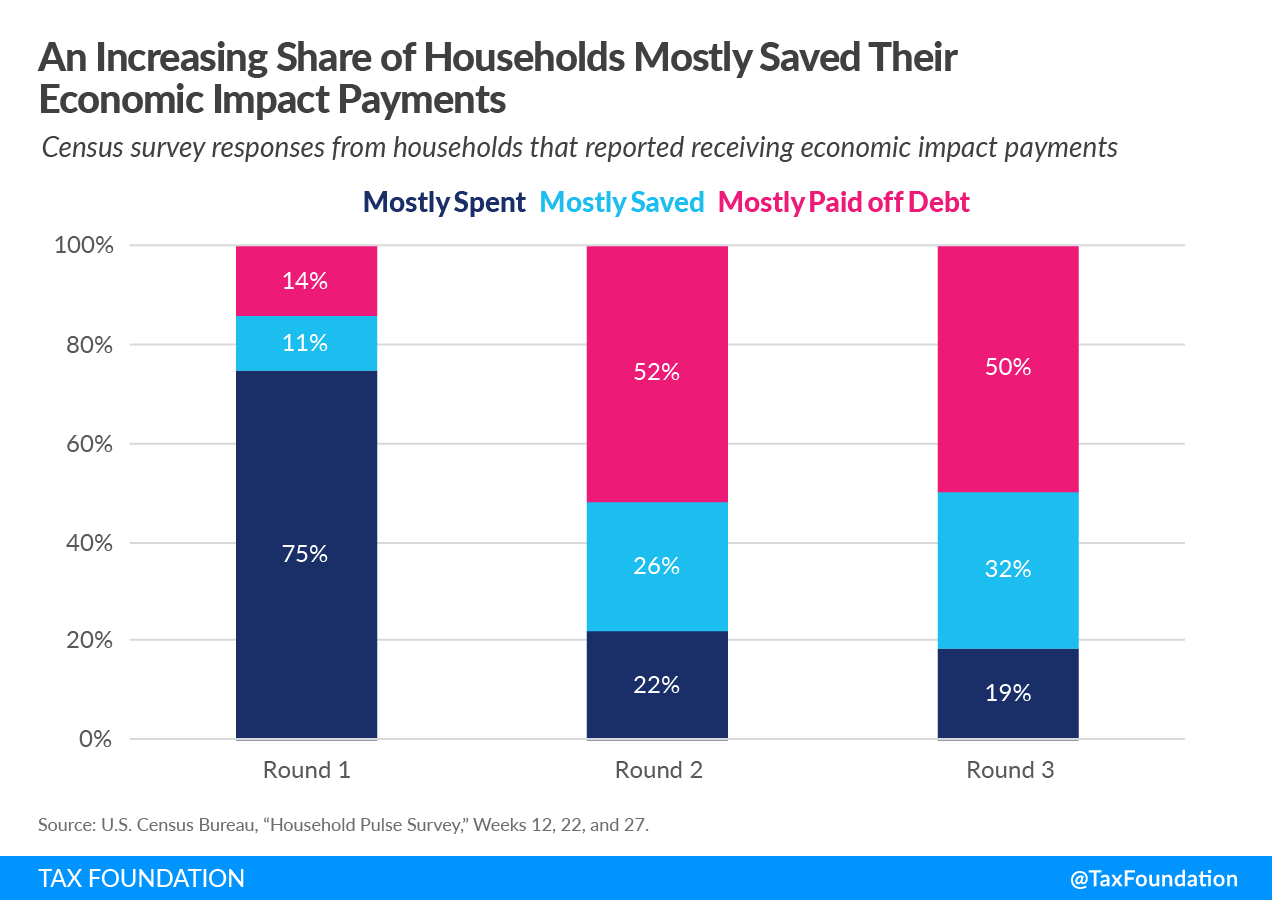
According to the household survey, a larger share of the first round of EIPs went toward spending than the second and third rounds. Of the households that reported receiving the first round of payments, 75 percent responded that their EIPs would be mostly spent, while just 11 percent responded mostly saved. The share of households mostly saving their payments increased to 26 percent in the second round and 32 percent in the third round, while the share of payments mostly spent decreased.
A growing share of payments was also used by households to pay off debt. Initially, 14 percent of households indicated they would use the first round of payments to pay off debt, a share that grew to 50 percent in the second round and 52 percent in the third round. It should be noted that in the second and third round survey, a significantly larger share of respondents (35 percent) indicated they had not yet received their payments as compared to the first round (15 percent).
While the same pattern of spending more of the first round and saving more of later rounds was true of each income group, some patterns were more pronounced in certain income groups. For example, in the first round of payments, 84 percent of households with less than $50,000 in household income said they spent their payment, compared to 56 percent of households reporting more than $200,000 of income. By round three, 18 percent of lower-income households mostly spent their payments, compared to 20 percent of higher-income households. In the second and third rounds, using the payments to pay off debt was the most common reported use for households making under $200,000.
If a household indicated that it received a stimulus payment, the Census survey would ask respondents to select for what spending category or categories they used (or planned to use) their payment. Across all three rounds, food got the highest number of responses. In the first round, 71 percent of households spent money on food (groceries, eating out, or takeout). That percentage dropped to 48 percent in round 2 and in round 3 but remained the most common use of payments across each round.
Households also commonly reported across that each period that they spent their payments on utilities & telecommunications (natural gas, electricity, cable, internet, cellphone) and household supplies or personal care products.
From the first to the third round, paying down debt and saving payments became increasingly common. For example, in the first round, paying down debt was the seventh most common reported use while saving or investing the ninth most common. By the third round, paying down debt was the second most common reported use and saving or investing the fifth most common.
| Round 1, March 2020, CARES Act | Round 2, December 2020, Consolidated Appropriations Act | Round 3, March 2021, American Rescue Plan |
|---|---|---|
| Food (71%) | Food (48%) | Food (48%) |
| Utilities & Telecommunications (54%) | Utilities & Telecommunications (37%) | Paying Down Credit Card, Student Loans, or Other Debts (38%) |
| Household Supplies or Personal Care Products (53%) | Paying Down Credit Card, Student Loans, or Other Debts (30%) | Utilities & Telecommunications (38%) |
| Rent (30%) | Household Supplies or Personal Care (28%) | Household Supplies or Personal Care Products (31%) |
| Mortgage (26%) | Rent (22%) | Saving or Investment (25%) |
|
Note: Response universe includes all households that received payments; totals add to more than 100 percent because respondents could select multiple spending categories. Source: U.S. Census Bureau, “Household Pulse Survey,” Weeks 12, 22, and 27. |
||
Notably, in all three rounds, recreational goods (sports and fitness equipment, bicycles, toys, games) and charitable donations and giving to family members were the least common uses of payments.
The data suggests that the combination of economic impact payments and other relief programs prevented personal income from dropping even as the economy shrank during the coronavirus pandemic. During the early months of the pandemic, more of the direct relief was used for household spending, especially by lower-income households and on necessities like food and bills, while later rounds of payments were increasingly used for saving or paying down debt.
Stay informed on the tax policies impacting you.
Subscribe to get insights from our trusted experts delivered straight to your inbox.
Subscribe