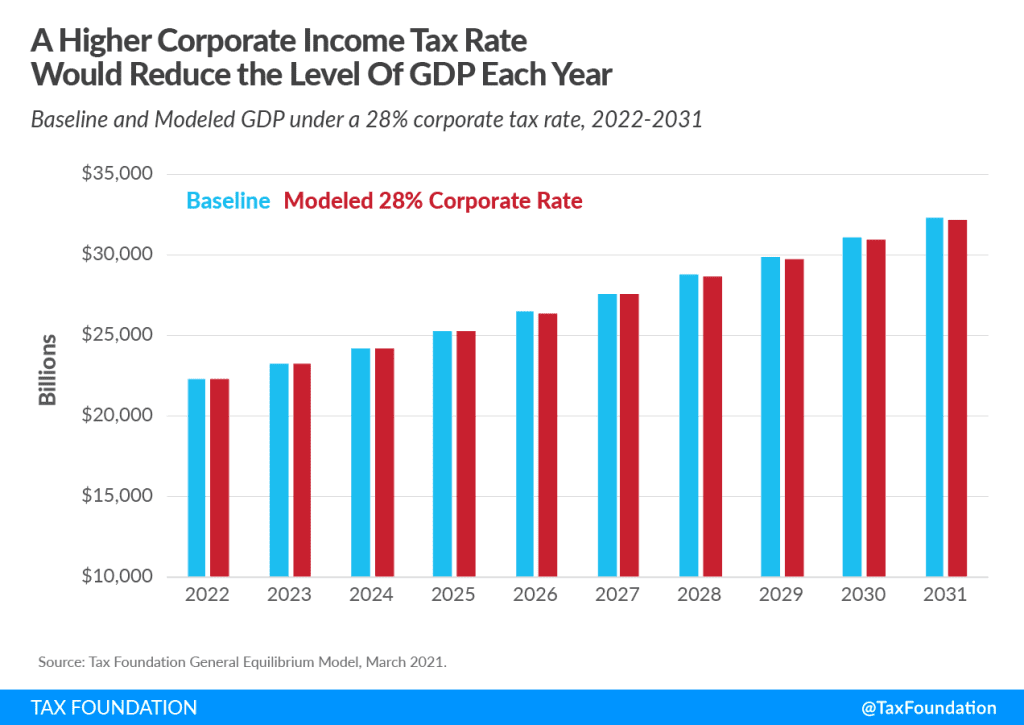
In our new book, Options for Reforming America’s Tax Code 2.0, we illustrate the economic, distributional, and revenue trade-offs of 70 taxA tax is a mandatory payment or charge collected by local, state, and national governments from individuals or businesses to cover the costs of general government services, goods, and activities. changes, including President Biden’s proposal to increase the corporate tax rate to 28 percent from 21 percent today. The Options guide presents the economic effects we estimate would occur in the long term, or 20 to 30 years from now, but we can also use our model to show the cumulative effects of the policy change—providing more context, for instance, about how the effects of a higher corporate income tax rate compound over time, which we estimate would reduce GDP by a cumulative $720 billion over the next 10 years.
Using the Tax Foundation General Equilibrium Model, we estimate the long-run impact of a 28 percent corporate income taxA corporate income tax (CIT) is levied by federal and state governments on business profits. Many companies are not subject to the CIT because they are taxed as pass-through businesses, with income reportable under the individual income tax. rate would be a 0.7 percent reduction in GDP, amounting to about $160 billion (in today’s dollars) of lost output each year. Similarly, the level of American incomes (measured by Gross National Product, GNP), the capital stock, wages, and full-time equivalent employment would also be lower.
| Gross Domestic Product | -0.7% |
| Gross National Product | -0.7% |
| Capital Stock | -1.4% |
| Wage Rate | -0.6% |
| Full-Time Equivalent Jobs | -138,000 |
| Source: Tax Foundation General Equilibrium Model, March 2021. | |
The negative effects of a higher corporate tax rate would build up over several years’ time to reach the estimated long-run equilibrium, starting with a less than 0.05 percent drop in GDP the first year and building to a 0.4 percent drop in the 10th year.
From that 10-year path, we can sum each year’s loss in GDP to arrive at the total accumulated loss in output over the decade, shown in the following figure. For example, in year one, output would be about $8 billion lower; then in year two, output would be another $19 billion lower on top of the $8 billion lost the previous year, resulting in a cumulative loss of about $28 billion. The negative effect continues to build over the following years, adding to a cumulative GDP loss of nearly $720 billion over 10 years.
The $720 billion in lost GDP over 10 years slightly exceeds the estimated $694 billion of tax revenue that would be raised over 10 years after accounting for the smaller economy. For instance, in year 10, the economy would be about $137 billion lower, and the government would raise about $65 billion of revenue—implying about $2.10 of output lost for each dollar of dynamic revenue raised (or about $1.34 using conventional revenue) in the 10th year.
Higher corporate income tax means that companies would take home a smaller share of the returns to a potential investment—taxes take a bigger bite. Some investments on the margin would therefore no longer be worth risking the capital. By raising the cost of capital, a higher corporate income tax reduces investment and economic growth. By reducing capital investment, a higher corporate income tax reduces long-term productivity growth, and lower productivity means lower wages.
For this reason, a significant portion of the economic cost of the corporate income tax falls on workers. We estimate that in the long term, taxpayers in the bottom quintile would see their after-tax incomes drop by 1.5 percent on a dynamic basis. The top quintile would see a 2.0 percent decline, while those in the middle would see a 1.4 percent decline.
Like the decrease in economic output, the declines in after-tax incomeAfter-tax income is the net amount of income available to invest, save, or consume after federal, state, and withholding taxes have been applied—your disposable income. Companies and, to a lesser extent, individuals, make economic decisions in light of how they can best maximize their earnings. would accumulate over time. While the percentage change in after-tax income is the right way to measure tax changes by income group—it creates the most accurate representation of the change in the distribution of the tax burden—we can also look at the average tax change in dollars. On a conventional basis, which does not factor in the negative effect of the corporate tax increase, after-tax income accumulated over 10 years for the bottom quintile would drop by an average of $550 (the decline increases to $740 when factoring in the smaller economy).
| Quintile | AGI cutoffs in 2022 | Conventional Change in After-tax Income, 2022-2031 cumulative total | Dynamic Change in After-tax Income, 2022-2031 cumulative total | Dynamic Percentage Change in After-tax Income, Long-run |
|---|---|---|---|---|
| 0% to 20% | $0 to $19,500 | -$550 | -$740 | -1.5% |
| 20% to 40% | $19,500 to $33,100 | -$1,120 | -$1,630 | -1.3% |
| 40% to 60% | $33,100 to $50,229 | -$2,010 | -$2,840 | -1.4% |
| 60% to 80% | $50,229 to $80,150 | -$3,340 | -$4,630 | -1.3% |
| 80% to 100% | $80,150 and above | -$16,480 | -$19,510 | -2.0% |
| Source: Tax Foundation General Equilibrium Model, March 2021. | ||||
Corporate income taxes are one of the most harmful ways to raise revenue. They place a higher burden on investment, reduce economic output, and reduce after-tax incomes across the income spectrum—negative economic effects that compound over time.
Options for Reforming America’s Tax Code 2.0
Stay informed on the tax policies impacting you.
Subscribe to get insights from our trusted experts delivered straight to your inbox.
Subscribe