Key Findings
-
Joe Biden has proposed an ambitious agenda that would make the federal fiscal system more progressive, and the huge budget deficits caused by the numerous COVID-19 relief packages could heighten the call for more tax revenues. What is needed are benchmark facts to guide these debates.
-
A recent study by the Congressional Budget Office (CBO) fills this void with data showing that the current fiscal system—both taxes and direct spending benefits—is already very progressive and redistributive.
-
In 2017, the federal fiscal system lifted the incomes of households in the lowest quintile by 126 percent, in the second quintile by 46 percent, and in the middle quintile by 10 percent while reducing the incomes of households in the highest quintile by 23 percent and in the top 1 percent by 31 percent.
-
In 2017, households in the lowest quintile received $67.67 in direct federal benefits for every $1 of taxes paid vs. $1.60 for middle-quintile households, while households in the highest quintile received $0.15, and $0.02 for the top 1 percent.
-
In the aggregate, fiscal policy increased the incomes of households in the bottom three quintiles by more than $1 trillion in 2017 and reduced the incomes of households in the highest quintile by more than $1.7 trillion, of which $728 billion came from households in the top 1 percent. Indeed, 2017 was the most progressive year in four decades if judged by how much in inflation-adjusted dollars the fiscal system reduced top incomes and increased low incomes.
Introduction
One issue that is certain to dominate the 2021 debate over taxA tax is a mandatory payment or charge collected by local, state, and national governments from individuals or businesses to cover the costs of general government services, goods, and activities. and spending policy is progressivity. In other words, underlaying every fiscal policy discussion this year will be the question of how much should tax and spending policy increase the burden on high-income households and how much should those policies benefit low-income households?
President Joe Biden has laid out an ambitious policy agenda that includes increased spending on such programs as childcare, infrastructure, health care, and climate change. The Committee for a Responsible Federal Budget estimates that these new programs total more than $10 trillion[1] over the next decade. Biden has proposed to offset this new spending with higher taxes on the wealthy and corporations, which the Tax Foundation estimates would raise $3.3 trillion[2] over the next decade.
Taken together, Biden’s spending and tax plans would clearly make the federal fiscal system more progressive and redistributive by increasing the tax burden on high-income taxpayers and channeling those revenues to households down the income scale.
Another factor which will spark a debate over the progressivity of the federal system is the soaring budget deficits generated by the extraordinary relief measures needed to deal with the COVID-19 pandemic. It is uncertain whether additional relief measures will be needed in 2021, but the question of where to find new tax revenues to reduce the mounting national debt will certainly be a backdrop to those discussions.
What is often missing from these policy decisions is a benchmark for how progressive and redistributive the current federal fiscal system already is—both spending and taxes. A recent study by the Congressional Budget Office, The Distribution of Household Income, 2017,[3] fills this information gap.[4]
The goal of the CBO study is to estimate how much federal fiscal policy—both taxes and direct federal benefits—impacts household incomes. The report provides estimates of how much households in various income groups benefited in 2017 from social insurance programs (such as Social Security and Medicare) as well as means-tested transfer programs (such as Medicaid, SNAP, and Supplemental Security Income), and contrasts these benefits with estimates of how much these households paid in total federal taxes.
As we will see, these policies act to lift the income of many households because they receive more in direct benefits than they pay in total federal taxes, while reducing the income of other households because they pay more in federal taxes than they receive in direct benefits. CBO’s data allows us to measure the impact of these policies on the average household within various income groups and then to aggregate the results to measure how these policies redistribute income between groups of households.
To be sure, households do benefit from other federal programs such as national defense, highways spending, and public education, but CBO does not include the benefits of such programs in this exercise. The study is solely focused on fiscal policy that directly impacts household incomes.
Direct Benefit Programs Lift Average Incomes in First Three Quintiles
Table 1 illustrates, from left to right, how direct benefit programs and federal taxes can either raise market incomes or reduce them. For example, in 2017, households in the lowest quintile had an average market income of $15,900. They received an average of $5,400 in social insurance benefits and $14,900 in means-tested transfers. They paid an average of just $300 in total federal taxes. Netting the taxes paid from the benefits they received added $20,000 to their market income, raising their income to $35,900. Thus, the net impact of federal fiscal policy raised their income by 126 percent.
The story is very similar for households in the second and middle quintiles. After netting their federal taxes paid, direct federal benefit policies raised the incomes of households in the second quintile by 46 percent and the incomes of households in the middle quintile by 10 percent. Naturally, not every household in these income groups benefited equally from these federal benefit programs, but these CBO figures do indicate that, on average, federal programs are doing a great deal to lift the incomes of middle- and lower-income households. Again, these figures do not include the benefits or services that households may receive from other federal spending programs.
| 2017 Income Group | Average Market Income | + Social Insurance Benefits | + Means-Tested Transfers | – Federal Taxes | = Transfers minus taxes | = Income After Transfers and Taxes | Percent of Income Changed by Policies |
|---|---|---|---|---|---|---|---|
| Lowest Quintile | $15,900 | $5,400 | $14,900 | $300 | $20,000 | $35,900 | 126% |
| Second Quintile | $33,800 | $12,700 | $7,100 | $4,300 | $15,500 | $49,300 | 46% |
| Middle Quintile | $61,700 | $13,200 | $3,600 | $10,500 | $6,300 | $68,000 | 10% |
| Fourth Quintile | $100,700 | $12,700 | $1,700 | $20,300 | -$5,900 | $94,800 | -6% |
| Highest Quintile | $298,200 | $11,300 | $900 | $80,600 | -$68,400 | $229,700 | -23% |
| 81st to 90th Decile | $154,000 | $11,500 | $1,000 | $35,200 | -$22,700 | $131,400 | -15% |
| 91st to 95th Decile | $217,800 | $10,900 | $700 | $53,600 | -$42,000 | $175,900 | -19% |
| 96th to 99th Decile | $369,100 | $11,000 | $800 | $100,700 | -$88,900 | $280,200 | -24% |
| Top 1% | $1,950,000 | $11,600 | $1,400 | $619,900 | -$606,900 | $1,343,000 | -31% |
|
Source: Congressional Budget Office, The Distribution of Household Income, 2017, Oct. 2, 2020, www.cbo.gov/publication/56575. |
|||||||
Federal Taxes Reduce Average Incomes in the Top Two Quintiles
The story changes completely for average households in the top two quintiles. On average, they paid considerably more in taxes in 2017 than they received in direct federal benefits. Households in the highest quintile, for example, had an average market income of $298,200. However, they paid $80,600 in total federal taxes which, after netting out their average direct benefits, reduced their income by $68,400, or 23 percent.
At the very top end of the income scale, the story is even more dramatic. Households in the top 1 percent paid an average of $606,900 more in federal taxes than they received in direct benefits. This reduced their average incomes by 31 percent, to $1.343 million from $1.950 million. While there is a common public belief that the rich don’t pay their fair share, these figures indicate that federal policy is quite progressive by reducing the incomes of the top 1 percent of households by nearly one-third.
Calculating the Ratio of Direct Benefits Received to Total Taxes Paid
Another way to understand how much households receive in direct federal benefits compared to how much they pay in total federal taxes is to create a ratio. In other words, we can calculate how much in direct federal benefits do they receive for every $1 in total federal taxes paid.
Table 2 further illustrates the very progressive nature of the federal fiscal system—both spending and taxes. For example, in 2017, we can see that households in the lowest quintile received $67.67 in direct federal benefits for every $1 they paid in federal taxes. Households in the second quintile received $4.60 in benefits for every $1 of taxes they paid, while households in the middle quintile received $1.60 in total direct benefits for every $1 of taxes they paid.
The latter result may be the most notable since so much policy has been aimed at helping the middle class over the past few decades. It would appear that these policies have worked to both lessen their tax burden while delivering direct benefits to them.
The ratios get much smaller as we move up the income scale. In 2017, households in the fourth quintile received $0.71 in direct federal benefits for every $1 they paid in taxes while households in the highest quintile received just $0.15 in direct federal benefits for every $1 they paid in federal taxes. For households in the top 1 percent, their return on every $1 of federal taxes paid was just $0.02. Again, this demonstrates how progressive tax and spending policies are supposed to work.
| 2017 Income Group | Ratio: Direct Benefits Received to Taxes Paid |
|---|---|
| Lowest Quintile | $67.67 |
| Second Quintile | $4.60 |
| Middle Quintile | $1.60 |
| Fourth Quintile | $0.71 |
| Highest Quintile | $0.15 |
| 81st to 90th Decile | $0.36 |
| 91st to 95th Decile | $0.22 |
| 96th to 99th Decile | $0.12 |
| Top 1% | $0.02 |
|
Source: Congressional Budget Office, The Distribution of Household Income, 2017, Oct. 2, 2020, www.cbo.gov/publication/56575. |
|
Individual Results Add Up
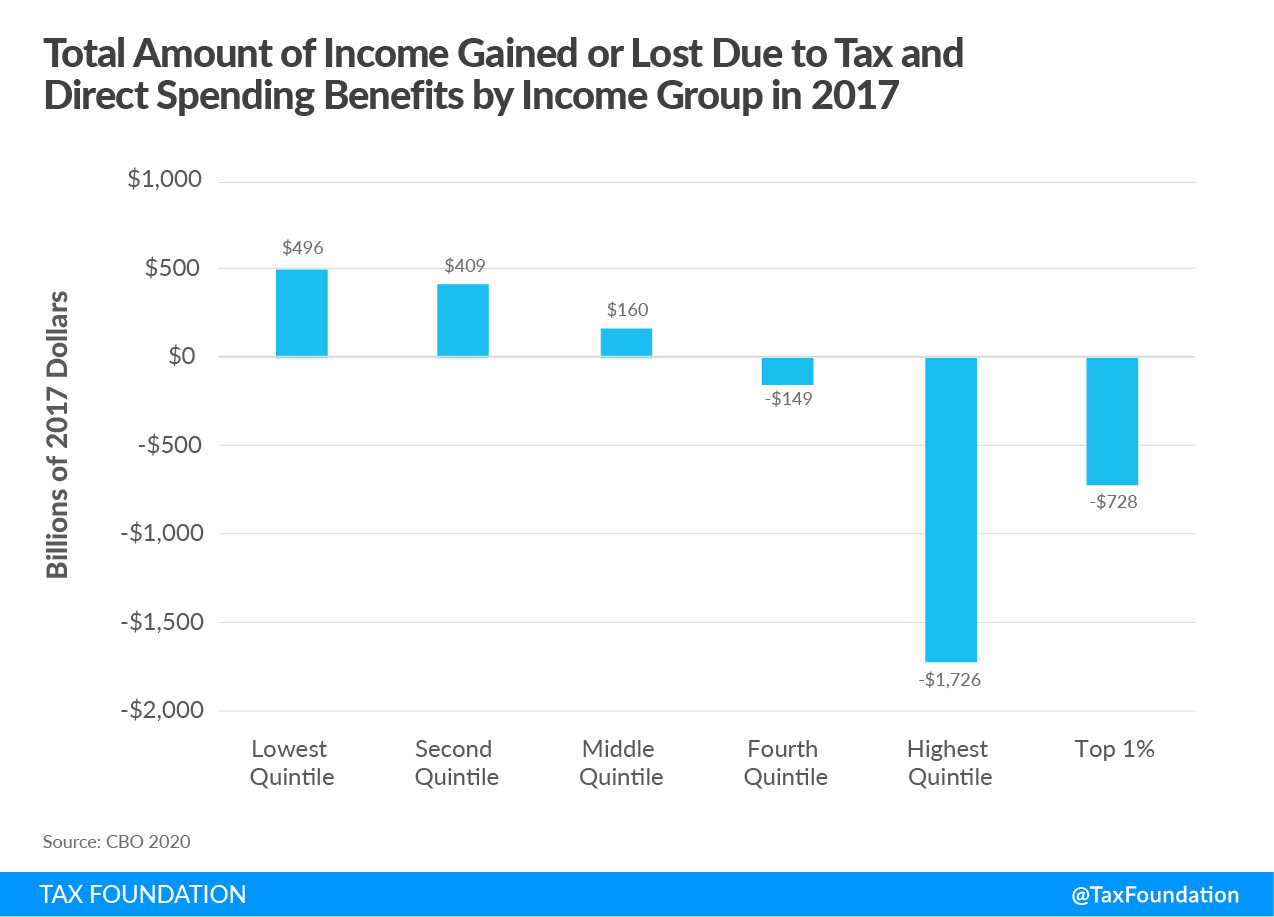
According to the CBO report, each quintile has roughly 25 million households, which means that these average results for households can add up to billions of dollars in income gains or losses for these larger income groups. Figure 1 shows the total amount of income gained or lost due to tax and direct federal spending policies for the five quintiles plus the top 1 percent of households.
Aggregating the individual results, we can see that federal fiscal policy increased the overall income for households in lowest quintile by nearly $500 billion in 2017. Households in the second quintile gained over $400 billion in income while households in the middle quintile gained $160 billion in income. Combined, the first three quintiles gained more than $1 trillion in income thanks to direct federal spending policies, even after netting out the federal taxes paid by these households. In the aggregate, these programs appear to have accomplished what they are intended to do.
On the other end of the income scale, we can see that the progressive federal tax code did what it is intended to do, redistribute income from upper-income households. Overall, fiscal policy reduced the incomes of households in the fourth quintile by nearly $150 billion in 2017. However, this is a fraction of the more than $1.7 trillion that households in the highest quintile saw their incomes drop due to federal fiscal policy. Of this amount, some $728 billion came from households in the top 1 percent alone.
Overall, federal fiscal policy lowered the incomes of the top 40 percent of American households by nearly $1.9 trillion in 2017. Of this, more than $1 trillion was redistributed to lift the incomes of households in the bottom 60 percent of the population, while the remaining $900 billion went to pay for other federal spending.
A Historical Perspective on How Federal Fiscal Policy Has Changed Incomes
The CBO report provides data on household income and taxes from 1979 through 2017 to give us a historical perspective on the changing progressivity of the federal fiscal system—taxes and direct benefits. There are many ways to judge the progressivity of federal tax and spending policy, such as calculating effective tax rates or what CBO calls means-tested transfer rates, all of which indicate an increasingly progressive federal fiscal system. If we measure progressivity by the inflationInflation is when the general price of goods and services increases across the economy, reducing the purchasing power of a currency and the value of certain assets. The same paycheck covers less goods, services, and bills. It is sometimes referred to as a “hidden tax,” as it leaves taxpayers less well-off due to higher costs and “bracket creep,” while increasing the government’s spending power. -adjusted amount by which fiscal policy raises incomes for households in the lowest quintile and lowers incomes for those in the highest quintile, then 2017 was the most progressive year in the past four decades.
Figure 2 paints an interesting picture of the increasing progressivity of the federal tax and direct benefit system since 1979. The CBO adjusted the data series to 2017 dollars to allow for an apples-to-apples comparison over the decades.
The Fiscal System Has Historically Favored Low-Income Households
The first thing to notice, and this should be no surprise, is that since 1979, households in the lowest quintile and the second quintile have received more in direct benefits than they paid in taxes. What is not shown here but is found in Table 7 of the CBO’s supplemental data to the report[5] is that tax policy was a large factor in this trend, especially since the mid-1990s.
Successive expansions of the Earned Income Tax Credit and creation of the Child Tax CreditA tax credit is a provision that reduces a taxpayer’s final tax bill, dollar-for-dollar. A tax credit differs from deductions and exemptions, which reduce taxable income rather than the taxpayer’s tax bill directly. dramatically reduced the income tax liabilities for these low-income households. Indeed, the doubling of the Child Tax Credit to $1,000 from $500 in the 2001 tax bill, combined with making the credit partially refundable, fully eliminated the income tax liability for households in the second quintile and gave them a large tax subsidy.
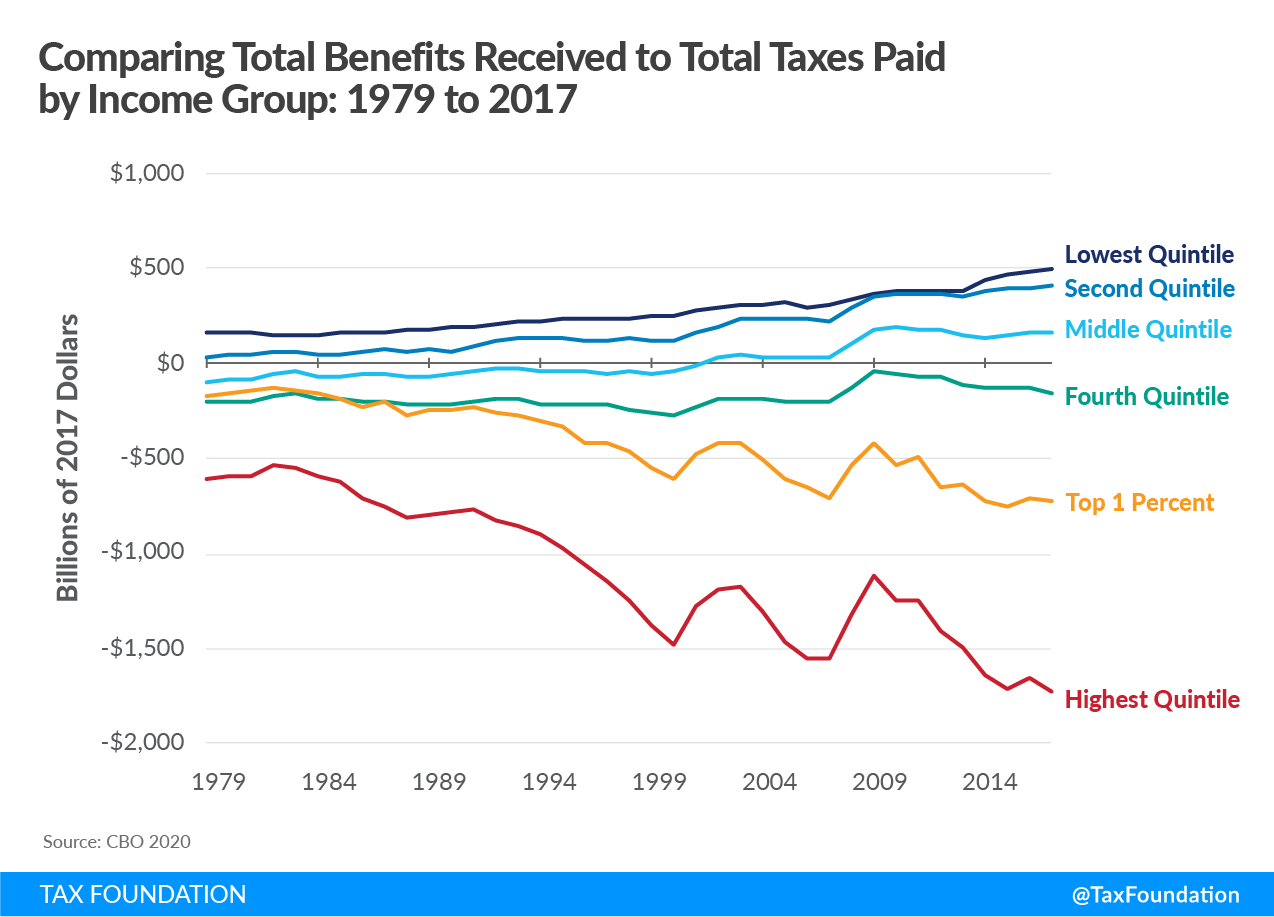
However, the more significant story is the changing fortunes of households in the middle quintile. These households also benefited substantially from the expansion of tax credits, and we can see that beginning in 2002—following the doubling of the Child Tax Credit—they became net beneficiaries from federal fiscal policy rather than net contributors. Thus, the gap between the amount of federal direct benefits the middle quintile received and the federal taxes they paid grew over the succeeding 15 years.
We should also note that the gap has been closing in recent years for the fourth quintile as well, yet another indication that the burden of the fiscal system is resting more and more on households in the highest quintile.
The Burden of the Fiscal System Is Falling More and More on the Highest Quintile
The most obvious trend in Figure 2 is the downward slope representing the increased fiscal burden on households in the highest quintile and, more recently, those in the top 1 percent. In 1979, the fiscal system lowered the aggregate income of households in the highest quintile by $609 billion, in constant 2017 dollars. By 2000, the amount of their reduced earnings had more than doubled to $1.4 trillion, then grew to a historical high of $1.7 trillion by 2017.
The top 1 percent of households has also seen their contributions to the fiscal system climb dramatically over the past four decades. In 1979, the fiscal system reduced their aggregate incomes by $175 billion in 2017 dollars. By 2000, that amount had more than tripled to $602 billion, and grown to $728 billion by 2017.
To be sure, the average incomes of households in the highest quintile have risen substantially more than the incomes of typical households over this time period and so their contributions to the fiscal system appear to have grown proportionately. However, their incomes—especially the incomes of the top 1 percent—have become considerably more volatile since 2000, which poses risks to the fiscal system as it becomes ever more progressive.
Conclusion
The latest Congressional Budget Office figures for 2017 show that the federal fiscal system—both taxes and direct benefits—is very progressive and redistributive. Taxes and spending combined to reduce the incomes of households in the highest quintile by more than $1.7 trillion while increasing the incomes of households in the bottom three quintiles by more than $1 trillion. Households in the lowest quintile received $67.67 in direct benefits for every $1 in federal taxes they paid in 2017, while households in the highest quintile received $0.15 for every $1 in taxes they paid.
The CBO’s findings provide some needed perspective for the upcoming tax and spending debates that will soon dominate 2021. As lawmakers consider Biden’s policy agenda or another round of COVID-19 relief measures, it is also important for them to have benchmark figures on how progressive the tax and federal direct benefit system currently is. Some may argue the system is too progressive while others may say it is not progressive enough. But the CBO’s data clearly shows that the system is doing what a progressive system is intended to do—raise the incomes of the poor and middle class while reducing the incomes of upper-income households.
[1] Committee for a Responsible Federal Budget, “The Cost of the Trump and Biden Campaign Plans,” Oct. 7, 2020, http://www.crfb.org/papers/cost-trump-and-biden-campaign-plans.
[2] Garrett Watson, Huaqun Li, and Taylor LaJoie, “Details and Analysis of President Joe Biden’s Tax Plan,” Tax Foundation, Oct. 22, 2020, https://taxfoundation.org/joe-biden-tax-plan-2020/.
[3] Congressional Budget Office, The Distribution of Household Income, 2017, https://www.cbo.gov/publication/56575.
[4] See also, Garrett Watson, “Congressional Budget Office Releases 2017 Data on Household Income and Tax Burdens,” Tax Foundation, Oct. 7, 2020, https://taxfoundation.org/cbo-household-income-cbo-tax-burdens-2017-data/.
[5] Garrett Watson, “Congressional Budget Office Releases 2017 Data on Household Income and Tax Burdens.”
Share this article