The Organisation for Economic Co-operation and Development (OECD) recently published a report on taxA tax is a mandatory payment or charge collected by local, state, and national governments from individuals or businesses to cover the costs of general government services, goods, and activities. revenue statistics in selected Asian and Pacific countries. The report, covering 24 tax jurisdictions, provides tax revenue data from 1990 to 2019 and includes a section on nontax revenue data for selected Asian and Pacific economies. Additionally, a special feature co-authored by the Asian Development Bank (ADB) and the OECD explores the role of tax policy and administration in mobilizing domestic resources to help developing countries recover after the COVID-19 pandemic and associated economic crisis.
As economies are starting to recover and growth is expected to rebound in the region during 2021, Asian and Pacific countries should start exploring changes to their fiscal tax policies while carefully evaluating the optimal time for eliminating fiscal stimulus and temporary tax relief.
Tax-to-GDP Ratios
Tax revenue as a percent of GDP (tax-to-GDP ratio) varies significantly across the countries covered, with the highest ratio in Nauru (48.2 percent) and the lowest ratio in Bhutan (10.3 percent). While all countries covered, with the exception of Nauru, have a lower tax-to-GDP ratio than the OECD average (33.8 percent), 7 of the countries’ ratios are higher than the Latin America and the Caribbean average (22.9 percent). Additionally, 10 countries have higher tax-to-GDP ratios than the African average (16.6 percent).
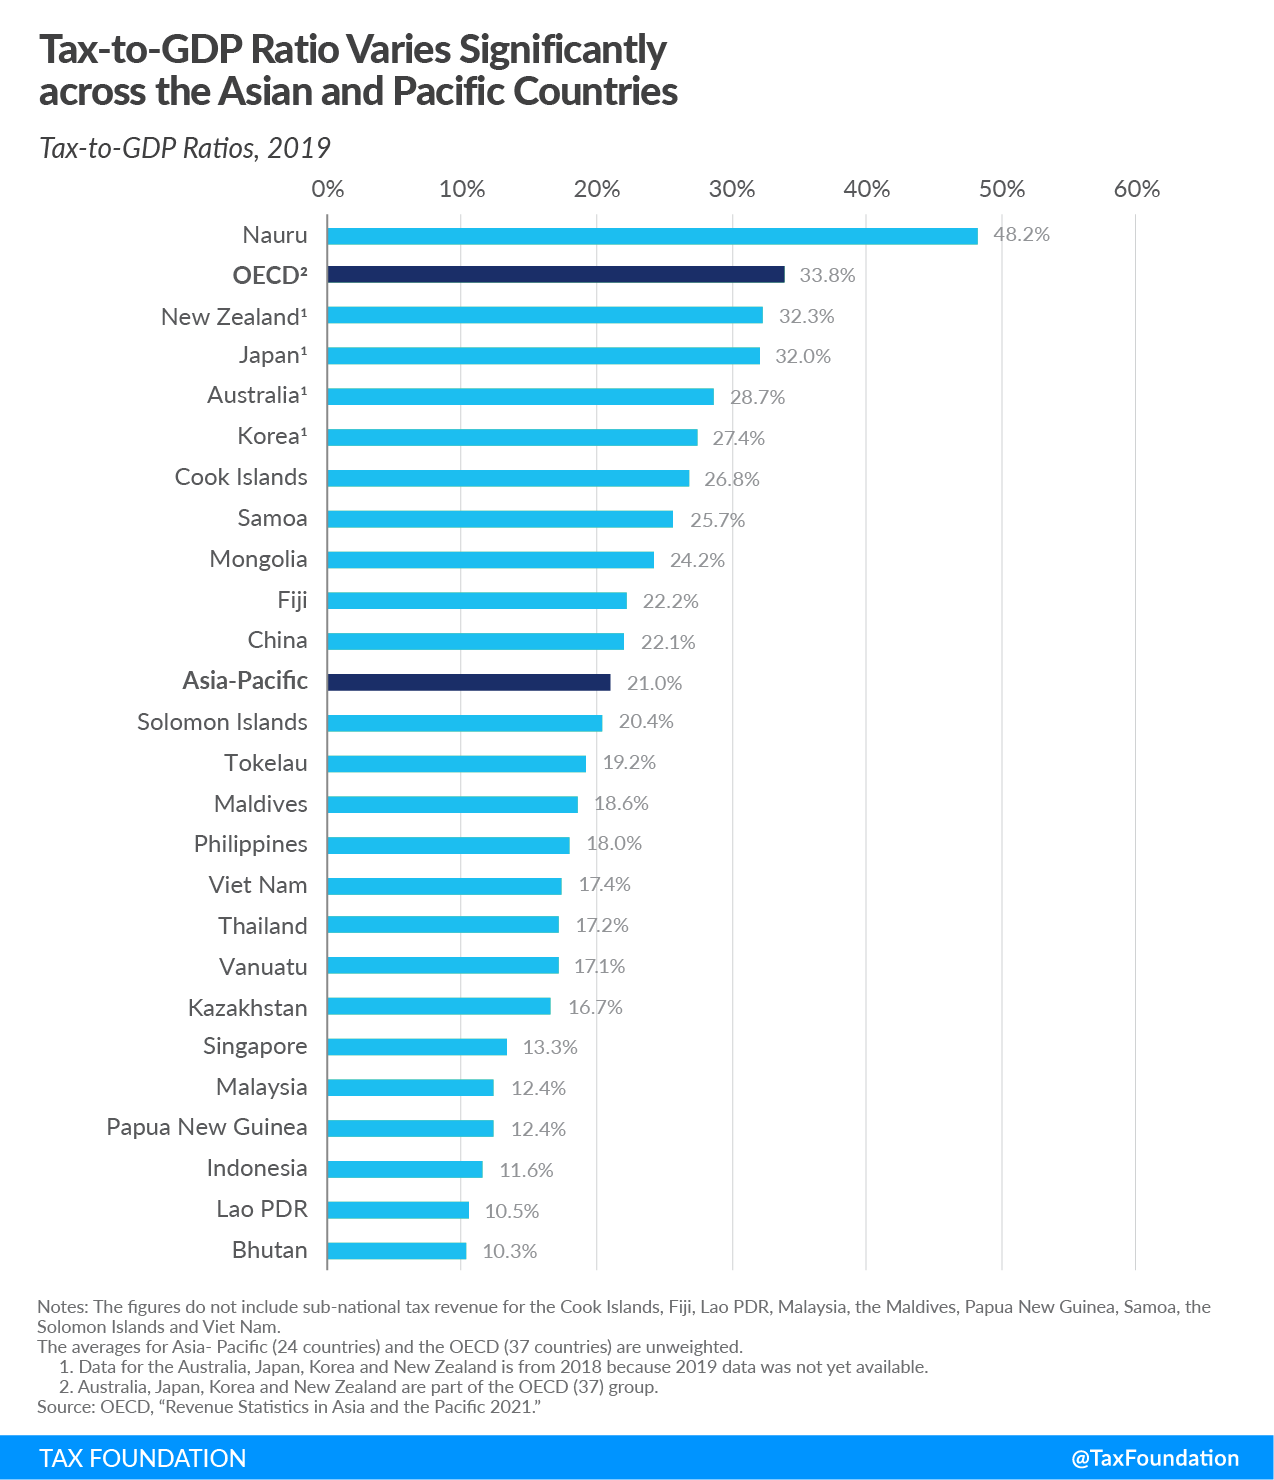
Between 2018 and 2019, tax-to-GDP ratios fell in 15 of the 24 countries. China, Fiji, Samoa, Bhutan, the Cook Islands, and the Solomon Islands registered a reduction of more than 1 percentage-point. In the Solomon Islands, the tax-to-GDP ratio fell by 3.6 percentage-points. Bhutan and the Cook Islands also experienced a significant decrease of 2.3 and 3 percentage-points, respectively, as the 2019 fiscal year included part of the 2020 data, reflecting the early impact of the COVID-19 pandemic on the economy.
Only seven countries experienced increases in their ratios in 2019 relative to 2018. Nauru and Tokelau saw the largest increases in their ratios, at 12.9 percentage-points, and 1.2 percentage-points. For the remaining five countries the increases were less than 1 percentage-point.
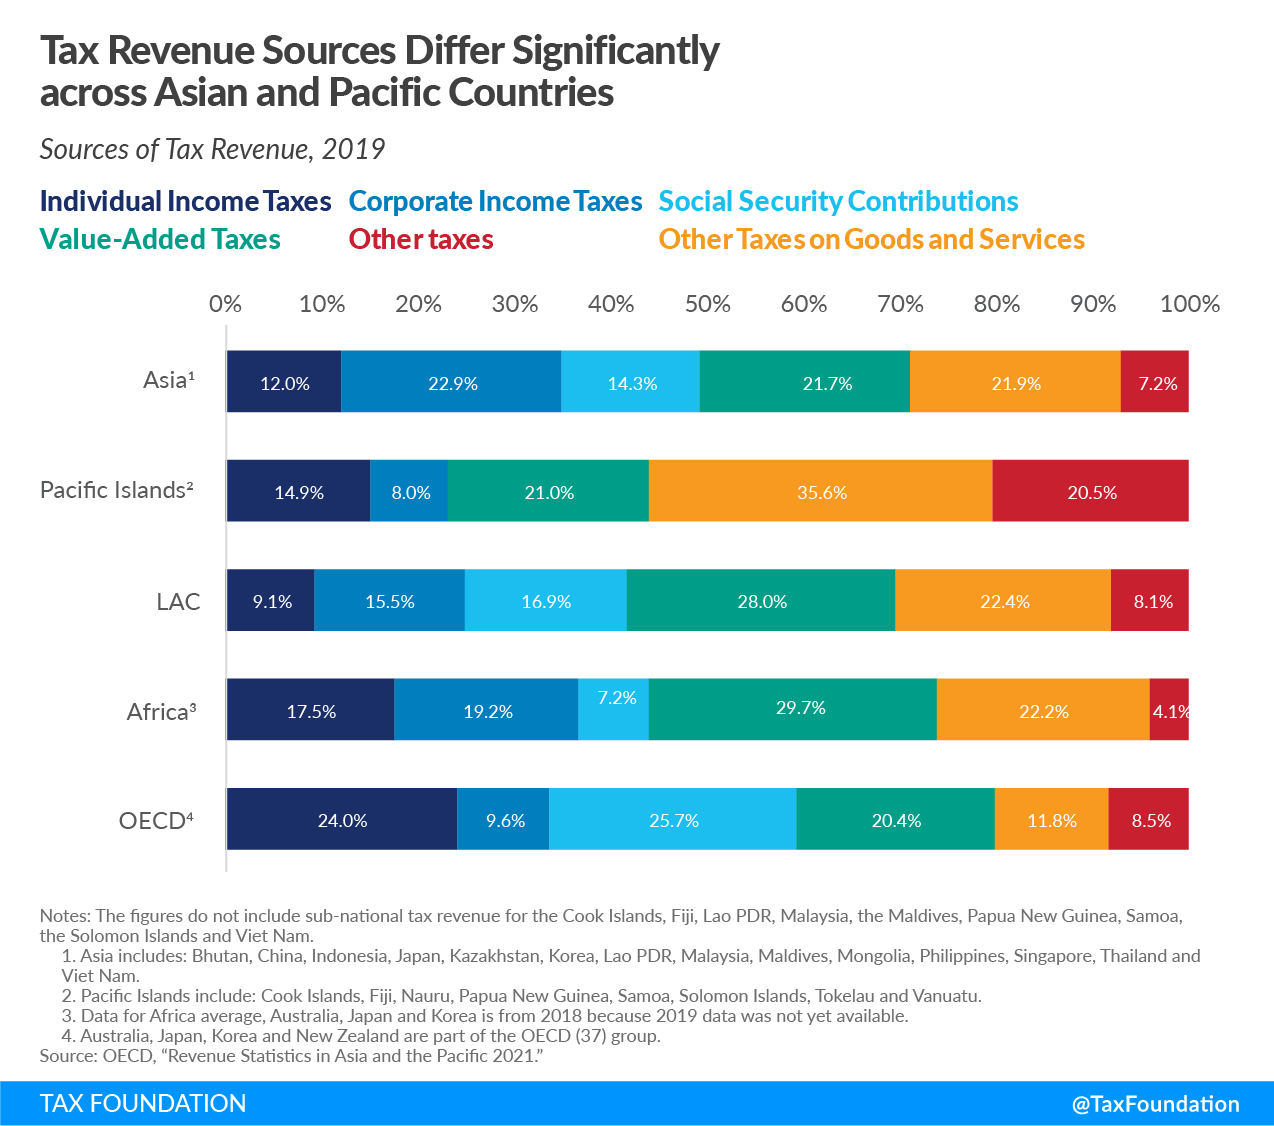
Sources of Tax Revenue
Taxes on goods and services (including value-added taxes and other taxes on goods and services) make up a significant share of total tax revenue in most countries covered. Almost 57 percent of the Pacific Islands’ tax revenue comes from taxes on goods and services, compared to between 32 and 44 percent in the OECD and Asia,.
While OECD countries on average raise a large share of their tax revenue from income taxes and social security contributions, these two types of taxes play a less significant role in Pacific Islands and Asia.
Corporate income taxA corporate income tax (CIT) is levied by federal and state governments on business profits. Many companies are not subject to the CIT because they are taxed as pass-through businesses, with income reportable under the individual income tax. es raise almost 23 percent of total tax revenue in Asia, compared to less than 10 percent in the OECD and 8 percent in the Pacific Islands.
Challenges Ahead
The increase in public debt, due to the fiscal measures adopted to mitigate the impact of the COVID-19 pandemic and the decrease in tax revenues, are putting a strain on Asian-Pacific countries’ public finances. Countries in the Asia-Pacific region face different challenges in their capacity to mobilize domestic revenue depending on the structure of their economy. Additionally, the strong GDP growth that countries in the Asia-Pacific region have faced over the past decades was not accompanied by a similar increase in tax revenues. Therefore, according to the OECD, potential policy measures for the post-pandemic economic recovery should focus on effective tax reforms, reduction of the informal economic activity, digital transformation of tax administration, and active participation in international tax initiatives.
As economies begin to grow again, policymakers should focus on tax reforms that reduce the economic burden of taxation while also raising sufficient revenue. The focus should be on streamlining consumption taxes while minimizing the distortionary effects of taxes on businesses and workers.
| Individual Income Taxes | Corporate Income Taxes | Social Security Contributions | Value-Added Taxes | Other Taxes on Goods and Services | Other Taxes | Total Tax-to-GDP Ratio | |
|---|---|---|---|---|---|---|---|
| Bhutan | 1.3% | 4.8% | 0.0% | 0.0% | 4.2% | 0.0% | 10.3% |
| China | 1.1% | 4.4% | 6.1% | 6.7% | 2.4% | 1.4% | 22.1% |
| Indonesia | 1.1% | 3.7% | 0.5% | 3.3% | 1.5% | 1.5% | 11.6% |
| Japan | 6.1% | 4.1% | 12.9% | 4.1% | 2.1% | 2.7% | 32.0% |
| Kazakhstan | 1.3% | 4.8% | 0.5% | 3.9% | 4.8% | 1.5% | 16.7% |
| Korea | 4.8% | 4.3% | 7.3% | 4.3% | 2.8% | 3.9% | 27.4% |
| Lao PDR | 1.0% | 1.3% | 0.0% | 3.3% | 4.7% | 0.1% | 10.5% |
| Malaysia | 2.6% | 5.6% | 0.3% | 0.0% | 3.2% | 0.8% | 12.4% |
| Maldives | 0.0% | 4.0% | 0.0% | 8.7% | 5.9% | 0.0% | 18.6% |
| Mongolia | 2.4% | 4.5% | 4.8% | 6.7% | 5.3% | 0.6% | 24.2% |
| Philippines | 2.6% | 3.7% | 2.6% | 2.1% | 5.6% | 1.6% | 18.0% |
| Singapore | 2.4% | 3.6% | 0.0% | 2.2% | 1.6% | 3.4% | 13.3% |
| Thailand | 1.8% | 4.4% | 1.0% | 3.5% | 5.9% | 0.6% | 17.2% |
| Viet Nam | 1.8% | 4.5% | 0.0% | 6.0% | 5.1% | 0.0% | 17.4% |
| Asia1 | 2.2% | 4.1% | 2.6% | 3.9% | 3.9% | 1.3% | 18.0% |
| Cook Islands | 5.7% | 3.3% | 0.0% | 13.0% | 4.8% | 0.0% | 26.8% |
| Fiji | 1.7% | 4.3% | 0.0% | 6.8% | 8.8% | 0.7% | 22.2% |
| Nauru | 0.0% | 0.0% | 0.0% | 0.0% | 10.3% | 37.9% | 48.2% |
| Papua New Guinea | 3.8% | 3.4% | 0.0% | 2.3% | 2.9% | 0.1% | 12.4% |
| Samoa | 3.2% | 2.4% | 0.0% | 10.7% | 9.4% | 0.0% | 25.7% |
| Solomon Islands | 4.0% | 1.9% | 0.0% | 0.0% | 14.4% | 0.1% | 20.4% |
| Tokelau | 10.3% | 0.0% | 0.0% | 0.0% | 8.9% | 0.0% | 19.2% |
| Vanuatu | 0.0% | 0.0% | 0.0% | 7.6% | 8.9% | 0.6% | 17.1% |
| Pacific Islands2 | 3.6% | 1.9% | 0.0% | 5.1% | 8.5% | 4.9% | 24.0% |
| Australia | 11.8% | 5.5% | 0.0% | 3.3% | 4.0% | 4.1% | 28.7% |
| New Zealand | 12.8% | 4.0% | 0.0% | 9.8% | 2.7% | 2.9% | 32.3% |
| Average of all countries covered | 3.5% | 3.4% | 1.5% | 4.5% | 5.4% | 2.7% | 21.0% |
| LAC | 2.2% | 3.6% | 3.9% | 6.0% | 5.4% | 1.9% | 22.9% |
| Africa3 | 3.1% | 2.8% | 1.4% | 5.0% | 3.7% | 0.6% | 16.6% |
| OECD4 | 8.1% | 3.1% | 9.0% | 6.8% | 4.1% | 2.7% | 33.9% |
|
Notes: The figures do not include sub-national tax revenue for the Cook Islands, Fiji, Lao PDR, Malaysia, the Maldives, Papua New Guinea, Samoa, the Solomon Islands and Viet Nam. 1. Asia average includes: Bhutan, China, Indonesia, Japan, Kazakhstan, Korea, Lao PDR, Malaysia, Maldives, Mongolia, Philippines, Singapore, Thailand and Viet Nam. 2. Pacific Islands average includes: Cook Islands, Fiji, Nauru, Papua New Guinea, Samoa, Solomon Islands, Tokelau and Vanuatu. 3. 2018 data are used for the Africa average, Australia, Japan, Korea, New Zealand and the OECD average. 4. Australia, Japan, Korea and New Zealand are part of the OECD (37) group. Data for Australia, Japan, Korea, New Zealand and the OECD average are taken from Revenue Statistics 2020 and thus represent 2018 data. Source: OECD, “Revenue Statistics in Asia and the Pacific 2021.” |
|||||||
Stay informed on the tax policies impacting you.
Subscribe to get insights from our trusted experts delivered straight to your inbox.
Subscribe