The Organisation for Co-operation and Economic Development (OECD) has compiled taxA tax is a mandatory payment or charge collected by local, state, and national governments from individuals or businesses to cover the costs of general government services, goods, and activities. revenue data for countries around the world—including 30 African countries, where tax revenue as a percent of GDP is on average lower than in other regions.
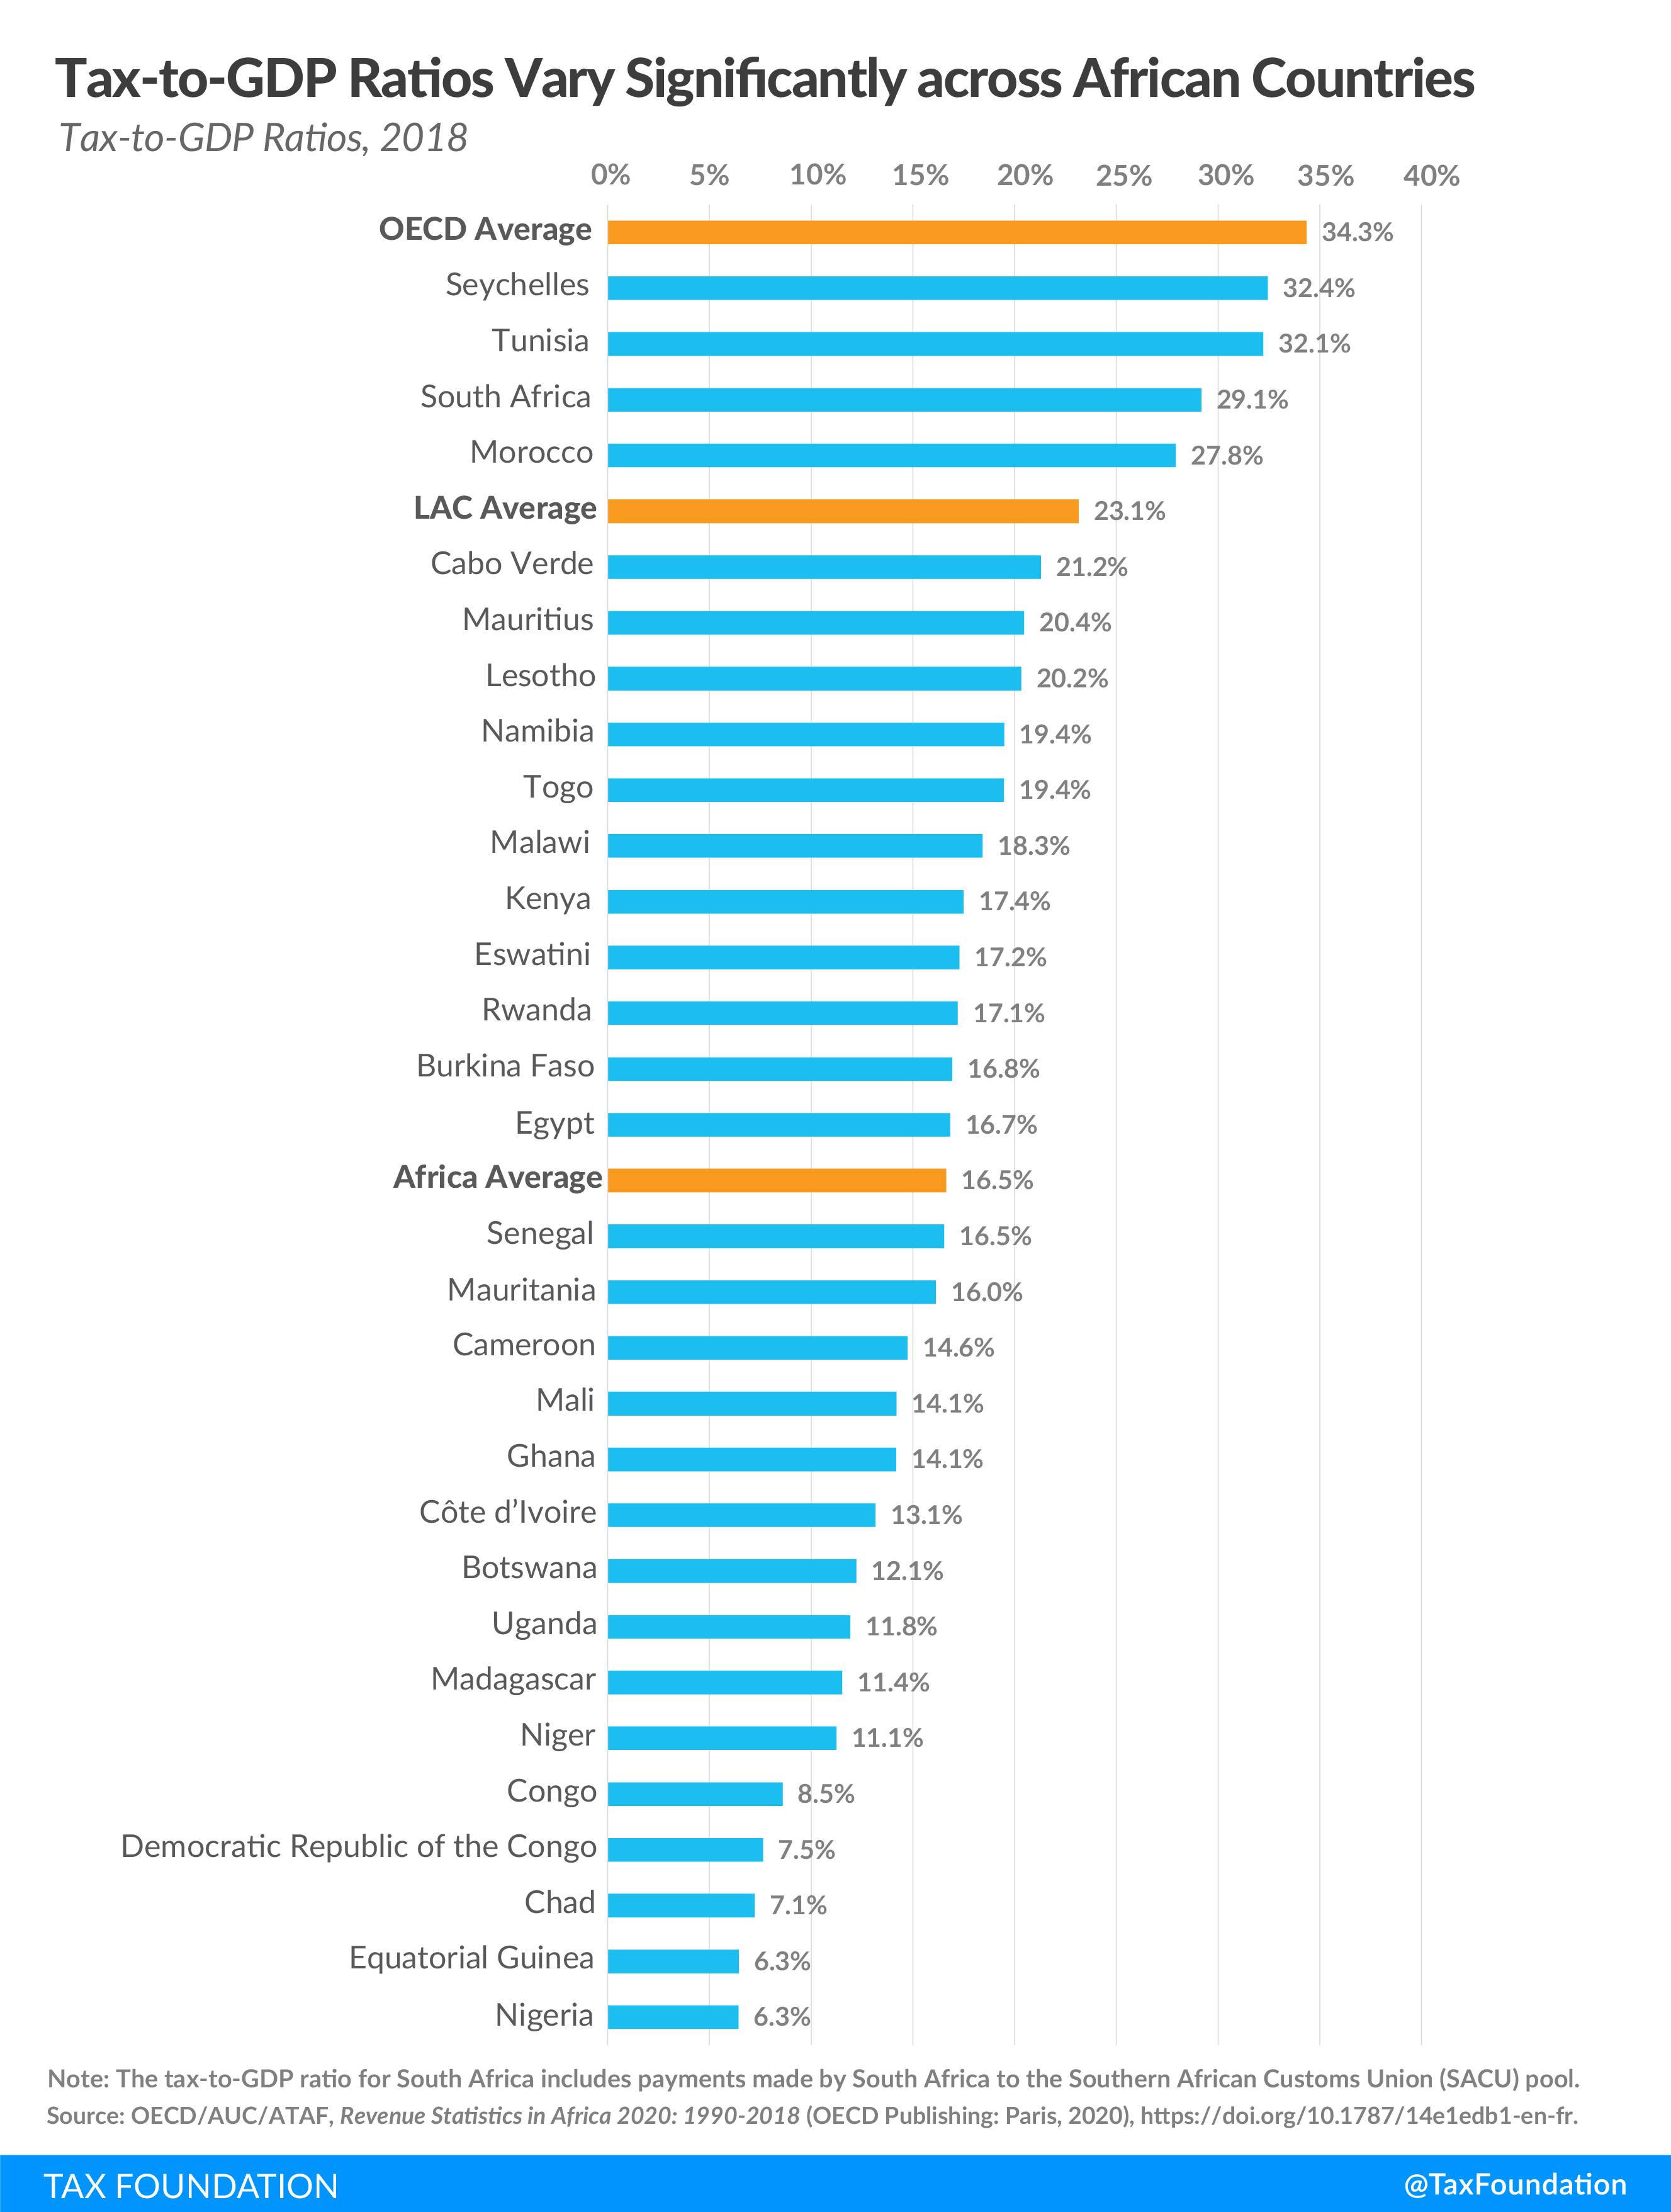
On average, this tax-to-GDP ratio for those 30 countries was 16.5 percent, compared to the OECD average of 34.3 percent and the Latin American and Caribbean (LAC) average of 23.1 percent.
The regional OECD report on tax revenue statistics in Africa covers the years 1990 to 2018, breaking down current tax structures in the region and how they have evolved over time.
Between 2010 and 2018, the average African tax-to-GDP ratio increased by 1.4 percentage points, from 15.1 percent to 16.5 percent, mainly due to revenue increases from value-added taxes (VAT, 1 percentage point) and individual income taxes (0.7 percentage points), while corporate income taxes decreased (by 0.5 percentage points). The average ratio has plateaued at 16.4/16.5 percent since 2014, as increases in some countries offset decreases in others.
Tax-to-GDP ratios vary significantly across African countries, however. In 2018, Seychelles (32.4 percent), Tunisia (32.1 percent), and South Africa (29.1 percent) had the highest tax-to-GDP ratios of the 30 countries covered. Nigeria (6.3 percent), Equatorial Guinea (6.3 percent), Chad (7.1 percent), and the Democratic Republic of the Congo (7.5 percent) had the lowest.
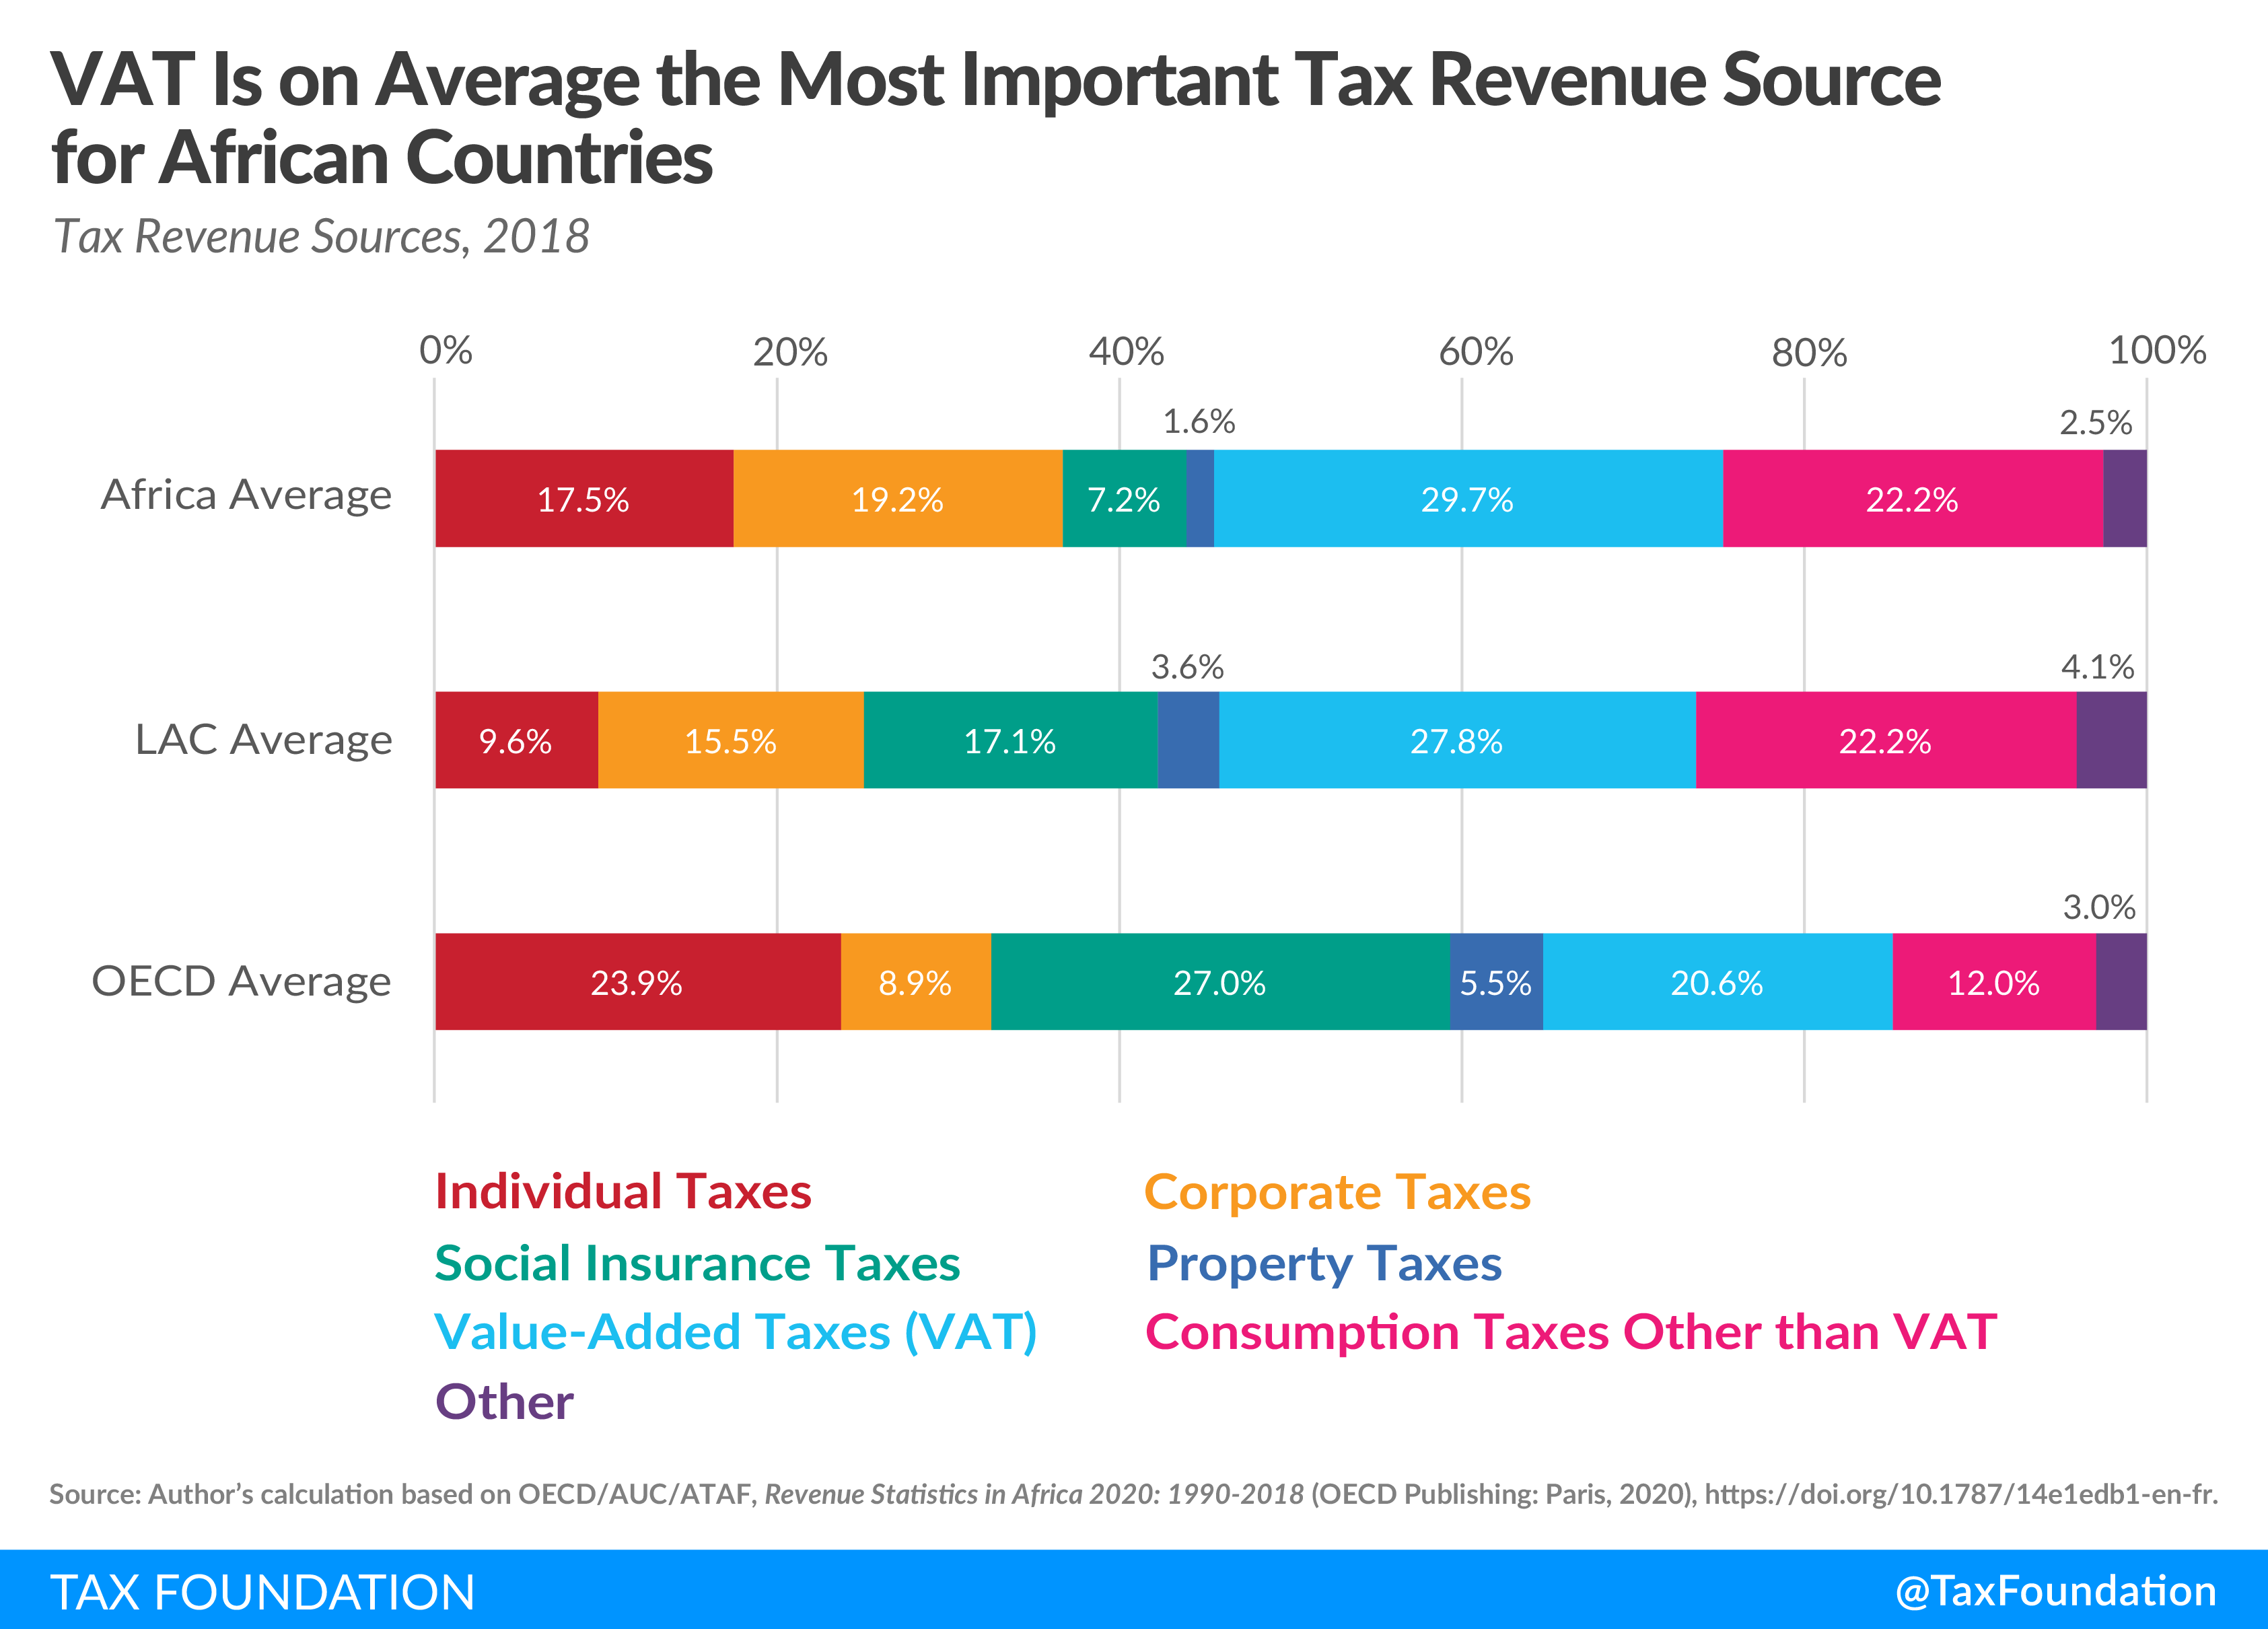
Taxes on goods and services were on average the greatest source of tax revenue for African countries, at 51.9 percent of total tax revenues in 2018. VAT contributed on average 29.7 percent, making it the most important tax on goods and services. Corporate taxes accounted on average for 19.2 percent of all tax revenues, and individual taxes accounted for 17.5 percent. Social insurance taxes and property taxes played less significant roles, at 7.2 percent and 1.6 percent, respectively.
Taxes make more sense with us in your inbox.
Subscribe to our newsletter for tax insights that cut through the noise—and make sense of it.
Sign UpOn average, African countries’ tax structure is relatively similar to that of LAC countries. Notable differences are Africa’s relatively higher reliance on individual taxes and lower reliance on social insurance taxes. The average OECD tax structure differs quite substantially from that of the African average, as African countries tend to rely less on individual taxes, social insurance taxes, and property taxes, and more on corporate taxes and consumption taxes.
Between 2010 and 2018, revenue sources have shifted to VAT (increase of 2.8 percentage points of total taxes) and individual taxes (increase of 2.1 percentage points of total taxes). While the share of individual taxes is still lower than the share of corporate taxes, corporate tax revenue has declined by 2.3 percentage points of total tax revenue during the same time frame. Consumption taxes other than VAT have declined by 2.8 percentage points of total revenues.
The decline in consumption taxes other than VAT in many African countries is partly due to lower trade tax revenues. Trade liberalization across the region has led to reduced import tariffs, a narrower base of goods and services subject to excise taxes, and the elimination of taxes on exports, lowering overall trade tax revenues.
As mentioned in the special feature of the report on COVID‑19 and the African Continental Free Trade Area AfCFTA, COVID-19 has delayed the implementation of AfCFTA. In the short term, the agreement is likely to moderate the effects of COVID‑19 by strengthening the intra‑African trade and accelerating economic recovery. In the longer run, it will likely play an important role in protecting the continent against future shocks and bring additional revenues resulting from economic growth generated by closer integration. However, in the short term, AfCFTA will mostly impact the revenues of low‑income countries. Therefore, appropriate monitoring of these countries will be needed.
The OECD report also includes VAT revenue ratios for 29 African countries. This ratio looks at the difference between the VAT revenue actually collected and collectable VAT revenue under a theoretical VAT applied at the standard rate on all final consumption. The difference in actual and potential VAT revenues is due to 1) policy choices to exempt certain goods and services from VAT or tax them at a reduced rate, and 2) lacking VAT compliance. Higher VAT revenue ratios indicate a broader tax base, implying a more efficient VAT structure.
In 2018, the average African VAT revenue ratio stood at 0.37, lower than the LAC average (0.58) and OECD average (0.56). Cabo Verde (0.73), South Africa (0.61), and Togo (0.57) had the highest VAT revenue ratio, while Equatorial Guinea (0.06), Chad (0.07), and the Democratic Republic of the Congo (0.13) had the lowest ratios.
| Individual Taxes | Corporate Taxes | Social Insurance Taxes | Property Taxes | Value-Added Taxes (VAT) | Consumption Taxes Other than VAT | Other | |
|---|---|---|---|---|---|---|---|
| Botswana | 0.00% | 0.00% | 0.00% | 0.30% | 31.15% | 3.81% | 64.75% |
| Burkina Faso | 8.27% | 16.27% | 9.51% | 0.70% | 35.49% | 28.00% | 1.76% |
| Cabo Verde | 17.69% | 13.72% | 0.20% | 1.90% | 38.66% | 27.84% | 0.00% |
| Cameroon | 7.87% | 14.04% | 7.20% | 0.80% | 36.82% | 25.41% | 7.86% |
| Chad | 19.45% | 37.76% | 0.00% | 1.60% | 15.70% | 24.68% | 0.81% |
| Congo | 27.18% | 23.14% | 0.00% | 1.00% | 0.00% | 30.90% | 17.78% |
| Côte d’Ivoire | 21.08% | 0.33% | 11.44% | 2.90% | 0.62% | 38.46% | 25.17% |
| Democratic Republic of the Congo | 14.23% | 30.21% | 6.12% | 0.20% | 25.25% | 18.96% | 5.04% |
| Egypt | 23.40% | 9.76% | 7.94% | 0.60% | 5.89% | 24.21% | 28.21% |
| Equatorial Guinea | 11.91% | 54.87% | 9.94% | 0.10% | 11.34% | 7.90% | 3.93% |
| Eswatini | 30.20% | 18.08% | 14.10% | 2.60% | 24.49% | 10.50% | 0.03% |
| Ghana | 26.75% | 15.70% | 5.67% | 0.00% | 0.31% | 29.00% | 22.58% |
| Kenya | 24.06% | 25.45% | 3.23% | 0.90% | 7.91% | 27.68% | 10.77% |
| Lesotho | 44.56% | 13.73% | 0.00% | 0.00% | 41.24% | 0.00% | 0.48% |
| Madagascar | 10.37% | 11.87% | 5.30% | 0.80% | 48.59% | 22.69% | 0.38% |
| Malawi | 29.13% | 18.92% | 0.00% | 0.00% | 28.11% | 23.79% | 0.05% |
| Mali | 7.04% | 14.87% | 11.93% | 2.00% | 32.85% | 27.00% | 4.30% |
| Mauritania | 31.27% | 11.38% | 5.02% | 2.90% | 0.00% | 31.30% | 18.13% |
| Mauritius | 9.95% | 14.01% | 3.79% | 4.90% | 34.47% | 30.74% | 2.14% |
| Morocco | 14.22% | 16.92% | 19.83% | 5.70% | 27.40% | 14.83% | 1.10% |
| Namibia | 40.30% | 22.96% | 0.00% | 0.60% | 33.18% | 2.35% | 0.61% |
| Niger | 6.94% | 14.24% | 4.77% | 0.30% | 43.06% | 23.11% | 7.58% |
| Nigeria | 9.78% | 50.34% | 8.41% | 0.00% | 13.57% | 11.80% | 6.09% |
| Rwanda | 22.27% | 18.06% | 5.95% | 0.10% | 30.17% | 23.46% | 0.00% |
| Senegal | 17.50% | 8.95% | 7.06% | 2.50% | 33.70% | 27.02% | 3.27% |
| Seychelles | 13.52% | 19.28% | 2.91% | 1.70% | 34.92% | 27.69% | 0.00% |
| South Africa | 34.55% | 15.24% | 1.35% | 5.80% | 22.91% | 16.76% | 3.39% |
| Togo | 7.74% | 12.57% | 0.00% | 0.80% | 41.20% | 35.06% | 2.63% |
| Tunisia | 18.80% | 7.75% | 29.05% | 0.90% | 21.95% | 17.79% | 3.76% |
| Uganda | 32.01% | 24.73% | 0.00% | 0.00% | 3.25% | 33.49% | 6.52% |
| Africa Average | 17.47% | 19.22% | 7.23% | 1.60% | 29.73% | 22.21% | 2.98% |
| LAC Average | 9.58% | 15.52% | 17.14% | 3.60% | 27.82% | 22.24% | 4.09% |
| OECD Average | 23.91% | 8.85% | 27.00% | 5.48% | 20.57% | 11.96% | 2.57% |
|
Source: Author’s calculation based on OECD/AUC/ATAF, Revenue Statistics in Africa 2020: 1990-2018 (OECD Publishing: Paris, 2020), https://doi.org/10.1787/14e1edb1-en-fr. Notes: Figures include sub-national government tax revenues for Eswatini, Mauritania, Mauritius, Morocco, Nigeria (state revenues only), and South Africa. Sub-national government tax revenues are not available in other countries. Individual Taxes covers the OECD category 1100 Taxes on income, profits, and capital gains of individuals. Corporate Taxes covers the OECD category 1200 Taxes on income, profits, and capital gains of corporates. Social Insurance Taxes covers the OECD category 2000 social security contributions (SSC). Property Taxes covers the OECD category 4000 Taxes on property. Value-Added Taxes (VAT) covers the OECD category 5111 Value-added taxes. Consumption Taxes Other than VAT covers the OECD category 5000 Taxes on goods and services minus the category 5111 Value-added taxes. Other covers the OECD categories 1300 Unallocable between 1100 and 1200; 3000 Taxes on payroll and workforce; 6000 Taxes other than 1000, 2000, 3000, 4000, and 5000; and custom duties collected for the EU. Botswana: The breakdown of revenue from income tax by personal income tax and corporate income tax is not available. The Africa average should be interpreted with caution as data for social security contributions (category 2000) and property taxes (category 4000) are not available or are partial in a few countries. Social security contributions are not available for Chad, the Republic of the Congo, Namibia, Togo, and Uganda and are only partially available for Cameroon and Senegal. Social security contributions for Botswana, Lesotho, and Malawi are deemed to be null as they do not meet the criteria to be classified as social security contributions set out in the OECD classification of taxes. The Latin American and Caribbean (LAC) average includes 25 countries, namely Argentina, the Bahamas, Barbados, Belize, Bolivia, Brazil, Chile, Colombia, Costa Rica, Cuba, the Dominican Republic, Ecuador, El Salvador, Guatemala, Guyana, Honduras, Jamaica, Mexico, Nicaragua, Panama, Paraguay, Peru, Uruguay, Trinidad and Tobago, and Venezuela. Chile and Mexico are also part of the OECD average. The OECD average includes 36 OECD countries. Colombia was not an OECD member in 2018 and is not included in the OECD average. |
|||||||
Taxes make more sense with us in your inbox.
Subscribe to our newsletter for tax insights that cut through the noise—and make sense of it.
Sign Up