The Organisation for Co-operation and Economic Development (OECD) has compiled taxA tax is a mandatory payment or charge collected by local, state, and national governments from individuals or businesses to cover the costs of general government services, goods, and activities. revenue data for countries around the world—including 27 Latin American and Caribbean (LAC) countries, where tax revenue as a percent of GDP is on average 11 percentage points lower than in other regions.
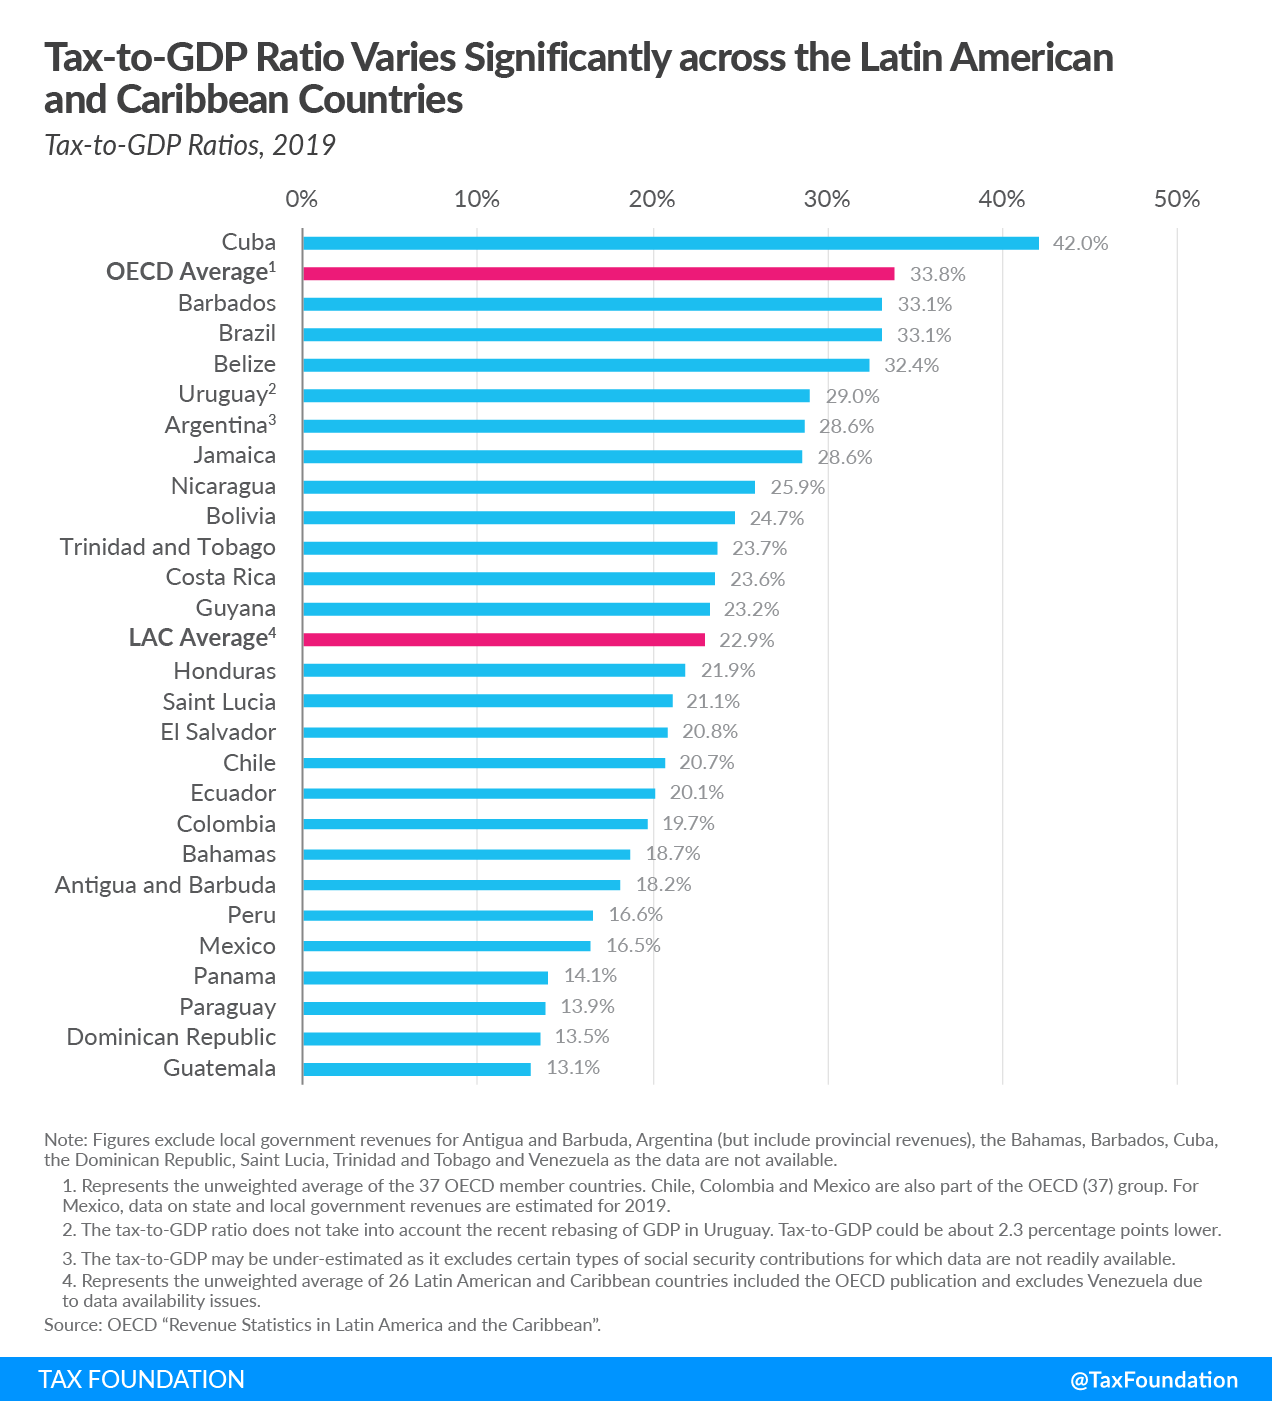
On average, the tax-to-GDP ratio for 26 countries (excluding Venezuela due to data availability issues) was 22.9 percent, compared to the OECD average of 33.8 percent. From all the LAC countries only Cuba (42 percent) recorded a tax-to-GDP ratio higher than the OECD average. (Mexico, Chile and Colombia are also OECD member countries, therefore LAC and OECD groups overlap somewhat.)
The regional OECD report on tax revenue statistics in LAC countries covers the years 1990 to 2019, breaking down current tax structures in the region and how they have evolved.
Between 1990 and 2019, the average tax-to-GDP ratio in LAC countries rose steadily each year, with four exceptions (1991, 1996, 2009, and 2017), increasing by more than 7 percentage points, from 15.7 percent to 22.9 percent. This is mainly due to revenue increases from value-added taxes (VAT, 3.8 percentage points) and individual income and profit taxes (3.0 percentage points). Given that the OECD average has been relatively stable since 1990, the difference between the LAC and OECD average tax-to-GDP ratios decreased between 1990 and 2008 and has since remained relatively constant at 11 percentage points.
In 2019, Cuba (42.0 percent), Barbados (33.1 percent), and Brazil (33.1 percent) had the highest tax-to-GDP ratios of the 26 countries covered. Guatemala (13.1 percent), Dominican Republic (13.5 percent), and Paraguay (13.9 percent) had the lowest.
In general, countries in Central America and Mexico typically had lower tax‑to‑GDP ratios, at an average of 21.3 percent, while countries in the Caribbean had higher tax‑to‑GDP ratios at an average of 24.9 percent. For South American countries the average ratio was 22.9 percent, the same as the LAC average.
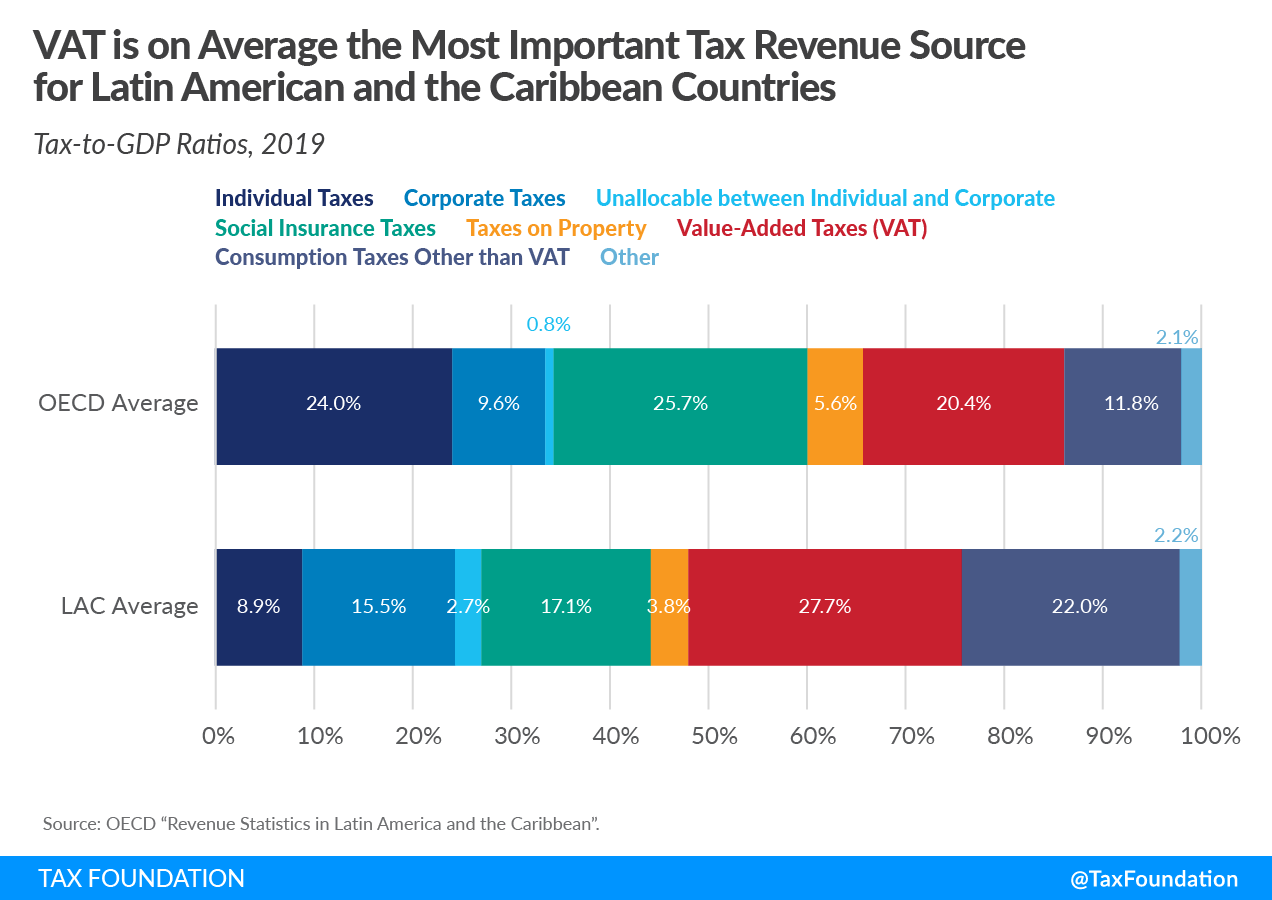
Taxes on goods and services were on average the greatest source of tax revenue for LAC countries, at 49.7 percent of total tax revenues in 2019, compared to one-third in OECD countries. VAT contributed on average 27.7 percent, making it the most important tax on goods and services in LAC countries. Corporate and individual taxes accounted, on average, for another 27.3 percent of all tax revenue. Notable differences with respect to the OECD average are LAC’s relatively higher reliance on corporate taxes and lower reliance on individual taxes. Social insurance taxes accounted for 17.1 percent of the tax revenue in LAC countries, compared to 25.7 percent in the OECD countries. Part of this difference can be explained by the tendency towards private provision of social security in many LAC countries.
In general, LAC countries have relatively higher reliance on corporate and consumption taxes. The average OECD tax structure differs quite substantially from that of the LAC average, as LAC countries tend to rely less on individual, social insurance, or property taxes.
Between 1990 and 2019, revenue sources shifted to VAT (increase of 12.3 percentage points of total taxes) and individual and corporate taxes (increase of 7.4 percentage points of total taxes. Also, the share of social security contributions in total tax revenues has increased by 3.2 percentage points over the last 29 years. Consumption taxes other than VAT have declined by 20.2 percentage points of total revenues. While the share of corporate taxes is still higher than the share of individual taxes, since 2007, corporate tax revenue has declined by 0.8 percentage points of total tax revenue.
The decline in consumption taxes other than VAT (excise, customs, and import duties) in many LAC countries is partly due to lower trade tax revenues. Trade liberalization across the region has led to reduced import tariffs, a narrower base of goods and services subject to excise taxes, and the elimination of taxes on exports, lowering overall trade tax revenues. The exception is Argentina, where taxes on exports were reestablished in 2002. Nevertheless, the government abolished export taxes on almost all agricultural products in 2015 and reintroduced them in 2018.
The OECD report also includes VAT revenue ratios for 24 of the LAC countries. This ratio looks at the difference between the VAT revenue actually collected and what would theoretically be if VAT were applied at the standard rate on the entire tax baseThe tax base is the total amount of income, property, assets, consumption, transactions, or other economic activity subject to taxation by a tax authority. A narrow tax base is non-neutral and inefficient. A broad tax base reduces tax administration costs and allows more revenue to be raised at lower rates.. The difference in actual and potential VAT revenues is due to 1) policy choices to exempt certain goods and services from VAT or tax them at a reduced rate, and 2) lacking VAT compliance. Higher VAT revenue ratios indicate a broader tax base, implying a more efficient VAT structure. Nevertheless, VAT revenue ratio interpretation is more difficult in countries that rely significantly on tourism, as purchases by nonresidents may not be included in the final consumption expenditure while the VAT on those purchases is included in the overall VAT tax revenues.
In 2019, the average LAC’s VAT revenue ratio stood at 0.56, equal to the OECD average. Belize and Bahamas had the highest VAT revenue ratio (both above 0.80), while Guyana (0.28) and Mexico (0.33) had the lowest ratios. However, the Bahamas and Belize have a high share of revenue from tourism compared to the other LAC countries, which might partly explain the high VAT revenue ratio. Nevertheless, both the Bahamas and Belize have a broad-based VAT, with a limited number of exemptions and no reduced rates.
| Country | Individual Taxes | Corporate Taxes | Unallocable between Individual and Corporate | Social Insurance Taxes | Taxes on Property | Value-Added Taxes (VAT) | Consumption Taxes Other than VAT | Other |
|---|---|---|---|---|---|---|---|---|
| Antigua and Barbuda | 0.07% | 9.63% | 0.00% | 17.57% | 8.81% | 30.97% | 32.96% | 0.00% |
| Argentina | 7.07% | 9.64% | 1.25% | 19.95% | 9.14% | 24.95% | 27.28% | 0.73% |
| Bahamas | 0.00% | 0.00% | 0.00% | 12.36% | 13.74% | 35.74% | 38.16% | 0.00% |
| Barbados | 13.54% | 9.20% | 1.75% | 17.47% | 6.73% | 28.80% | 22.51% | 0.00% |
| Belize | 8.62% | 15.53% | 1.03% | 8.42% | 3.46% | 29.25% | 33.69% | 0.00% |
| Bolivia | 0.74% | 15.53% | 0.00% | 25.08% | 0.75% | 29.22% | 19.77% | 8.91% |
| Brazil | 9.17% | 8.64% | 4.59% | 25.71% | 4.61% | 21.18% | 21.65% | 4.45% |
| Chile | 7.17% | 23.41% | 4.27% | 7.31% | 5.41% | 39.88% | 13.18% | -0.62% |
| Colombia | 6.17% | 24.47% | 1.66% | 9.51% | 9.08% | 29.63% | 13.31% | 6.17% |
| Costa Rica | 6.11% | 11.95% | 2.89% | 34.18% | 1.90% | 18.46% | 16.34% | 8.18% |
| Cuba | 10.95% | 17.23% | 0.00% | 13.16% | 0.00% | 0.00% | 48.26% | 10.40% |
| Dominican Republic | 9.62% | 14.82% | 7.01% | 0.41% | 4.79% | 34.69% | 28.10% | 0.57% |
| Ecuador | 0.91% | 6.05% | 14.65% | 27.13% | 1.59% | 30.26% | 19.31% | 0.10% |
| El Salvador | 14.85% | 15.07% | 3.57% | 12.83% | 0.78% | 37.47% | 13.16% | 2.26% |
| Guatemala | 3.65% | 18.53% | 6.26% | 16.80% | 1.53% | 38.80% | 13.23% | 1.21% |
| Guyana | 14.09% | 23.32% | 0.36% | 9.48% | 1.97% | 21.05% | 28.88% | 0.86% |
| Honduras | 8.44% | 17.20% | 0.00% | 15.64% | 2.54% | 31.84% | 19.73% | 4.62% |
| Jamaica | 11.50% | 11.22% | 8.21% | 4.08% | 3.17% | 33.05% | 28.41% | 0.36% |
| Mexico | 21.18% | 21.32% | 1.51% | 13.40% | 2.03% | 24.28% | 12.10% | 4.17% |
| Nicaragua | 6.11% | 24.67% | 0.00% | 25.70% | 1.11% | 22.47% | 19.09% | 0.85% |
| Panama | 12.08% | 9.61% | 4.34% | 41.45% | 1.80% | 15.47% | 13.44% | 1.81% |
| Paraguay | 1.88% | 16.37% | 0.00% | 26.45% | 1.34% | 35.73% | 17.62% | 0.61% |
| Peru | 11.52% | 23.02% | 2.00% | 12.08% | 2.39% | 38.45% | 8.73% | 1.81% |
| Saint Lucia | 11.36% | 9.40% | 0.93% | 10.50% | 2.15% | 29.02% | 36.64% | 0.00% |
| Trinidad and Tobago | 18.64% | 35.92% | 3.54% | 12.37% | 1.05% | 15.20% | 13.29% | 0.00% |
| Uruguay | 14.97% | 10.12% | 1.05% | 26.43% | 7.70% | 25.43% | 13.69% | 0.62% |
| LAC Average | 8.86% | 15.46% | 2.73% | 17.13% | 3.83% | 27.74% | 22.02% | 2.23% |
| OECD Average | 23.96% | 9.55% | 0.85% | 25.71% | 5.62% | 20.45% | 11.80% | 2.05% |
|
Notes: The Bahamas does not have tax income. There is no VAT system in Cuba. Individual Taxes covers the OECD category 1100 Taxes on income, profits, and capital gains of individuals. Corporate Taxes covers the OECD category 1200 Taxes on income, profits, and capital gains of corporates. Unallocable between Individual and Corporate covers the OECD category 1300 Unallocable between 1100 and 1200. Social Insurance Taxes covers the OECD category 2000 Social security contributions (SSC). Taxes on Property cover the OECD category 4000 Taxes on property. Value-Added Taxes (VAT) covers the OECD category 5111 Value-added taxes. Consumption Taxes Other than VAT covers the OECD category 5000 Taxes on goods and services minus the category 5111 Value-added taxes. Other covers the OECD categories covers 3000 Taxes on payroll and workforce and 6000 Taxes other than 1000, 2000, 3000, 4000, and 5000. Source: OECD “Revenue Statistics in Latin America and the Caribbean,” https://stats.oecd.org/Index.aspx?DataSetCode=RSLACT. |
||||||||
Taxes make more sense with us in your inbox.
Subscribe to our newsletter for tax insights that cut through the noise—and make sense of it.
Sign Up