Key Findings
- Gross Domestic Income (GDI) is a complete measure of all income earned in the United States.
- About half of all income is labor compensation, in the form of wages, salaries, and benefits.
- Benefits account for a growing share of labor compensation.
- A quarter of income goes to business-level taxes and the replacement of worn out machinery.
- A quarter of income is returned to owners of capital, including business owners and private homeowners.
- The shares of income returned to workers and to owners of capital remain constant over time once benefits, taxes, and depreciationDepreciation is a measurement of the “useful life” of a business asset, such as machinery or a factory, to determine the multiyear period over which the cost of that asset can be deducted from taxable income. Instead of allowing businesses to deduct the cost of investments immediately (i.e., full expensing), depreciation requires deductions to be taken over time, reducing their value and discouraging investment. are properly accounted for. Two-thirds of net income goes to labor and one-third goes to capital.
- Study of inequality should focus on the distribution of income within labor compensation, rather than the distribution of labor and capital. Labor and capital are complements, not opposing interests.
Introduction
Gross Domestic Income (GDI) is the lesser-known cousin of Gross Domestic Product (GDP). Both figures measure the value of all production in a year, so their final totals are virtually identical. However, they differ in how they arrive at that final total. While GDP measures what gets purchased, GDI measures who gets paid.
GDI, therefore, is a very useful measure for determining how Americans earn their incomes and maintain their standards of living. Using this data series has some distinct advantages. Unlike almost any other income data, it is complete; it adds up to the total value of all economic production. Additionally, the Bureau of Economic Analysis (BEA) has put together data on American GDI going back to the start of the Great Depression, making it a very long-running data series.
This report will examine the full length and breadth of the data series. It will go through each component, in turn, and describe how its share of national income has changed over time. In other words, it is a comprehensive survey of 84 years’ worth of American income.
The Largest Share of GDI Goes to Labor
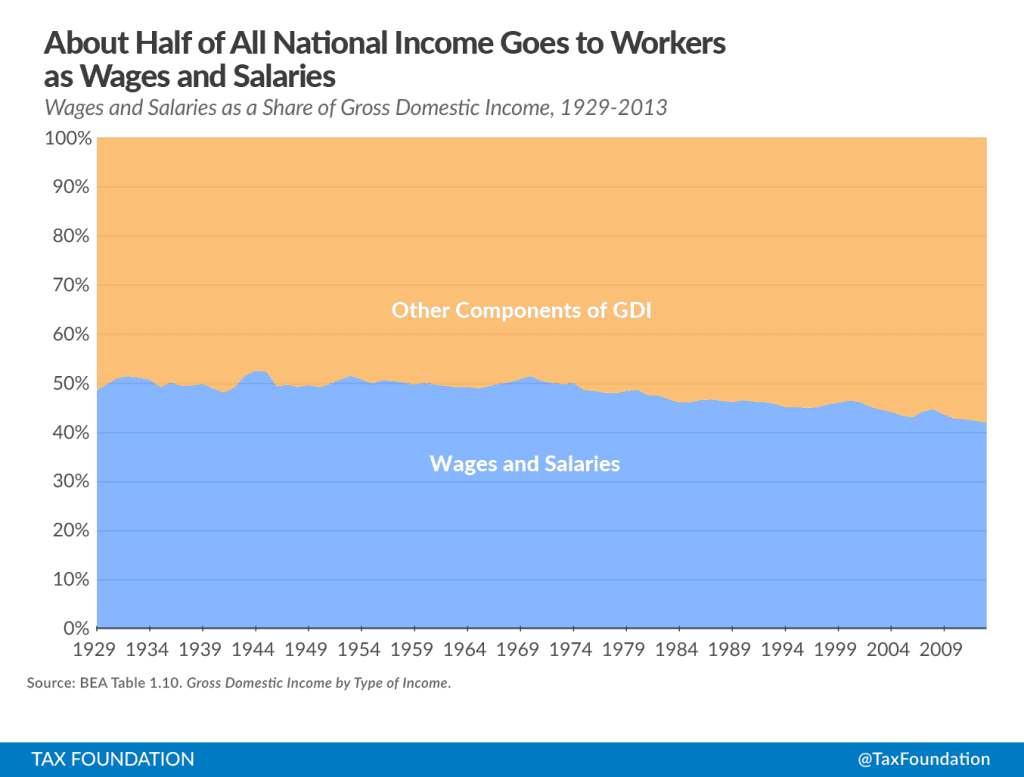
The largest component of GDI in the United States is wages and salaries: people getting paid money to do work. Historically, about half of all national income goes to workers in this form. (Chart 1, below.)
Chart 1.
Chart 1 represents all income made in the United States since 1929. Rather than showing the overall rise in wages and salaries (from a mere $51 billion in 1929 to $7.1 trillion in 2013), the chart shows wages and salaries as a share of the total. This finding is similar in scale to an examination of personal income as reported on taxA tax is a mandatory payment or charge collected by local, state, and national governments from individuals or businesses to cover the costs of general government services, goods, and activities. returns. Wages and salaries are also the largest form of taxable incomeTaxable income is the amount of income subject to tax, after deductions and exemptions. For both individuals and corporations, taxable income differs from—and is less than—gross income. , at $6.3 trillion out of a total $9.2 trillion in 2012.[1]
There is a steady secular trend visible in Chart 1: wages and salaries are declining as an overall portion of total income. After holding steady at about 50 percent prior to 1970, the wage share has now fallen to 42 percent in 2013. It’s worth asking why. The answer involves a second component of GDI: one that the BEA calls “supplements to wages and salaries.”
Chart 2.
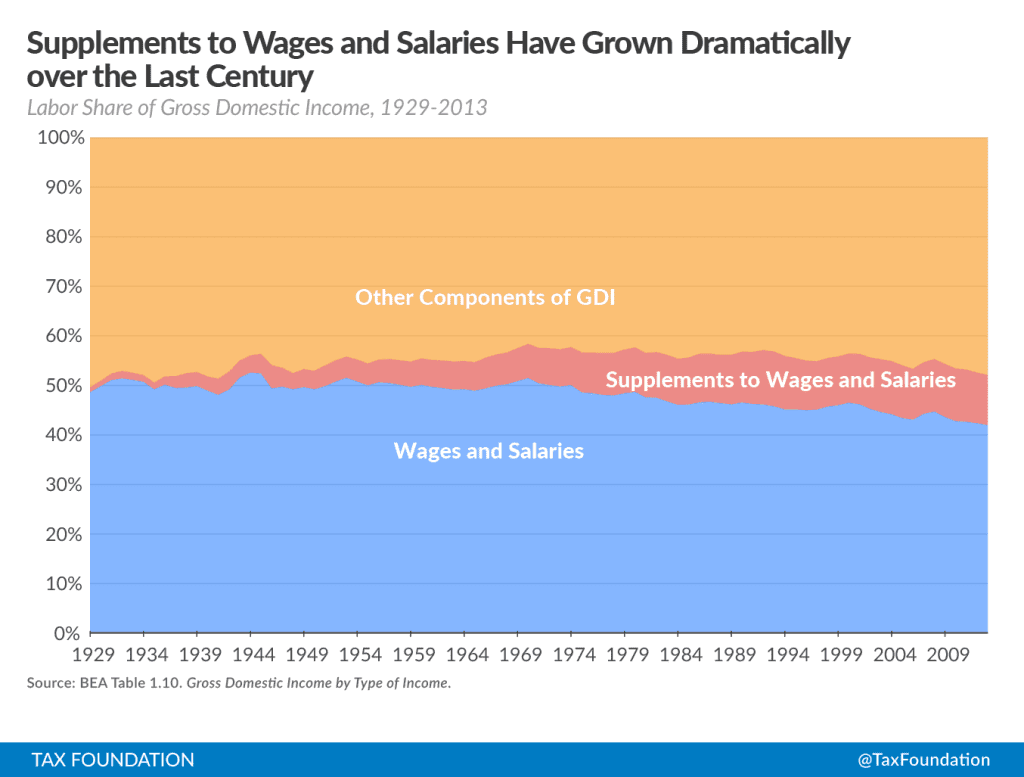
Chart 2 (above) includes the compensation paid that doesn’t take the form of wages or salaries. Included in this are pension contributions (including Social Security) and insurance premiums (such as health insurance) paid by employers. These are legitimate costs from the firm’s side, and they are legitimate earnings by workers representing their productivity. However, they aren’t flexible income like wages and salaries are. This sort of compensation has grown dramatically over the last century. Once a negligible portion of national income, it now exceeds 10 percent.
There are several reasons this component has increased so much over the years. The most important of these is the growth of the health care sector. The quality of health care has improved at an incredible pace over the last century, but the cost of employing talented workers in that field has resulted in high insurance premiums. In the U.S., insurance premiums are often paid by employers on the behalf of workers, so these have become a larger and larger portion of compensation packages. This is a political choice. It is the result of a tax policy that excludes these insurance premiums from taxable income. The exclusion of these insurance premiums from taxable income encourages firms to offer compensation packages weighted toward benefits rather than wages and salaries.
Another factor driving the growth of supplements to wages and salaries is the increase in payroll taxes to fund Social Security and Medicare. As the U.S. population has aged, the costs of these programs have grown, and the payroll taxA payroll tax is a tax paid on the wages and salaries of employees to finance social insurance programs like Social Security, Medicare, and unemployment insurance. Payroll taxes are social insurance taxes that comprise 24.8 percent of combined federal, state, and local government revenue, the second largest source of that combined tax revenue. rate has risen.[2]
Both of these phenomena that lower the wage and salary share of GDI are results of federal policy. While employer compensation earned by individuals has remained relatively constant as a share of national income, an increasing portion of workers’ earnings are diverted, through federal policy, toward benefits rather than wages and salaries.
For the purposes of future charts, we will combine wages and salaries with benefits to create a single category for labor compensation.
Some GDI Is Lost to Depreciation
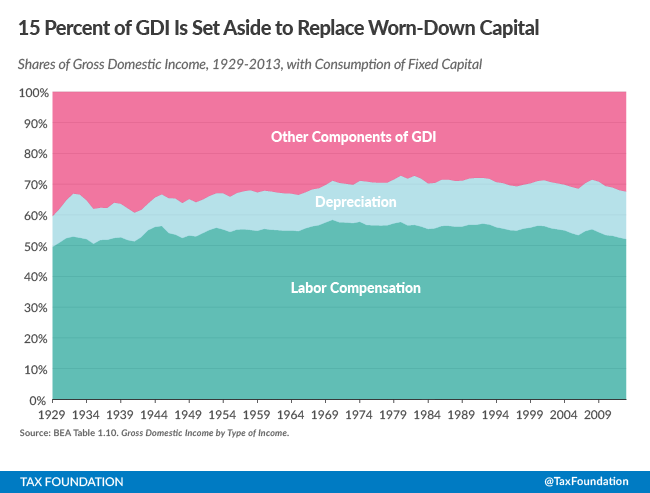
Some national income never actually accrues to individuals, or even government. Some income is lost as our possessions wear down. Machines break, buildings get dilapidated, software becomes obsolete. These things require repair or replacement, which costs money. Depreciation is a sort of “anti-income,” an expense that effectively cancels out some of the revenues that the U.S. earns and represents the income that individuals, firms, and governments set aside to replace worn-down capital.
Economists usually start with “gross” measures of income because they’re comprehensive. Gross incomeFor individuals, gross income is the total pre-tax earnings from wages, tips, investments, interest, and other forms of income and is also referred to as “gross pay.” For businesses, gross income is total revenue minus cost of goods sold and is also known as “gross profit” or “gross margin.” includes the portion that goes toward depreciation. But other measures, called “net income,” subtract that portion, on the grounds that it doesn’t ultimately accrue to anyone. It is simply lost.
Chart 3.
Chart 3 (above) illustrates the share of income lost to depreciation. This share has grown from about ten percent of income in the early half of the 20th century to over fifteen percent today. This is an additional reason for the falling labor share of gross income.[3], [4], [5]
For understanding where all money in the U.S. goes, in the aggregate, it is useful to know the depreciation share of income. However, for the purposes of understanding inequality among individuals, net income – where one subtracts the depreciation share and only looks at the remainder – is the more appropriate measure because no one is able to consume the depreciation portion.[6]
Many Taxes Are Paid at the Business Level
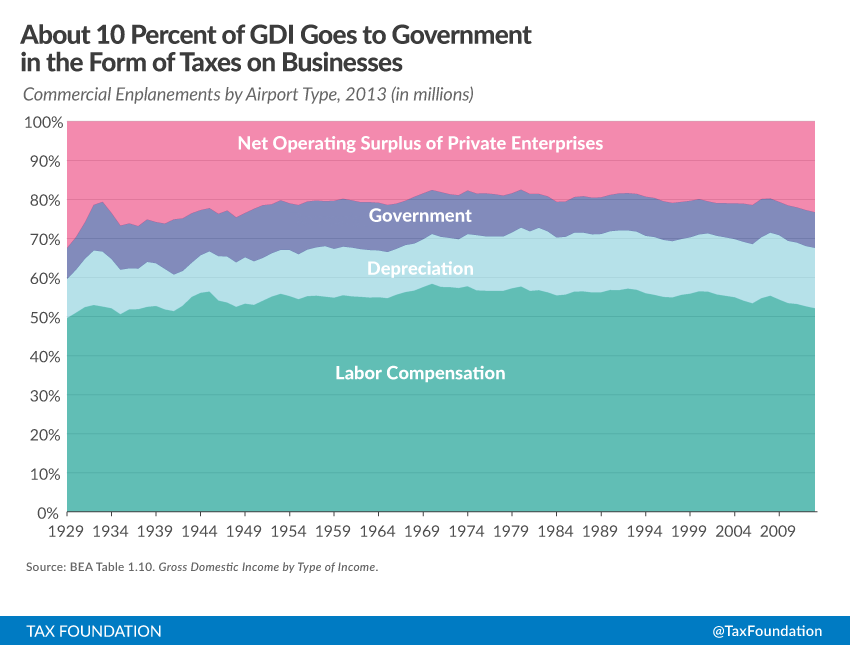
A large portion of national income goes directly to the government, without ever reaching any individual’s pocketbook. This is accounted for by the BEA, under two main categories. The first, called “taxes on production and imports,” comprises most state and local taxes that businesses pay, as well as federal excise taxAn excise tax is a tax imposed on a specific good or activity. Excise taxes are commonly levied on cigarettes, alcoholic beverages, soda, gasoline, insurance premiums, amusement activities, and betting, and typically make up a relatively small and volatile portion of state and local and, to a lesser extent, federal tax collections. es. The second, called “taxes on corporate income,” is more straightforward: it is the sum of all corporate income taxA corporate income tax (CIT) is levied by federal and state governments on business profits. Many companies are not subject to the CIT because they are taxed as pass-through businesses, with income reportable under the individual income tax. es paid. These categories do not, however, include personal income taxes. They only include those taxes that come out of business profits.
Chart 4.
Chart 4 (above) includes business taxes, grouped together in a government share.[7] Chart 4 separates the effects of both depreciation and government, leaving only the income that private enterprise actually distributes to individuals. Most of this income is labor compensation (at the bottom of the chart), but a minority of it is other kinds of income, grouped together as the net operating surplus of private enterprises (represented at the top).
Readers may wonder why the individual income taxAn individual income tax (or personal income tax) is levied on the wages, salaries, investments, or other forms of income an individual or household earns. The U.S. imposes a progressive income tax where rates increase with income. The Federal Income Tax was established in 1913 with the ratification of the 16th Amendment. Though barely 100 years old, individual income taxes are the largest source of tax revenue in the U.S. , levied on wages, salaries, and investment income, is not a component of this analysis. The problem with including that tax is that it taxes all different kinds of income in a consolidated, complex process. As a result, it is impossible to distribute the individual income tax appropriately across the kinds of income categorized here. Instead, this report aims to show the income people earn from enterprises before they pay tax on those different kinds of individual income. That amount is best approximated by the combination of labor compensation and net operating surplus in Chart 4 (above).
There Are Four Main Kinds of Non-Wage Income
After business-level taxes and depreciation, the remaining fruits of private enterprise are distributed to individuals (at least, until they pay individual-level taxes on that income.) There are four important categories of income besides labor compensation.
The first of these is the net housing income to people: that is, the surplus value that housing provides to homeowners even after accounting for money lost to upkeep and interest. This housing category includes all homes, whether or not they are rented. In other words, it reflects some actual income earned by individual landlords, but it also measures the benefit of having a place to live as a kind of “income” as well. This was about 4 percent of GDI in 2013.
The second category of income is corporate profits, which reflects the after-tax profits of corporations. These find their way to individuals through capital gains or dividend income, or through pension funds and retirement accounts. Corporate profits were about 7 percent of GDI in 2013.
The third of these is net interest income. This represents money paid to bondholders by enterprises.[8] This was approximately 4 percent of GDI in 2013.
The last category is proprietors’ income. This is the net income of noncorporate businesses, such as partnerships and sole proprietorships. Noncorporate forms of business are becoming more and more popular, in part because of tax policy.[9]
Chart 5.
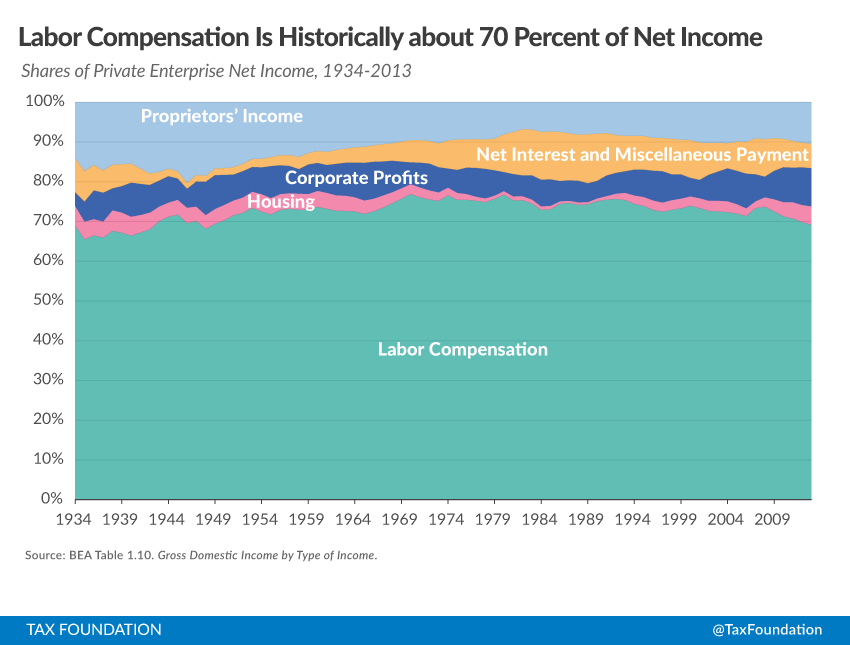
Chart 5 (above) is different from the first four figures in this report, in that it shows shares of income with depreciation and government excluded, rather than all of GDI.[10] The labor compensation share is the same as in previous charts, while the remaining shares are the individual components of the net operating surplus of private enterprises in Chart 4.
One question that economists have been concerned with recently is whether labor’s share of income has declined over time.[11] From Chart 1, it is readily apparent why they would ask such a question. An examination of Chart 5 may prove useful for these purposes because it removes the extraneous portions of national income and looks specifically at the income actually earned by people.
The capital share of income, using Chart 5, includes housing income, profits, and interest, plus some portion of proprietor’s income. One issue with proprietorships and partnerships is that the split between labor and capital is indeterminate, since the owner or partner is typically compensated for both work and investment in the business. (This issue is also present in categorizing “business income” on individual tax returns as labor or investment income.)[12]
Benjamin Bridgeman of the BEA ran a calculation similar to the one underlying Chart 5 and concluded that once depreciation and production taxes are subtracted, “recent net labor share is within its historical range whereas gross share is at its lowest level.” In other words, the historic low in labor share was attributable to taxes and depreciation.
The exact values of the labor and capital shares depend on the extent to which proprietors’ income counts as labor. However, despite some methodological differences,[13] this examination of shares of GDI leads to the same conclusion as Bridgeman’s finding. Labor compensation has fallen somewhat as a share of net income since its peak in the 1970s, but it is within the historical range.
Matthew Rognlie, using different methods, concludes that the increase in the capital share of net income comes entirely from the housing sector. While the housing sector is capital, it has some important characteristics that distinguish it from corporate capital, and it should not necessarily be categorized with the business sector.
The Dog that Didn’t Bark
“Is there any other point to which you would wish to draw my attention?”
“To the curious incident of the dog in the night-time.”
“The dog did nothing in the night-time.”
“That was the curious incident.”– “Silver Blaze,” The Memoirs of Sherlock Holmes, 1892
In “Silver Blaze,” Sherlock Holmes deduced, from the fact that a guard dog didn’t bark, that the dog was friendly with the intruder. The story is a good one in itself, but it is also an elegant illustration of the importance of negative results. One of the most striking features of this data series is the lack of any striking features. There is some variation in the data but far less than one might expect.
On the whole, labor compensation comprises about 70 percent of income after business taxes and depreciation. The observation that labor and capital shares do not change substantially is not a new one. John Maynard Keynes established historical data series for both Britain and the United States and noted “the stability of the proportion of the national dividend accruing to labor, irrespective apparently of the level of output as a whole and of the phase of the trade cycle,” and he called it “one of the most surprising, yet best-established facts in the whole range of economic statistics.” He further observed “this appears to be a long-run, and not merely a short-period, phenomenon.”[14]
In the years since Keynes made the observation, the phenomenon has largely held in the long run as well. The labor share of net income devoted to compensation was 67 percent when Keynes penned those remarks, and it is 69 percent now. This fact runs contrary to a number of well-worn narratives. The folk economic history of the 20th century is that labor and capital fought over important policy changes – like union membership – that had dramatic effects on their relative bargaining power.
But here, from a broad high-level view, on a graph that comprehensively accounts for all income, it’s hard to even describe those changes as visible. None of it seems to matter – the Great Depression, the New Deal, World War II, the Baby Boom, the Reagan Revolution, the Dotcom Bubble – these things certainly affected total economic output, but they did virtually nothing to reallocate its division: about 70 percent of income goes to workers, regardless of public policy. This is potentially lessened only during periods of extensive unemployment.[15]
“Negative” results like this one – results that don’t show anything – are often just as important as positive ones. The stability of income shares to capital and labor is a significant non-result. It is important, for example, in determining the sources of inequality. It is strong evidence against a Marxian view of the world where the interests of labor and capital are opposed. Instead, the overall incomes of labor and capital are wedded to each other, for richer or for poorer.
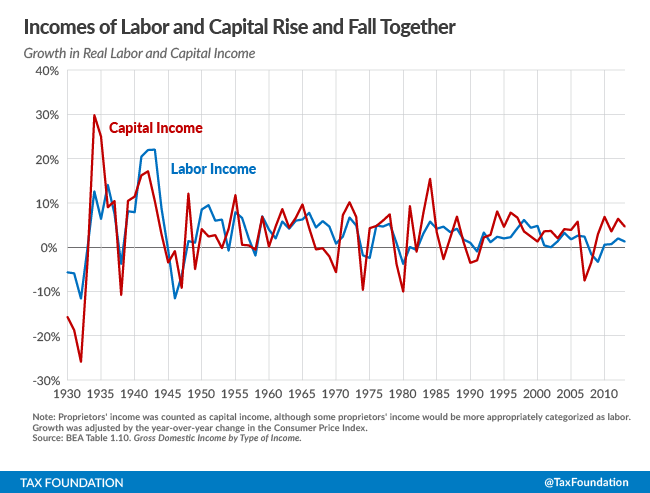
In Chart 6 (below), the real incomes of labor and capital are shown, again using the components of GDI. The real incomes of labor and capital mostly move in tandem. Good years for shareholders are good years for workers, and vice versa. This lends credibility to the idea that the burden of business taxes falls partly on workers, a view shared by the Treasury Department, the Congressional Budget Office, and the Tax Policy Center.[16], [17]
Chart 6.
Refocusing the Study of Income Inequality
After the publication of Thomas Piketty’s Capital in the 21st Century, many readers emphasized the importance of capital income as a source of inequality, and some readers took his observation that “r > g” (meaning that the rate of return on capital is greater than the rate of growth for the economy as a whole) to imply that capital’s share of national income would increase continuously in the future.
Other economists pushed back against this idea.[18] In late 2014, Piketty published a clarification on his work. He wrote “I do not view r > g as the only or even the primary tool for considering changes in income and wealth in the twentieth century, or for forecasting the path of inequality in the twenty-first century.” He further redirected the readers to be more attentive to inequality among labor earnings. He added: “I point out in my book (Piketty 2014a, ch. 8–9) that the rise of top income shares in the United States over the 1980–2010 period is due for the most part to rising inequality of labor earnings.”[19]
Piketty is right: inequality of labor earnings – that is, the distribution of the labor share – is a much more fruitful ground for the study of inequality than examination of labor and capital shares. This belief is echoed by Rognlie: “Beyond housing, the results in this paper (if anything) tentatively suggest that concern about inequality should be shifted away from the split between capital and labor, and toward other aspects of distribution, such as the within-labor distribution of income.”[20]
A study by the Economic Policy Institute attempting to explain the gap between overall growth in the economy and the growth in median wages found that inequality of compensation had much more explanatory power than shifts in labor’s share of income.[21] This finding would become even stronger if the authors, like the other economists cited in this report, examined shares of net income rather than gross income.
Conclusion
A comprehensive look at the history of income in the U.S. is a worthwhile endeavor in itself. However, it has important implications for policy debates as well.
These findings suggest that the study of income inequality should remain focused on compensation. Overall, inequality among wages and salaries – the largest source of income – is a far more important contributor to overall income inequality than any kind of change in the labor share. To the extent that wages are falling as a portion of national income, it is due to the rise of other kinds of income that are mandated through or favored by the tax code – like contributions to entitlement programs, employer-provided health insurance, and returns to owner-occupied housing.
Voters should consider whether these policies are worthwhile. They should also temper their expectations on the ability to raise taxes from capital income; it’s not nearly as large a pool of money as lawmakers promise it to be. Finally, all Americans should consider the collaborative nature of our economy, where labor and capital work together to create output, and their incomes rise and fall together. In light of that fact, the best avenue for improving welfare is to enact growth-oriented policies that increase the incomes of labor and capital alike.
[1] Alan Cole, Sources of Personal Income, Tax Foundation Fiscal Fact No. 449, Jan. 29 2015, https://taxfoundation.org/sources-personal-income.
[2] Tax Policy Center, Historical Payroll Tax Rates, Jan. 20 2015, http://www.taxpolicycenter.org/taxfacts/displayafact.cfm?Docid=45.
[3] Dean Baker, Center for Economic and Policy Research, Behind the Gap between Productivity and Wage Growth, Feb. 2007, http://www.cepr.net/documents/publications/0702_productivity.pdf.
[4] Benjamin Bridgeman, Bureau of Economic Analysis, Is Labor’s Loss Capital’s Gain? Oct. 2014, http://bea.gov/papers/pdf/laborshare1410.pdf.
[5] Scott Winship, Forbes, Workers Get The Same Slice of the Pie As They Always Have, Dec. 16 2014, http://www.forbes.com/sites/scottwinship/2014/12/16/workers-get-the-same-slice-of-the-pie-as-they-always-have/.
[6] Matthew Rognlie, Deciphering the fall and rise in the net capital share, Brookings Papers on Economic Activity Conference Draft, Mar. 2015, http://www.brookings.edu/~/media/projects/bpea/spring-2015/2015a_rognlie.pdf.
[7] This share also includes miscellaneous subsidies and loss or surplus of government enterprises. These categories are largely negligible in size compared to the scale of the U.S. economy. As such, they are quite literally a footnote in this report.
[8] Interest paid on mortgages is included in this total. Since enterprises can both receive interest and pay it, the BEA cancels these out to arrive at a net figure.
[9] Kyle Pomerleau, An Overview of Pass-through Businesses in the United States, Tax Foundation Special Report No. 227, Jan. 21 2015, https://taxfoundation.org/overview-pass-through-businesses-united-states.
[10] It is also different in that it starts midway through the Great Depression, rather than in 1929. Corporate profits were negative for an extended period in the early 1930s, and the style of graph used here does not allow for negative income shares.
[11] Baker, supra note 3; Bridgeman, supra note 4; Winship, supra note 5; Rognlie, supra note 6.
[12] Cole, supra note 1.
[13] Bridgeman excluded production taxes and depreciation from net income, but not corporate income taxes. For some calculations, Bridgeman included proprietors’ income in the capital share, while acknowledging that some of that income was actually labor income.
[14] John Maynard Keynes, The Economic Journal, Vol. 49, No. 193, Mar. 1939, http://www.jstor.org/discover/10.2307/2225182?uid=3739584&uid=2&uid=4&uid=3739256&sid=21106714957033.
[15] The lowest numbers for the net labor share came in the depths of the Great Depression. In the post-war period, the lowest numbers belong to the Great RecessionA recession is a significant and sustained decline in the economy. Typically, a recession lasts longer than six months, but recovery from a recession can take a few years. .
[16] Howard Gleckman, Forbes, Who Pays The Corporate Income Tax? Workers Bear The Burden, Too, Sep. 13, 2012, http://www.forbes.com/sites/beltway/2012/09/13/who-pays-the-corporate-income-tax-workers-bear-the-burden-too/.
[17] Jim Nunns, Tax Policy Center, How TPC Distributes the Corporate Income Tax, Sep. 13, 2012, http://www.taxpolicycenter.org/UploadedPDF/412651-Tax-Model-Corporate-Tax-Incidence.pdf.
[18] Justin Wolfers, The New York Times, Fellow Economists Express Skepticism About Thomas Piketty, Oct. 14, 2014, http://www.nytimes.com/2014/10/15/upshot/fellow-economists-express-skepticism-about-thomas-piketty.html.
[19] Thomas Piketty, About Capital in the Twenty-First Century, http://piketty.pse.ens.fr/files/Piketty2015AER.pdf.
[20] Rognlie, supra note 6.
[21] Lawrence Mishel, Economic Policy Institute, The Wedges Between Productivity and Median Wage Growth, Apr. 26 2012, http://www.epi.org/publication/ib330-productivity-vs-compensation/.
