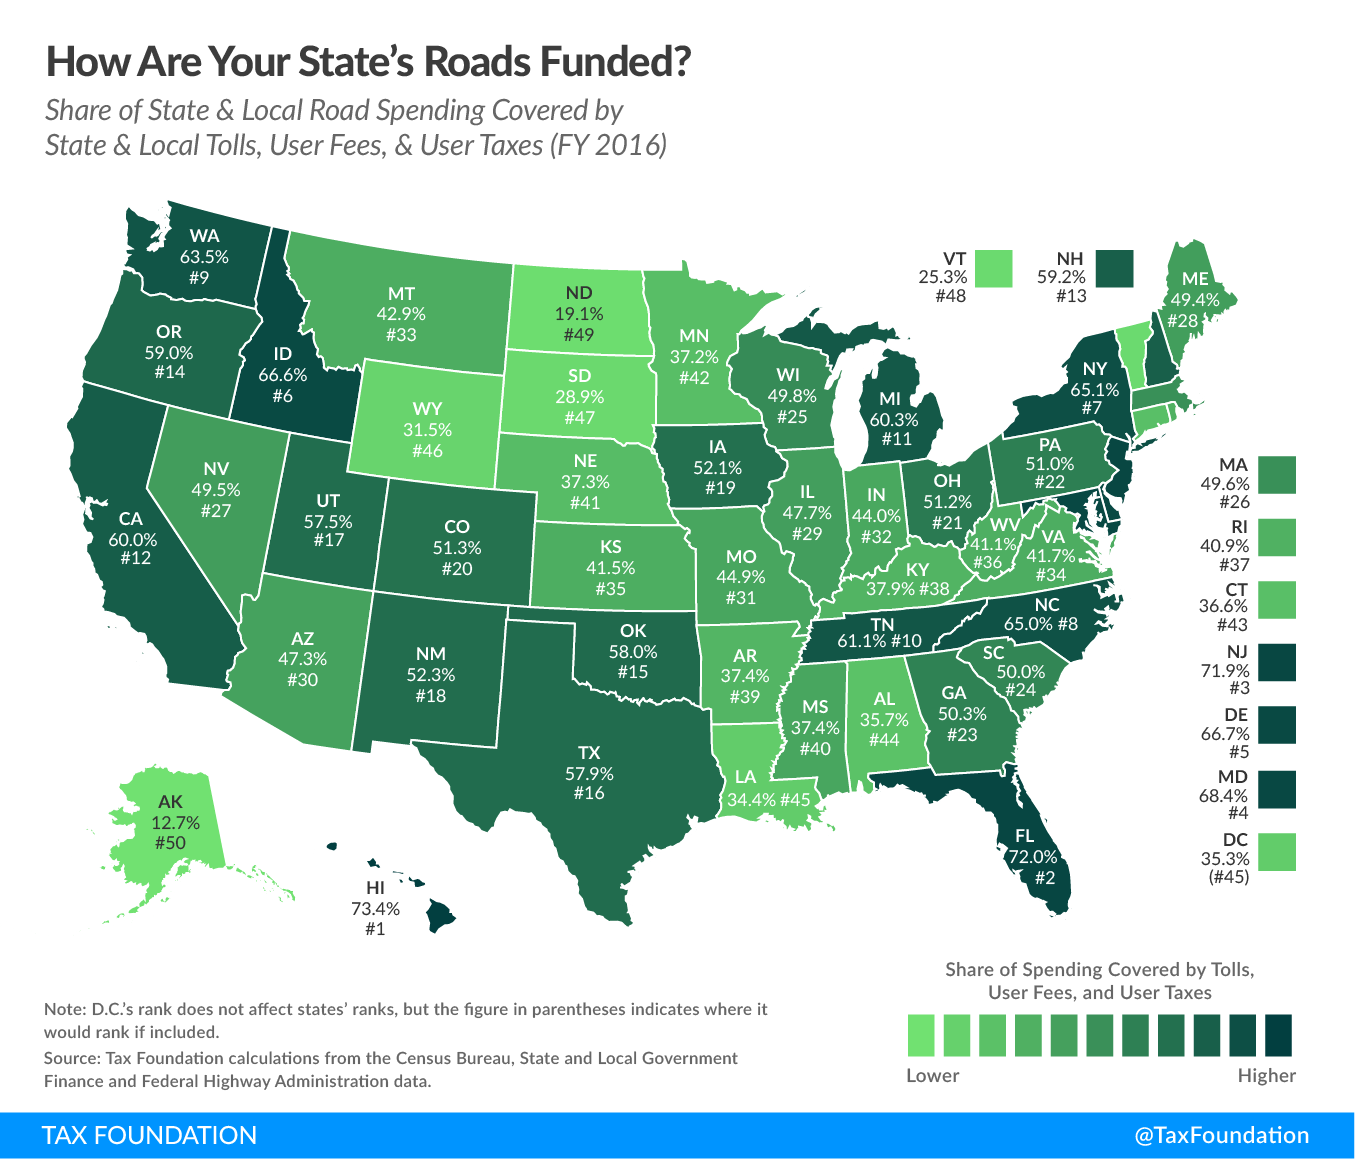
When we think of road funding, we tend to think of the taxes we pay at the pump. Gas taxes are largely used to fund infrastructure maintenance and new projects, but the amount of state and local road spending covered by gas taxes, tolls, user fees, and user taxes varies widely among states. It ranges from only 6.9 percent in Alaska to 71 percent in Hawaii. In the contiguous 48 states, North Carolina relies the most on dedicated transportation revenues (63.6 percent), while North Dakota relies on them the least (17.5 percent). States like Alaska and North Dakota keep their transportation taxes low in the same way that they keep all taxes on state residents low—by exporting taxes, primarily through the severance taxA tax is a mandatory payment or charge collected by local, state, and national governments from individuals or businesses to cover the costs of general government services, goods, and activities. .
States that cannot rely on extractive industries for funding have tried a variety of funding sources to come up with the money necessary for infrastructure upkeep. Though politically unpopular, gas taxes, fees, and tolls are all relatively good applications of the benefit principle—the idea that the people paying the taxes and fees should be the ones to benefit from them. However, federal and most state gas taxes are not indexed for inflation. This means that, as time goes on and inflationInflation is when the general price of goods and services increases across the economy, reducing the purchasing power of a currency and the value of certain assets. The same paycheck covers less goods, services, and bills. It is sometimes referred to as a “hidden tax,” as it leaves taxpayers less well-off due to higher costs and “bracket creep,” while increasing the government’s spending power. rises, the real value of the gas taxA gas tax is commonly used to describe the variety of taxes levied on gasoline at both the federal and state levels, to provide funds for highway repair and maintenance, as well as for other government infrastructure projects. These taxes are levied in a few ways, including per-gallon excise taxes, excise taxes imposed on wholesalers, and general sales taxes that apply to the purchase of gasoline. decreases even as the nominal rate remains the same, leaving states with budget shortfalls and gaps in infrastructure funding. States should seek to fund infrastructure through user taxes and fees as much as possible, internalizing the costs associated with using the state’s transportation systems.
For a more detailed breakdown of where states’ user-based road funding comes from, check out the table below.
|
Note: D.C.’s ranks do not affect states’ ranks, but the figures in parentheses indicate where it would rank if included. Source: Tax Foundation calculations from the Census Bureau, State and Local Government Finance and Federal Highway Administration data. |
|||||
| State | Gasoline & License Taxes | Rank | Tolls & User Fees | Total Tolls, User Fees, & User Taxes | Rank |
|---|---|---|---|---|---|
| U.S. | 41.0% | 12.3% | 53.4% | ||
| Ala. | 34.6% | 32 | 1.1% | 35.7% | 44 |
| Alaska | 6.9% | 50 | 5.7% | 12.7% | 50 |
| Ariz. | 45.8% | 16 | 1.5% | 47.3% | 30 |
| Ark. | 36.8% | 26 | 0.6% | 37.4% | 39 |
| Calif. | 51.3% | 8 | 8.7% | 60.0% | 12 |
| Colo. | 42.9% | 22 | 8.3% | 51.3% | 20 |
| Conn. | 33.0% | 37 | 3.7% | 36.6% | 43 |
| Del. | 23.4% | 48 | 43.3% | 66.7% | 5 |
| Fla. | 49.9% | 12 | 22.1% | 72.0% | 2 |
| Ga. | 48.8% | 13 | 1.5% | 50.3% | 23 |
| Hawaii | 71.0% | 1 | 2.4% | 73.4% | 1 |
| Idaho | 62.1% | 3 | 4.5% | 66.6% | 6 |
| Ill. | 34.0% | 34 | 13.7% | 47.7% | 29 |
| Ind. | 43.3% | 20 | 0.7% | 44.0% | 32 |
| Iowa | 50.8% | 9 | 1.4% | 52.1% | 19 |
| Kans. | 34.9% | 30 | 6.6% | 41.5% | 35 |
| Ky. | 34.7% | 31 | 3.2% | 37.9% | 38 |
| La. | 31.7% | 42 | 2.7% | 34.4% | 45 |
| Maine | 34.6% | 33 | 14.8% | 49.4% | 28 |
| Md. | 43.7% | 19 | 24.7% | 68.4% | 4 |
| Mass. | 32.2% | 39 | 17.3% | 49.6% | 26 |
| Mich. | 53.9% | 5 | 6.4% | 60.3% | 11 |
| Minn. | 32.7% | 38 | 4.6% | 37.2% | 42 |
| Miss. | 36.7% | 27 | 0.7% | 37.4% | 40 |
| Mo. | 42.2% | 24 | 2.7% | 44.9% | 31 |
| Mont. | 38.9% | 25 | 4.0% | 42.9% | 33 |
| Nebr. | 34.0% | 35 | 3.4% | 37.3% | 41 |
| Nev. | 48.5% | 14 | 1.0% | 49.5% | 27 |
| N.H. | 36.0% | 29 | 23.1% | 59.2% | 13 |
| N.J. | 25.2% | 46 | 46.8% | 71.9% | 3 |
| N.M. | 50.1% | 11 | 2.2% | 52.3% | 18 |
| N.Y. | 26.2% | 45 | 38.9% | 65.1% | 7 |
| N.C. | 63.6% | 2 | 1.4% | 65.0% | 8 |
| N.D. | 17.5% | 49 | 1.5% | 19.1% | 49 |
| Ohio | 44.9% | 17 | 6.3% | 51.2% | 21 |
| Okla. | 46.2% | 15 | 11.8% | 58.0% | 15 |
| Ore. | 51.5% | 7 | 7.5% | 59.0% | 14 |
| Pa. | 36.4% | 28 | 14.6% | 51.0% | 22 |
| R.I. | 31.8% | 41 | 9.1% | 40.9% | 37 |
| S.C. | 43.9% | 18 | 6.1% | 50.0% | 24 |
| S.D. | 27.6% | 44 | 1.3% | 28.9% | 47 |
| Tenn. | 60.6% | 4 | 0.5% | 61.1% | 10 |
| Tex. | 43.0% | 21 | 15.0% | 57.9% | 16 |
| Utah | 53.0% | 6 | 4.6% | 57.5% | 17 |
| Vt. | 23.6% | 47 | 1.7% | 25.3% | 48 |
| Va. | 33.8% | 36 | 7.9% | 41.7% | 34 |
| Wash. | 50.5% | 10 | 13.0% | 63.5% | 9 |
| W.Va. | 32.0% | 40 | 9.1% | 41.1% | 36 |
| Wis. | 42.7% | 23 | 7.1% | 49.8% | 25 |
| Wyo. | 30.2% | 43 | 1.3% | 31.5% | 46 |
| D.C. | 22.4% | (49) | 12.9% | 35.3% | (45) |