Key Findings
- The Tax Cuts and Jobs Act, by lowering the corporate taxA tax is a mandatory payment or charge collected by local, state, and national governments from individuals or businesses to cover the costs of general government services, goods, and activities. rate from 35 percent to 21 percent, will cause two things to happen: a lower tax burden on old capital, leading to higher profits on existing investments; and a lower tax burden on new capital, incentivizing businesses to make new investments.
- Higher profits on existing investments provide a cash infusion to those businesses, which we expect will, at least in part, be returned to shareholders through stock buybacks.
- Some of the largest shareholders and beneficiaries of stock buybacks are institutional investors, such as pension funds for public-sector employees, and other types of retirement funds.
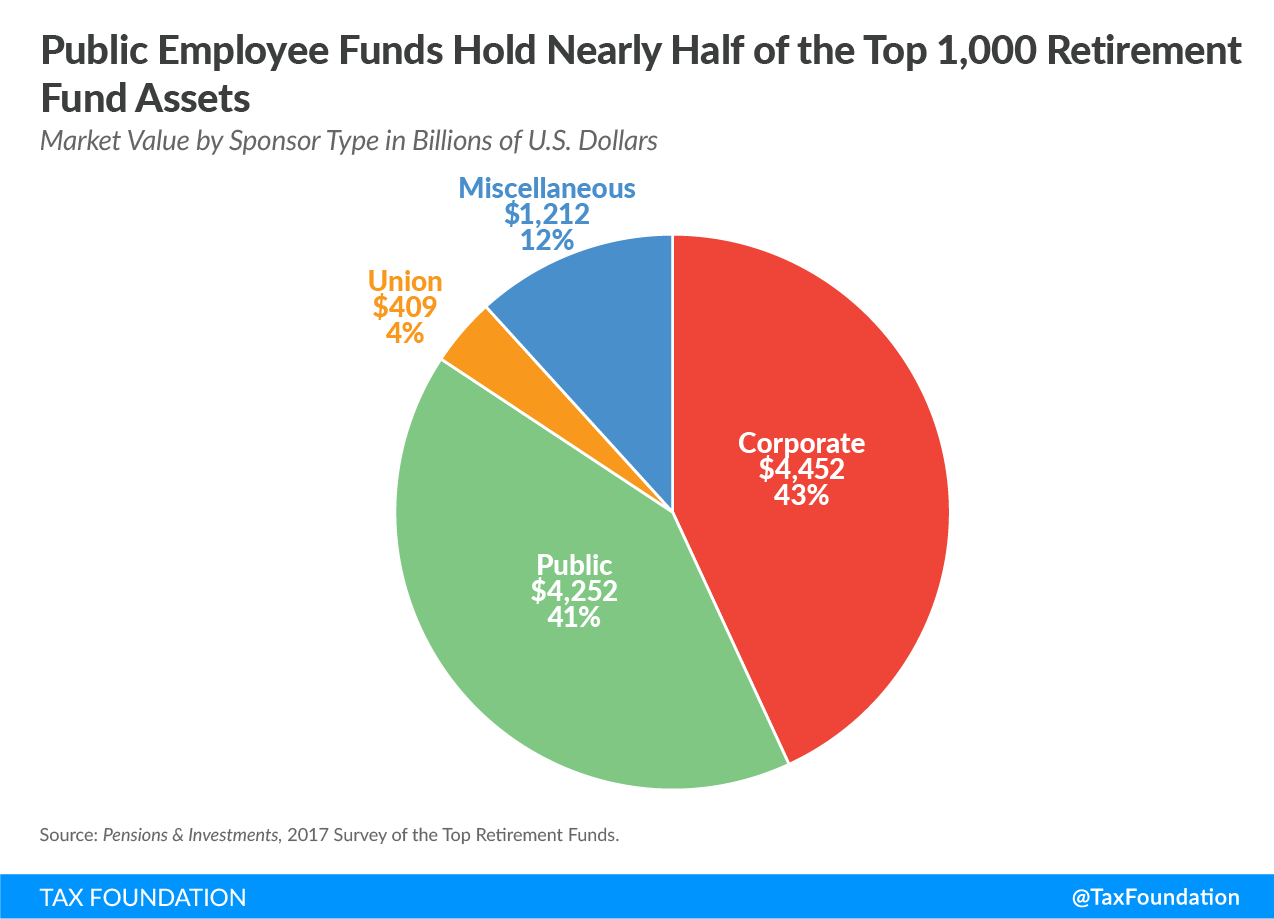
- As of 2017, the top 1,000 retirement funds in the United States had total assets of $10.3 trillion. Public funds, such as those benefiting teachers, police officers, and government workers, held 41 percent of these assets, or $4.25 trillion. Union funds, representing private-sector union employees, held 4 percent, or $0.41 trillion, and miscellaneous funds, such as those benefiting university and hospital workers, held 12 percent, or $1.21 trillion.
- Stock buybacks do not displace long-term investment. Rather, stock buybacks can supplement capital investments, as they can help reallocate capital from old, established firms to new and innovative firms.
- When thinking through how stock buybacks will affect the economy, it is important to remember that it is the final use of money that determines the economic impact, not the initial.
Introduction
The Tax Cuts and Jobs Act (TCJA), passed in December 2017, made many significant changes to the federal tax code, including lowering the corporate tax rate from 35 percent to 21 percent. This change has freed up cash flow for many firms, some of which are choosing to return portions of that cash to shareholders through one-time payments, or stock buybacks.
The TCJA is expected to boost investment, leading to a larger economy, higher wages, and more jobs, but these expectations will not be realized immediately. It will take time for the long-run economic effects of the TCJA to develop, as it takes time for companies to plan and build new investments, and additional time for workers to use those new investments to become more productive, translating to higher wages.
On the other hand, stock buybacks are readily visible, and unfortunately some have misunderstood stock buybacks to be taking place at the expense of long-term investments. Stock buybacks supplement capital investments, as they can help reallocate capital from old, established firms to new and innovative ones. Many also misunderstand who shareholders are, or who owns corporate stock. Some of the largest shareholders are institutional investors, such as those managing pension plans and retirement accounts.
This paper reviews the economic literature as it relates to stock buybacks and discusses who owns U.S. stocks.
Cutting the Corporate Rate Benefits New and Old Capital
By lowering the corporate tax rate to 21 percent, the TCJA will cause two things to happen: higher profits on old investments, and an increased incentive for businesses to make new investments. In other words, companies will have a lower tax burden on old capital, or investments they made in the past, and they will have a lower tax burden on new capital, or investments they plan to make in the future.
By reducing the corporate income tax rate, the TCJA lowered the cost of capital. Investments that were not viable under the old rate may now be worth pursuing at the lower rate. We anticipate investment to increase because of the lower cost of capital, not because companies have more cash.
Our model estimates that the new tax law will eventually boost the capital stock by 4.8 percent.[1] It’s important to note that this capital stock growth won’t occur instantly; it will take time for companies to plan new investments, for the investments to increase productivity, and for the higher productivity to boost wage growth. As a result of the building out of the capital stock, our model estimates that wages will increase by 1.5 percent in the long run, and that the economy will add 339,000 full-time jobs.
On the other hand, lowering the tax burden on old capital delivers a higher profit than previously expected on these investments. Companies are likely to share these higher-than-expected profits with their shareholders, whether through increased dividend payments or stock buybacks.[2] When thinking through how this is likely to affect the economy, it is important to remember that it is the final use of money that determines the economic impact, not the initial.
Stock Buyback Basics
When companies have more cash than they can use for their current investment opportunities, they can either hold on to that excess cash, or return it to shareholders.[3] One way firms can return excess cash is to repurchase some of their own stock; this option is advantageous because the company does not have to commit to repurchases, allowing flexibility for timing and amount, and it doesn’t set up an expectation that the distribution will occur on a regular basis (like dividend payments).[4] Economic literature suggests that we should expect firms with high levels of excess cash flow to repurchase stock.[5]
Companies generally only consider engaging in stock buybacks when they have exhausted their investment opportunities and met their other obligations, meaning it is residual cash flow that is used for buybacks.[6] In other words, buybacks allow firms to increase payouts when they have more cash than investment opportunities.
Imagine a company with $1,000 in assets, $100 of earnings, and 100 outstanding shares. Suppose this company does not have any investment opportunities and so chooses to repurchase 50 shares at $10 each. Once said and done, the company will have returned a total of $500 to its shareholders. This would reduce the company’s assets by $500, to $500, and reduce the number of outstanding shares to 50. In this hypothetical illustration, the company’s return on asset (ROA) has increased from 10 percent to 20 percent, and earnings per share (EPS) from $1 to $2, indicating that those who retained their shares now have a comparatively larger claim on the company’s earnings. Assuming that earnings don’t fall, shareholders who retained their shares this year could enjoy gains in the future and shareholders who sold their shares now have a combined $500.
|
Source: Author’s calculations |
||
| Before Buyback | After Buyback | |
|---|---|---|
| Assets | $1,000 | $500 |
| Earnings | $100 | $100 |
| Outstanding Shares | 100 | 50 |
| ROA (Earnings/Assets) | 10% | 20% |
| EPS (Earnings/Shares) | $1 | $2 |
Buyback Proceeds Can Be Used for Consumption or Investment
When shareholders exchange their shares for cash they can use the proceeds for two types of expenditures: consumption or investment. These two forms of expenditure have different economic effects. Consumption doesn’t contribute to long-run economic growth, while investment drives long-run economic growth.[7]
Suppose shareholders choose to use their cash for immediate consumption; perhaps they purchase a new car, eat out at restaurants more than usual, or go on shopping sprees. These purchases would not contribute to long-run economic growth, though they would have short-term impacts.[8] This is because long-run growth, in the neoclassical framework, is driven by people’s willingness to work more and to invest more;[9] purchasing more does neither.
If, instead, shareholders use their buyback proceeds to make new investments, this would drive economic growth, as investment leads to capital accumulation, higher productivity, and higher standards of living. In some instances, buybacks can lead to more efficient capital allocation. Buybacks allow shareholders to redirect their funds from older, established firms to younger, innovative firms with high growth potential. Investment in firms like these can lead to accelerated wage growth and output across the economy, as these firms more than proportionately contribute to the nation’s overall capital stock relative to their initial size.[10]
Stay informed on the tax policies impacting you.
Subscribe to get insights from our trusted experts delivered straight to your inbox.
SubscribeRecent Research into the Effects of Stock Buybacks
A recent Harvard Business Review article examined some arguments against stock buybacks and found the arguments to be lacking. The research found that stock buybacks do not deprive firms of capital that they would otherwise use to invest; rather, firms have plenty of cash flow for additional investment.[11] The article also shows that stock buybacks do not harm long-term economic growth. Instead, stock buybacks are a normal function of the economy, and they can facilitate long-term investment by redirecting funds from lower growth firms to higher growth firms.
Companies have plenty of cash flow, and as discussed above, reducing the corporate income taxA corporate income tax (CIT) is levied by federal and state governments on business profits. Many companies are not subject to the CIT because they are taxed as pass-through businesses, with income reportable under the individual income tax. rate has freed up additional cash flow for businesses to use. Data from 2016 shows that firms in the S&P 500 had at least $2.8 trillion on hand available for investment spending.[12] These same firms are spending more on research and development (R&D) and capital expenditures (CAPEX) as a percentage of revenue than they have since the 1990s. For example, firms spent about 8.5 percent of their revenue on R&D and CAPEX in 2016, nearing the peak reached in the 1990s.[13]
By engaging in stock buybacks, larger, established firms free up cash that can be used for more productive purposes elsewhere, such as investment in innovative and quickly growing small firms. Evidence indicates this does occur: Over the decade from 2007 to 2016, non-S&P 500 firms received net shareholder inflows of $407 billion, or 11 percent of the net shareholder payouts by S&P 500 firms, and a considerable portion is also reinvested in Initial Public Offerings (IPOs) and nonpublic businesses.[14] Non-S&P 500 firms are usually smaller, more innovative, and have greater long-term growth prospects than the established firms in the S&P 500. From the Harvard Business Review article:
Capital flowing to S&P 500 shareholders does not go down the economic drain: Shareholders use much of the cash, we know, to invest in smaller public and private firms, supporting innovation and job growth throughout the economy. The charge that S&P 500 shareholder payouts are starving the U.S. economy of investment does not stand up to the data.[15]
The perception that the choice is between stock buybacks or investment is false.[16] Companies generally only consider engaging in stock buybacks when they have exhausted their investment opportunities: it is residual cash flow, or what is left over after companies have made their investments, that is used for buybacks.[17] For companies with more cash than investment opportunities, the real choice is between buybacks or having the cash sit effectively idle. Focusing attention on the initial occurrence of a stock buyback misses the greater context: stock buybacks are a normal function that can help transfer capital to new and growing firms, leading to broad, long-run benefits.
Retirement Accounts Hold the Majority of Corporate Stock
Some of the largest shareholders are institutional investors, such as those managing public pensions for teachers or firefighters, and other types of retirement accounts.
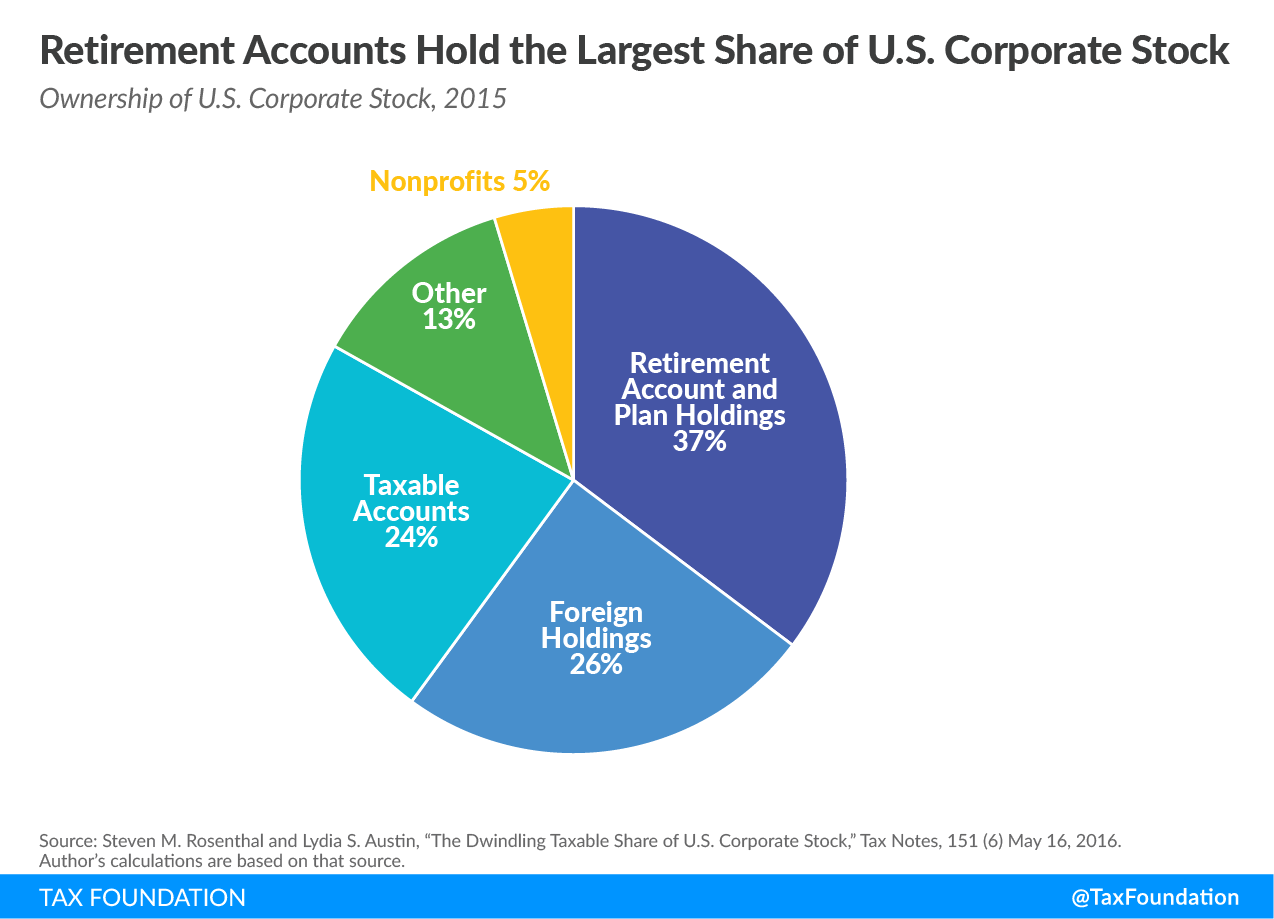
Though middle-class Americans don’t report many dividends or capital gains on their tax returns, middle-class Americans do earn returns to capital through 401(k)s and pensions. These individuals put their capital in retirement accounts, where it enjoys proper tax treatment. Estimates show, for example, that in 2015 the total value of outstanding U.S. corporate stock was $22.8 trillion.[18] Retirement accounts held the largest share of outstanding corporate stock, at 37 percent, or about $8.4 trillion.[19]
Stay informed on the tax policies impacting you.
Subscribe to get insights from our trusted experts delivered straight to your inbox.
SubscribeFor example, CalPERS, the public pension fund for California state employees, is the second largest retirement fund in the United States, with a market value of $336.7 billion in 2017, second only to the Federal Retirement Thrift Investment Board, as cited in Pensions & Investments “2017 Survey of the Top Retirement Funds.”[20] The plan supports 1.9 million members, 38 percent of whom are employed by schools in the state.[21] Improvements in the economy, and improvements in the stock market, broadly benefit public pensions and the employees vested in those funds.
However, even though pensions and retirement accounts provide the middle class with access to the stock market, stock ownership remains skewed towards higher-income individuals. For example, in 2016, estimates show that of the stocks directly or indirectly held by U.S. households, the top 1 percent of households owned 40.3 percent, the next 9 percent owned 43.6 percent, and the bottom 90 percent owned 16 percent.[22] Ownership of pension accounts, which is included in total stock ownership, follows a similar pattern. The top 1 percent holds 13.7 percent of pension assets, the next 9 percent holds 51.2 percent, and the bottom 90 percent holds 35.2 percent.[23]
The Top 1,000 Retirement Funds in Depth
The Pensions & Investments survey of the 1,000 largest U.S. retirement plan sponsors provides a picture of stock ownership through retirement funds. Total assets of the top 1,000 plans reached $10.326 trillion in the year ending September 30, 2017.
Public funds, such as those benefiting teachers, police officers, and government workers, held 41 percent of retirement assets, or $4.25 trillion. Union funds held 4 percent, or $0.41 trillion, and miscellaneous funds, such as those benefiting university and hospital workers, held 12 percent, or $1.21 trillion. Corporate funds held 43 percent of retirement assets, or $4.5 trillion. The survey shows that plans administered by all four types of sponsors are heavily invested in the U.S. stock market.
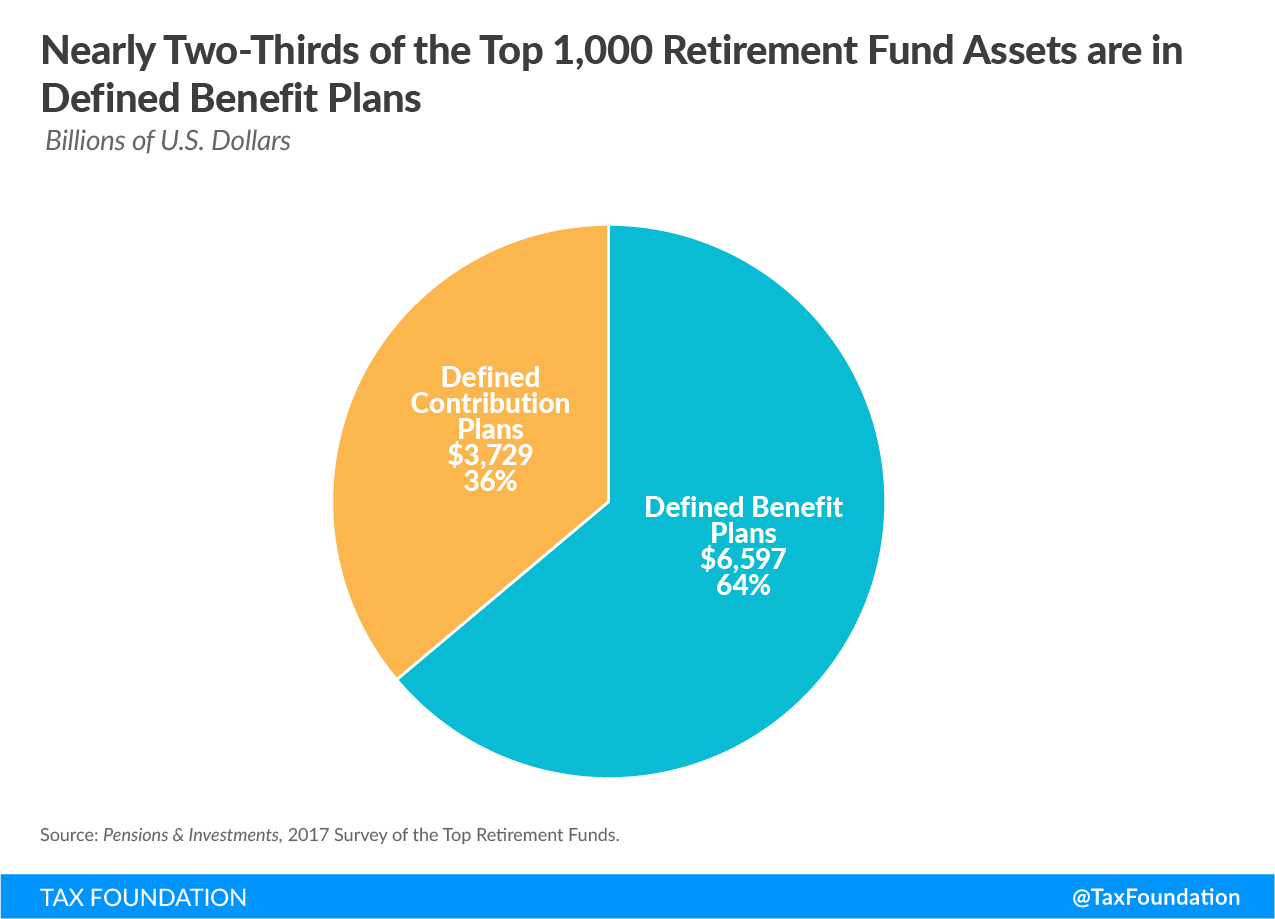
Many retirement funds in the survey reported both defined benefit and defined contribution plans, 842 and 834, respectively. Defined benefit plans had a combined total market value of $6.6 trillion, while defined contribution plans totaled $3.7 trillion.
Not all the retirement funds in the survey reported their asset allocation. However, many funds did, and we can look at their responses to gauge involvement in the U.S. stock market. We should expect domestic stock and sponsoring company stock to be most affected by stock buybacks, while global equity and target date assets could be expected to have at least some potential to be affected by stock buybacks.[24]
Public-Sponsored Funds
Of the top 1,000 retirement funds in the United States, 198 are sponsored by public entities, such as state and local governments, which benefit teachers, state employees, police officers, and other public employees. Together, these plans reported a market value totaling $4.25 trillion in 2017, with $3.95 trillion in defined benefit plans and $0.3 trillion in defined contribution plans. Most public funds have defined benefit plans which promise retirees a lifetime annuity; few have transitioned to defined contribution plans which are controlled by employees, with employer contributions funded by the sponsor.
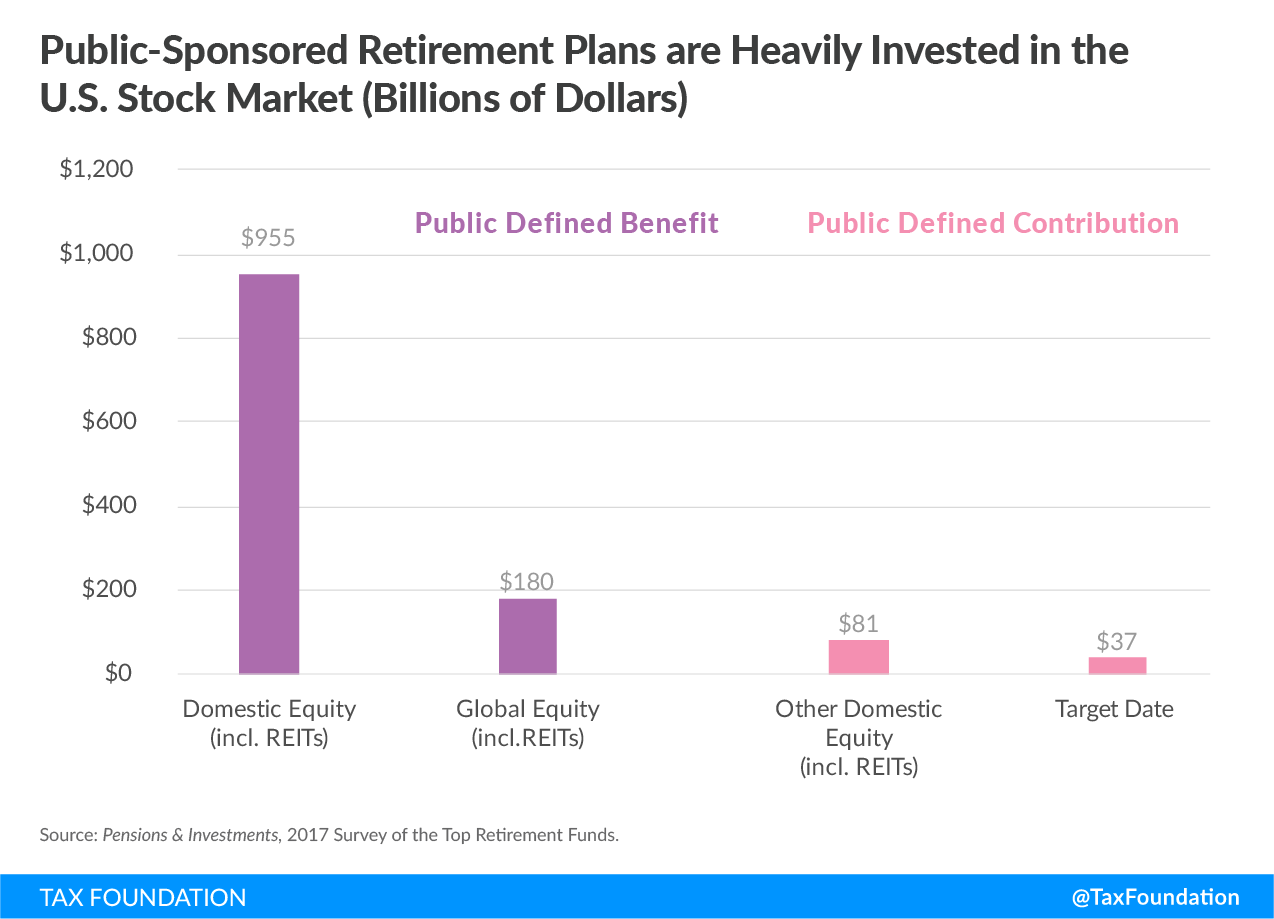
Fifty-five percent of public defined benefit funds and 51 percent of public defined contribution plans reported how their assets were allocated across different types of investment choices, detailing the investment of $3.86 trillion. With a reported $1.036 trillion in domestic equity and another $217 billion in assets with some exposure to the U.S. stock market, public pensions have the potential to be positively impacted by stock buybacks.
Union-Sponsored Funds
Union-sponsored funds make up 101 of the top 1,000 funds, reporting a total market value of $409 billion. These are the pension plans for private-sector union employees. Most of that, $338 billion, is in defined benefit plans, while the remaining $72 billion is in defined contribution plans.
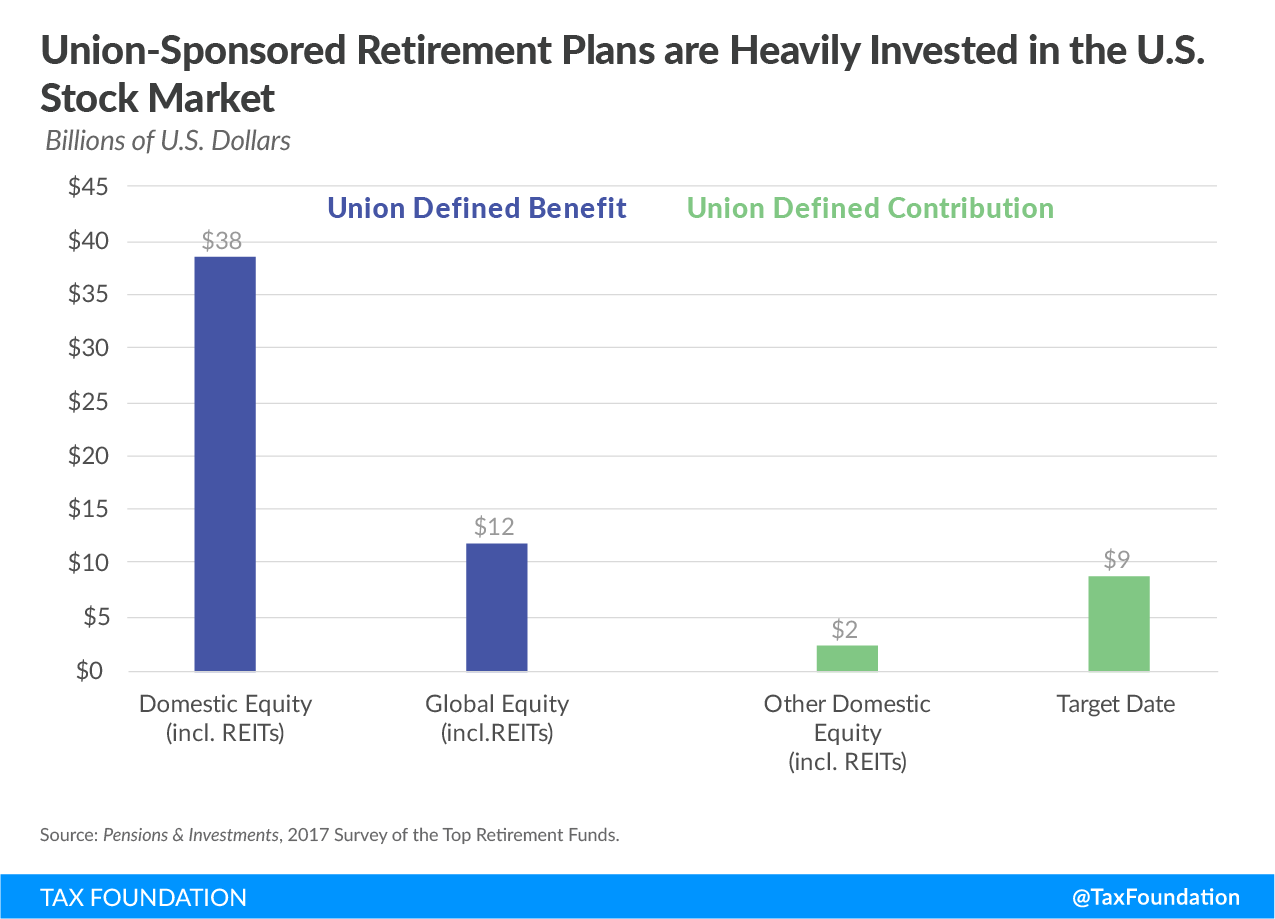
Few union-sponsored funds reported asset allocation: just 19 percent of defined benefit plans and 15 percent of defined contribution plans, detailing the investment of $152 billion. In these plans, we see significant investment in U.S. stocks, with about $40 billion reported in domestic equities and another $21 billion with some exposure to the U.S. stock market.
Corporate-Sponsored Funds
Corporate-sponsored funds account for 607 of the top 1,000 funds and $4.45 trillion in market value. Unlike the previous two categories, corporate sponsors report more assets in defined contribution plans ($2.53 trillion) than in defined benefit plans ($1.92 trillion).
Just 13 percent of corporate-defined contributions plans reported asset allocation, while 21 percent of corporate-defined benefit plans reported asset allocation, detailing the investment of $1.35 trillion. With a reported $366 billion in domestic equity, another $78 billion in sponsoring company stock, and $164 billion with at least some U.S. stock market exposure, these plans also stand to benefit from stock buybacks.
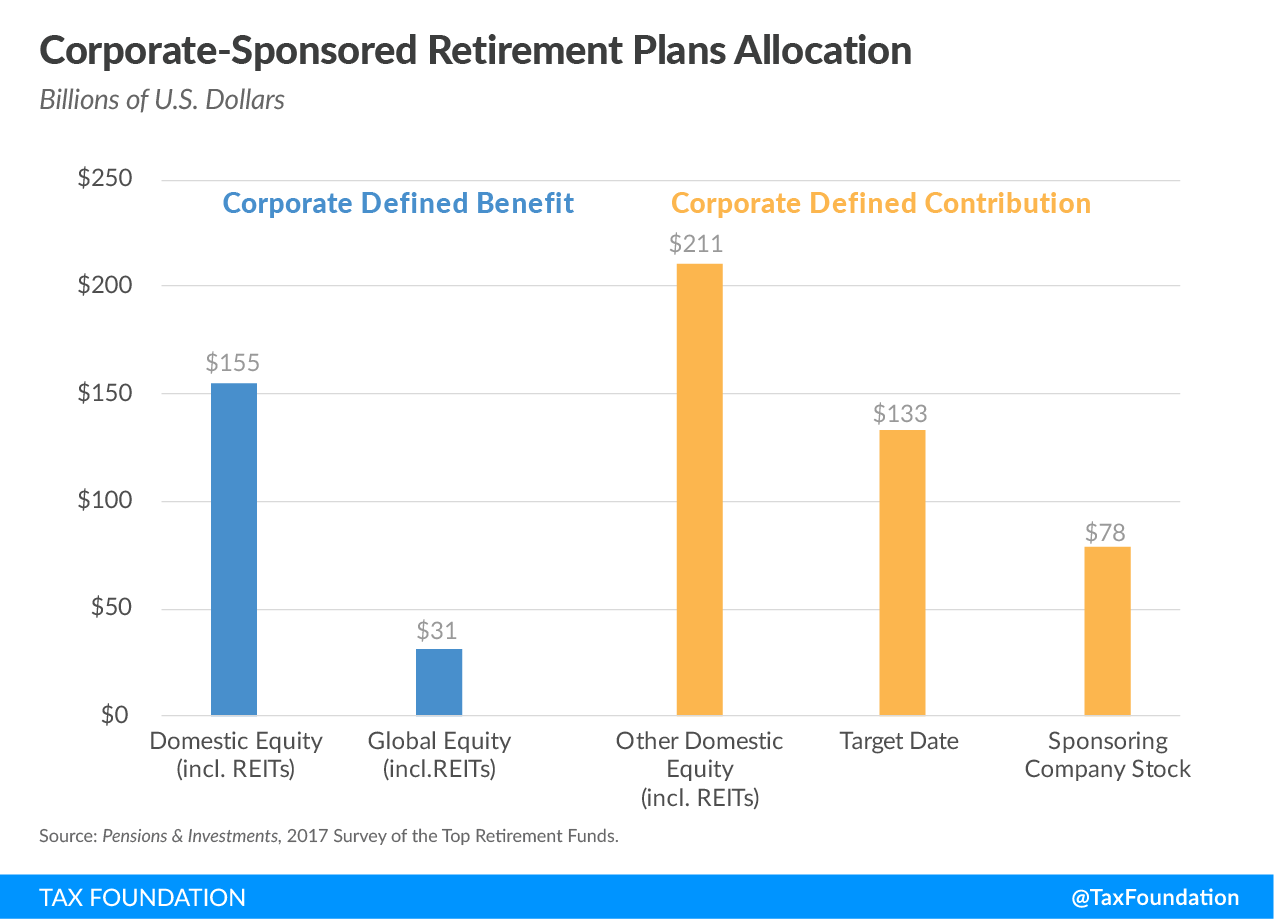
Of the reporting plans, 42 percent indicated that their plans included sponsoring company stock; across these companies, sponsoring company stock made up an average of nearly 15 percent of asset allocation.
Miscellaneous-Sponsored Funds
Hospitals, universities, nonprofits, and other miscellaneous plan sponsors account for the remaining 94 of the top 1,000 retirement funds, with a market value of $1.2 trillion. Like corporate-sponsored plans, the sponsors in the miscellaneous category report more assets in defined contribution plans ($828 million) than in defined benefit plans ($385 million).
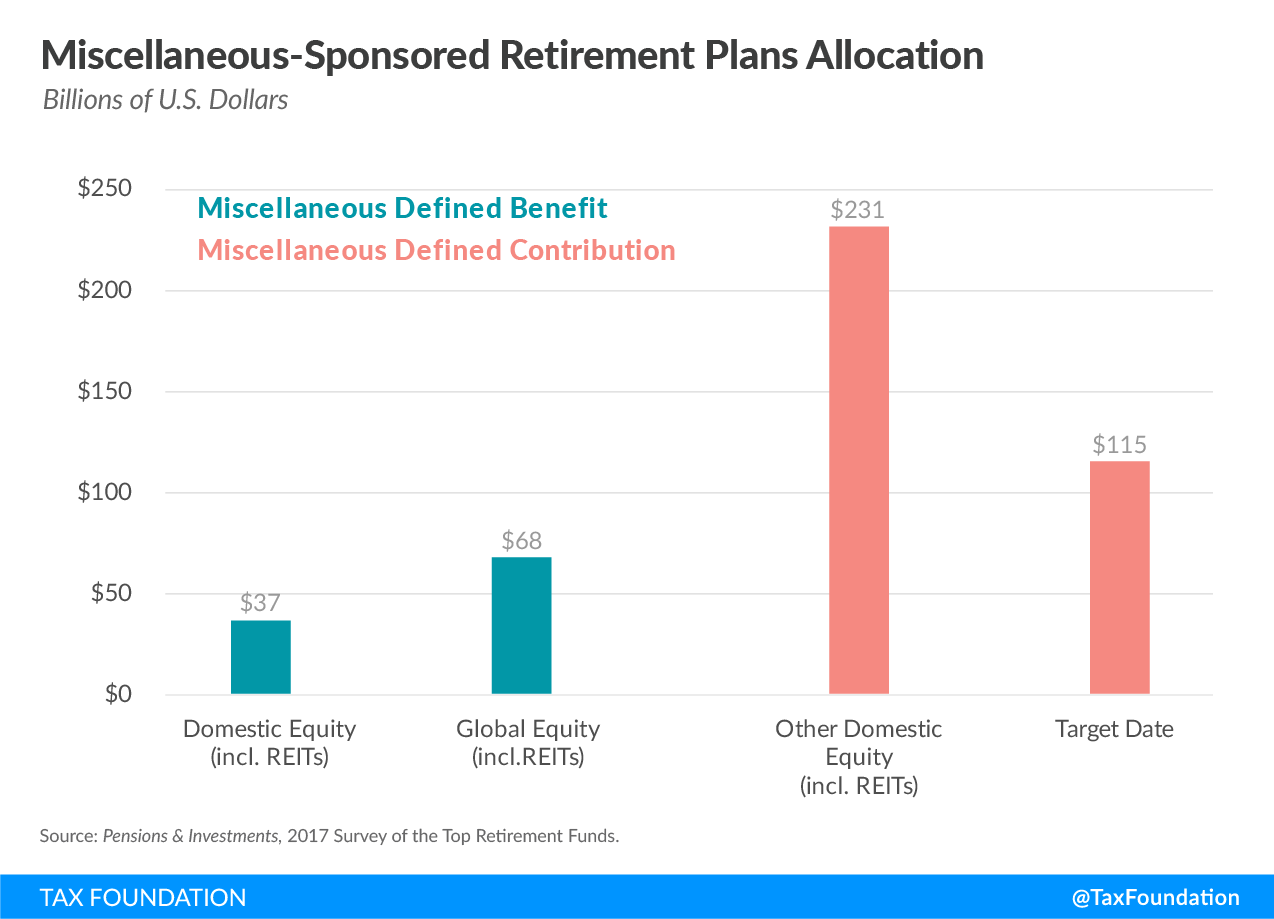
Seventeen percent of miscellaneous defined contribution plans and 15 percent of miscellaneous defined benefit plans reported their asset allocation, detailing the investment of $853 billion. Like the others, the miscellaneous sponsors reported that U.S. stocks comprise a significant portion of their retirement plan assets; $268 billion in domestic equity and another $183 billion with at least some exposure to the U.S. stock market.
Stay informed on the tax policies impacting you.
Subscribe to get insights from our trusted experts delivered straight to your inbox.
SubscribeConclusion
The Tax Cuts and Jobs Act lowered the corporate tax rate from 35 percent to 21 percent. This has left many companies with an unexpected increase in cash flow, which we expect will, at least in part, be returned to shareholders through stock buybacks. It is important to understand that stock buybacks do not displace long-term investment. Rather, stock buybacks can supplement capital investments, as they can help reallocate capital from old, established firms to new and innovative firms.
Some of the largest of shareholders are institutional investors, sponsoring retirement funds on behalf of a wide range of employees. When thinking through how stock buybacks will affect the economy, it is important to remember that it is the final use of money that determines the economic impact, not the initial.
The reforms made by the Tax Cuts and Jobs Act are expected to boost investment, raise wages, and increase the size of the economy in the long run because of the effect on the cost of new capital investment. It will take years for these changes to manifest, and in the meantime, companies are likely to return excess cash from profits on old investments to their shareholders.
Notes
[1] Tax Foundation staff, “Preliminary Details and Analysis of the Tax Cuts and Jobs Act,” Dec. 18, 2017, https://taxfoundation.org/final-tax-cuts-and-jobs-act-details-analysis/.
[2] Nicole Kaeding, “Missing Some Context on Stock Buybacks,” Tax Foundation, May 8, 2018, https://taxfoundation.org/missing-context-stock-buybacks/.
[3] Amy K. Dittmar, “Why Do Firms Repurchase Stock?” The Journal of Business 73(3), July 2000, 333. https://www.jstor.org/stable/pdf/10.1086/209646.pdf?refreqid=excelsior%3A674257221d8a74b4d6a2e94b53cf1461.
[4] Ibid.
[5] Ibid.
[6] Alon Brav, John R. Graham, Campbell R. Harvey, and Roni Michaely, “Payout Policy in the 21st Century,” Working Paper 9657, National Bureau of Economic Research, April 2003, http://www.nber.org/papers/w9657.pdf.
[7] Kyle Pomerleau and Scott Greenberg, “Taking Stock of the Tax Cut,” U.S. News & World Report, Feb. 26, 2018, https://www.usnews.com/opinion/economic-intelligence/articles/2018-02-26/is-the-tax-cuts-and-jobs-act-better-for-corporations-or-american-workers.
[8] Erica York, “Americans Consume Much More than They Invest,” Tax Foundation, Feb. 12, 2018, https://taxfoundation.org/americans-consume-more-invest-less/.
[9] Scott. A. Hodge, “Dynamic ScoringDynamic scoring estimates the effect of tax changes on key economic factors, such as jobs, wages, investment, federal revenue, and GDP. It is a tool policymakers can use to differentiate between tax changes that look similar using conventional scoring but have vastly different effects on economic growth. Made Simple,” Tax Foundation, Feb. 11, 2015, https://taxfoundation.org/dynamic-scoring-made-simple.
[10] Nicholas Anderson and Nicole Kaeding, “Stock Buybacks Don’t Hinder Investment Spending,” Tax Foundation, June 19, 2018, https://taxfoundation.org/stock-buybacks-dont-hinder-investment-spending/.
[11] Jesse M. Fried and Charles C.Y. Wang, “Are Buybacks Really Shortchanging Investment?,” Harvard Business Review, March-April 2018, https://hbr.org/2018/03/are-buybacks-really-shortchanging-investment.
[12] Ibid.
[13] Ibid.
[14] Ibid.
[15] Ibid.
[16] Nicholas Anderson and Erica York, “What the Main Criticisms of Stock Buybacks Get Wrong,” Tax Foundation, Aug. 6, 2018, https://taxfoundation.org/main-criticisms-stock-buybacks-get-wrong/.
[17] Alon Brav, John R. Graham, Campbell R. Harvey, Roni Michaely, “Payout Policy in the 21st Century.”
[18] Steven M. Rosenthal and Lydia S. Austin, “The Dwindling Taxable Share of U.S. Corporate Stock,” Tax Notes 151(6), May 16, 2016. http://www.taxhistory.org/www/features.nsf/Articles/ECCBAE00C0F4686785257FB500405811?OpenDocument.
[19] Ibid.
[20] Pensions & Investments, “2017 Survey of the Top Retirement Funds”
[21] California Public Employees’ Retirement System, “CalPERS Facts,” https://www.calpers.ca.gov/page/home.
[22] Edward N. Wolff, “Household Wealth Trends in The United States, 1962 To 2016:
Has Middle Class Wealth Recovered?” Working Paper 24085, National Bureau of Economic Research, November 2017, 53, http://www.nber.org/papers/w24085.
[23] Ibid.
[24] Global stocks invest primarily in foreign companies but may also invest in U.S. companies. See U.S. Securities and Exchange Commission, “International Investing,” Dec. 7, 2016, https://www.sec.gov/reportspubs/investor-publications/investorpubsininvesthtm.html. Target date assets divide investments across an asset allocation that typically includes stocks. See U.S. Securities and Exchange Commission, “Investor Bulletin: Target Date Retirement Funds,” May 1, 2010, https://www.sec.gov/investor/alerts/tdf.htm.
Share this article