


Key Findings
- The gap between statutory rates and average effective taxA tax is a mandatory payment or charge collected by local, state, and national governments from individuals or businesses to cover the costs of general government services, goods, and activities. rates for personal income tax (PIT) in the European Union varies significantly, affecting the efficiency and simplicity of the tax system.
- Simplified tax systems, with fewer deductions and exemptions, combined with broader bases help reduce tax avoidance while improving efficiency in revenue collection.
- Those EU Member States with a smaller gap between statutory and average effective tax rates for PIT enjoy higher tax competitiveness, which in turn helps drive investment and economic growth.
- Increasing tax rates without simplifying the system may not always result in a proportional increase in tax revenues, due to changes in incentives and their effect on taxpayer behavior.
- Keeping marginal and average effective tax rates as aligned as possible reduces economic distortions and facilitates tax certainty for companies and individuals, improving the efficiency of the tax system and reducing its negative impact on production.
- EU Member States like Spain and Germany have reached a high tax rate threshold. As a result, additional increases in statutory rates for PIT do not generate a significant increase in tax revenues, a scenario that may be described as a Laffer Curve effect.
Introduction
One of the most important characteristics of any tax system is simplicity. A tax system is simple when it is based on few, broad-based taxes. In other words, it has clear rules and little complexity. This also means that tax systems should refrain from adding a myriad of exceptions and special cases that hinder the overall comprehensiveness of the system.
As described by Albi et al. (2018),[1] simple tax systems carry several advantages:
- Simpler tax systems minimize the distortion of economic activity and allow for lower statutory rates by broadening the tax baseThe tax base is the total amount of income, property, assets, consumption, transactions, or other economic activity subject to taxation by a tax authority. A narrow tax base is non-neutral and inefficient. A broad tax base reduces tax administration costs and allows more revenue to be raised at lower rates. . When tax systems are complex, this can encourage tax avoidance or evasion through loopholes. A simplified tax system can reduce these distortions by making the tax structure more transparent and predictable. This not only leads to more efficient allocation of resources but also enables the government to set lower statutory tax rates because the broader base ensures sufficient revenue without excessively high rates. This can further stimulate economic activity by reducing the tax burden on businesses and individuals.
- Simpler tax systems reduce the burden of tax compliance. This refers to the costs and efforts that individuals and businesses must undertake to comply with their tax obligations. In a complex system, taxpayers can face significant challenges to understand and comply with tax rules. This creates the need to divert an increasing amount of resources to consulting and advisory groups, while forcing entrepreneurs and individuals to devote significant time and resources to ensure compliance. Under a simplified tax system, the rules are clearer and easier to follow, which reduces these overhead costs and makes the process of filing and paying taxes more efficient for all parties involved.
- Simpler taxes reduce the risk of tax fraud. Complex tax systems with multiple deductions, exemptions, and special credits often leave unintended loopholes that can be used to avoid taxes. In contrast, a simpler, more transparent system reduces the opportunity for avoidance, because straightforward rules are easier to monitor and comply with and their general application makes avoidance less likely. Simplification also facilitates the work of tax auditors, who can therefore identify any irregularities more quickly and efficiently. This is why simpler tax systems are likely to increase potential revenue while also inducing a higher degree of fairness in the tax system.
- Simpler tax systems have lower administrative and revenue costs for the government. Managing a complex tax system requires deploying significant resources, such as people, technology, and time devoted to processing returns, conducting audits, handling disputes, etc. A simplified system reduces these costs by curbing the need for complicated, lengthy procedures. Also, simpler rules are less likely to result in errors and misunderstandings, thus reducing the burden on the tax system. This efficiency not only saves the government money, but also allows resources to be redirected to other priority areas, improving the overall efficiency of the public sector.
One of the key issues affecting the simplicity of a tax system is the presence of progressive taxes, which feature numerous brackets for the treatment of personal income. Progressive taxA progressive tax is one where the average tax burden increases with income. High-income families pay a disproportionate share of the tax burden, while low- and middle-income taxpayers shoulder a relatively small tax burden. systems impose higher tax rates on higher income levels, so individuals with higher incomes contribute a larger share of their earnings. However, this approach leads to greater complexity, which arises because taxpayers must then determine which portions of their income will be taxed at different rates. This can result in the development of tax planning strategies that generate distortions and reduce the actual tax burden. The presence of multiple tax bracketsA tax bracket is the range of incomes taxed at given rates, which typically differ depending on filing status. In a progressive individual or corporate income tax system, rates rise as income increases. There are seven federal individual income tax brackets; the federal corporate income tax system is flat. incentivizes taxpayers to seek ways to report income in a manner that minimizes their tax liability. This often involves using legal loopholes or complex financial arrangements, which can distort economic decisions and lead to a less efficient allocation of resources. Also, because more progressivity means less after-tax incomeAfter-tax income is the net amount of income available to invest, save, or consume after federal, state, and withholding taxes have been applied—your disposable income. Companies and, to a lesser extent, individuals, make economic decisions in light of how they can best maximize their earnings. , planning strategies will surely proliferate throughout the economy, thus creating a scenario where income is distributed in a distortive manner, to minimize tax obligations.
A tax rate, or tax bracket, refers to the percentage at which an individual or corporation is taxed. In a progressive tax system, different portions of income are taxed at different rates, with these rates typically increasing as income rises. The marginal tax rateThe marginal tax rate is the amount of additional tax paid for every additional dollar earned as income. The average tax rate is the total tax paid divided by total income earned. A 10 percent marginal tax rate means that 10 cents of every next dollar earned would be taken as tax. is the rate applied to the last euro of income earned. When a taxpayer experiences an increase in his personal income, any extra revenue above the established threshold will be taxed at a higher rate. The average implicit tax rate, on the other hand, is the average rate at which a taxpayer’s entire income is taxed, which can be estimated by taking into account all the different brackets and rates that may apply. Therefore, the concept of the implicit tax rate is equivalent to the total tax paid, expressed as a percentage of the overall income.
The following table provides a concise definition of each term:
Table 1. Key Tax Rate Concepts: Definitions and Examples
| Concept | Definition | Example |
|---|---|---|
| Statutory tax rate | The legally established tax rate that is applied to a taxable income | If the statutory income tax rate is 30 percent, that is the statutory tax rate |
| Tax bracket | The range of income that is taxed at a specific rate in a progressive tax system | If income between €20,000 and €40,000 is taxed at 20 percent, that range represents a tax bracket with a 20 percent rate |
| Marginal tax rate | The percentage of tax applied to the last unit of income | If a person moves into a higher tax bracket and pays 40 percent on every euro earned over €50,000, their marginal tax rate is 40 percent |
| Effective tax rate | The actual percentage of taxes paid on total income | If a person earns €50,000 and pays €5,000 in taxes, the effective tax rate is 10 percent |
| Implicit tax rate | Measures the overall tax burden on an economic activity, including both direct and indirect taxes | If an individual earns €50,000 and pays €12,000 in income tax, VAT, and social contributions, their implicit tax rate is 24 percent |
| Maximal tax rate | The point at which an additional increase in the tax rate stops generating more tax revenue, due to disincentives to work or other economic effects | If raising the labor tax rate above 50 percent leads to lower work participation and reduced tax revenue, 50 percent is considered the maximal tax rate |
Statutory and implicit rates differ because the marginal tax rate only applies to the income within a specific bracket, while the average implicit tax rate is a blend of all the marginal rates applicable across the entirety of the taxpayer’s income. For instance, consider a taxpayer currently earning €100,000 under a progressive tax system with four brackets: 10 percent on the first €10,000, 15 percent on the next €20,000, 20 percent on the next €30,000, and 25 percent on any income above €60,000. Under this example, the marginal tax rate for this person would be 25 percent, as that is the rate applied to the last euro earned. However, the average implicit tax rate would be calculated by taking the total tax paid and dividing it by the total income. Here’s the full breakdown:
- 10 percent on the first €10,000 = €1,000
- 15 percent on the next €20,000 = €3,000
- 20 percent on the next €30,000 = €6,000
- 25 percent on the remaining €40,000 = €10,000
Adding these amounts, we find that the total tax paid is €1,000 + €3,000 + €6,000 + €10,000 = €20,000. Hence, the average implicit tax rate is €20,000 / €100,000 = 20 percent. Thus, the marginal tax rate for the taxpayer is 25 percent, while the average implicit tax rate is 20 percent. Understanding this particular distinction is crucial for taxpayers as they navigate the complexities of progressive tax systems and strive to accurately assess their tax liabilities to minimize their pay to the government and keep a higher degree of income for themselves.
Ensuring that top marginal statutory tax rates closely align with average implicit tax rates is essential for maintaining the simplicity and efficiency of a tax system. When top marginal statutory tax rates are significantly higher than average implicit tax rates, economic distortions surely arise, as individuals and businesses alter their behavior to reduce their tax liabilities. In doing so, they may reduce working hours, shift income to future calendar years, receive their pay under lower-taxed forms, etc. This leads to inefficiencies in output as well as reduced productivity. Simplified tax structures where the marginal and implicit rates are closely aligned help reduce these distortions and enable more straightforward financial planning and decision-making.
Moreover, having similar marginal and implicit tax rates reduces the compliance burden on taxpayers. Complex tax codes with varying rates require extensive record-keeping, detailed understanding of tax law, and often continued professional assistance, which can be costly. By aligning statutory and implicit rates, taxpayers are easily able to calculate their liabilities, which helps them file returns and ensure compliance. This simplicity not only benefits individuals and businesses but also reduces administrative costs for tax authorities, as the public sector will spend less time and resources on audits and enforcement measures.
For instance, in a progressive tax system, an individual earning €50,000 might face a marginal tax rate of 25 percent. If the average implicit tax rate is close to this marginal rate (for instance, 23 percent), then the taxpayer’s behavior and financial planning will be less influenced by the tax code’s complexities. In contrast, if the implicit tax rate were only 15 percent, the taxpayer might seek ways to reduce taxable incomeTaxable income is the amount of income subject to tax, after deductions and exemptions. Taxable income differs from—and is less than—gross income. to benefit from the lower implicit rate, which can lead to potential inefficiencies and increased complexity in the tax system and the economy. Ensuring that statutory and implicit rates are aligned will instead simplify tax compliance and enhance economic efficiency.[3]
As these examples illustrate, increasing the top marginal statutory tax rate without simplifying the tax system does not necessarily lead to a proportional increase in tax revenues and can even result in a loss of income for the government. This can occur due to changes in taxpayer behavior, such as reducing taxable activities or seeking more aggressive tax avoidance strategies. Consequently, a cycle of continued tax increases is likely to widen the gap between marginal and implicit tax rates, exacerbating the complexities and inefficiencies of the tax system and increasing the damage to the overall economy.
Given the potential economic and administrative implications, it is crucial to study this issue in more depth. This report provides an overview of top marginal statutory and average implicit tax rates across the different European Union countries, highlighting disparities and discussing their impact on economic efficiency and tax compliance. By examining these dynamics, policymakers can better understand the need to focus on tax reforms that align marginal and implicit rates, thereby enhancing the overall simplicity and effectiveness of the tax system.
Overview of Marginal and Effective Rates in Europe
The marginal and average effective tax rates in European countries are presented in the chart below. For this purpose, we use the most obvious example of a progressive system that can be found in modern-day tax systems: the personal income tax (PIT). This particular revenue measure is fundamental for understanding how the tax burden on individual income is structured and how differences between top marginal statutory and average effective rates can affect both public revenue and the fairness and efficiency of the tax system in each nation.
The simplest estimate is to obtain the top marginal statutory rate. This data can be obtained directly from the European Commission.[4] The statutory personal income tax rate is used. The legal statutory tax rate refers to the tax rate that is set by law and applied to income, profits, or other taxable items. This rate is defined by the government and is the percentage of income or value that must be paid as tax.
On the other hand, we shall estimate the average implicit personal income tax rate—that is, the rate actually paid on personal income. There is no direct calculation for this metric, which is a proxy for the average tax rateThe average tax rate is the total tax paid divided by taxable income. While marginal tax rates show the amount of tax paid on the next dollar earned, average tax rates show the overall share of income paid in taxes. . This estimate follows Kotsarakos and Varthalitis (2020).[5] In essence, the ratio of personal income to the personal income tax base is calculated. Further details of the steps and sources followed to estimate the average effective rate are given in the Appendix.
The results of our calculation are shown in Table 2. As can be seen, in all European Union countries, the average effective rate is lower than the top marginal statutory rate. This is not surprising, due to the tax benefits and deductions that apply in all nations. However, there are notable differences. For example, in Hungary, where a flat taxAn income tax is referred to as a “flat tax” when all taxable income is subject to the same tax rate, regardless of income level or assets. is applied, the ratio between the effective rate and the statutory rate is 0.7, while in Croatia it is 0.17. Hence, we find great variability across Europe, but generally, countries that opt for a flat tax tend to have an effective rate close to the statutory rate. This is the case in Hungary and Estonia.
Table 2. Overview of Top Marginal Statutory and Average Effective Personal Income Tax Rates in European Union Countries in 2022
| Country | Top Marginal Statutory Tax Rate | Average Effective Tax Rate | Ratio Effective/Statutory |
|---|---|---|---|
| Denmark | 55.9 | 50.29 | 0.90 |
| Estonia | 20 | 15.05 | 0.75 |
| Hungary | 15 | 10.52 | 0.70 |
| Luxembourg | 45.8 | 31.95 | 0.70 |
| Sweden | 52.2 | 34.19 | 0.65 |
| Ireland | 40 | 24.01 | 0.60 |
| Finland | 51.3 | 28.11 | 0.55 |
| Italy | 47.1 | 24.41 | 0.52 |
| Belgium | 53 | 24.50 | 0.46 |
| Lithuania | 32 | 14.43 | 0.45 |
| Latvia | 31 | 12.88 | 0.42 |
| Germany | 47.5 | 19.54 | 0.41 |
| Austria | 50 | 20.29 | 0.41 |
| Spain | 45 | 17.65 | 0.39 |
| France | 51.5 | 19.06 | 0.37 |
| Netherlands | 49.5 | 17.99 | 0.36 |
| Czechia | 23 | 7.25 | 0.32 |
| Slovakia | 25 | 7.59 | 0.30 |
| Portugal | 53 | 14.26 | 0.27 |
| Poland | 32 | 8.61 | 0.27 |
| Slovenia | 45 | 9.11 | 0.20 |
| Cyprus | 35 | 6.93 | 0.20 |
| Greece | 54 | 10.00 | 0.19 |
| Croatia | 35.4 | 5.90 | 0.17 |
Source: Eurostat, “GDP and main components,” https://ec.europa.eu/eurostat/databrowser/view/nama_10_gdp/default/table?lang=en; Eurostat, “Main national accounts tax aggregates,” https://ec.europa.eu/eurostat/databrowser/view/GOV_10A_TAXAG/default/table?lang=en; and European Commission, "Taxation Trends," https://taxation-customs.ec.europa.eu/taxation-1/economic-analysis-taxation/data-taxation-trends_en.
As discussed, top marginal statutory personal tax rates often differ from average effective tax rates because the statutory rate represents the legally prescribed rate, while the effective rate reflects the actual burden on taxpayers, taking into account various deductions, credits, and exemptions. Statutory rates are the straightforward percentages set by tax law, but effective rates consider the real-world tax planning and behavior of individuals. For example, taxpayers might utilize deductions for mortgage interest, charitable contributions, or medical expenses, which will in turn lower their taxable income and consequently alter the taxes they owe, resulting in an implicit rate that is lower than the statutory rate.
Moreover, increasing statutory tax rates can incentivize taxpayers to engage in tax avoidance strategies, thus widening the gap between theoretical and actual tax rates. High statutory rates might lead individuals to seek legal methods to reduce their taxable income through investments in tax-advantaged accounts, increase the use of tax shelters, or shift their income to lower-tax jurisdictions. This behavior reduces the amount of tax paid by individuals, which can ultimately be significantly lower than the statutory rate.
As Gamarra et al. (2024) indicate,[6] when taxes are increased, the main effects can be observed in various economic and behavioral responses from taxpayers. One significant impact is the mechanical effect, where the tax revenue changes without considering any behavioral responses. Initially, this effect tends to increase the tax revenue as higher rates lead to more collections from the same taxable income. This is particularly evident in the lower tax brackets, where most taxpayers fall, and the increase in revenue is relatively straightforward. However, this mechanical increase is not uniform across all brackets, as higher-income earners might respond differently to tax hikes.
Another crucial effect at play is the behavioral response, which encompasses the various ways taxpayers might alter their economic activities to minimize their tax burdens. This includes changes in labor supply, saving, investment decisions, and income reporting. When tax rates rise, high-income earners and those with more flexible income sources might reduce their taxable income through legal means such as income shifting or increasing tax-deductible expenses. These behavioral responses can significantly erode the initial mechanical gains, leading to a much lower net increase in tax revenue than initially projected.
Moreover, the research illustrates that the net effect of tax rate increases can vary significantly depending on taxpayers’ circumstances. For example, married couples, single individuals, joint filers, and separate filers exhibit different levels of sensitivity to tax changes. Women, for instance, tend to show higher elasticity in their taxable income compared to men, indicating a greater responsiveness to tax rate changes. This variability underscores the importance of considering demographic factors when evaluating the overall impact of tax policy changes.
Introducing the concept of tax elasticity is important here. It measures the responsiveness of taxpayers’ behavior to changes in tax rates. High elasticity indicates that taxpayers significantly alter their behavior in response to tax changes, leading to substantial shifts in labor supply, saving, and investment. Low elasticity suggests that behavior remains relatively stable despite tax rate changes. Understanding tax elasticity helps policymakers design tax systems that balance generating revenue with minimizing negative behavioral responses.
There is a large literature on the study of tax elasticity, as summarized by Gamarra (2023).[7] Three generations of studies on tax elasticity can be identified. The first generation focused on the impact of income taxes on hours worked and labor market participation, omitting other aspects of individual behavior. The second generation introduced the elasticity of taxable income (ETI), which considers all behavioral responses to taxation, not just labor supply. Recently, the third generation has advanced the analysis of individual responses using more robust econometric methods and administrative data, highlighting the clustering approach to estimate ETI by identifying clusters in the distribution of taxable income around tax bracket cut-off points.
An increase in statutory rates can lead to a greater behavioral effect due to the greater sensitivity of taxpayers to changes in tax rates. When tax rates increase, especially in higher income brackets, taxpayers with greater financial resources and more flexibility in managing their income have greater incentives to seek ways to reduce their tax burdens. This may include legal strategies such as shifting income to categories with lower tax rates, increasing tax deductions, or even reducing their reported economic activity. These behavioral responses can significantly erode the expected tax revenue from the statutory rate increase, partially offsetting the mechanical effect of the rate increase.
There is also evidence for the sensitivity of the first income brackets, as shown by Gamarra et al. (2022).[8] The results of the study, which focuses on Spain, provide strong evidence of behavioral responses to taxation by low-income taxpayers. Significant clustering is observed at the first tax threshold, as the number of individuals around this threshold is 890 times greater than the number of individuals that would be present in the absence of the threshold. These results suggest that low-income taxpayers also adjust their taxable income to avoid higher tax rates, demonstrating strategic behavior to minimize their tax burdens.
Therefore, increasing the statutory rate does not necessarily imply an increase in the implicit rate, which is the effective percentage of revenue that the government manages to collect. The sensitivity of taxpayers and their ability to adjust their behavior in response to changes in tax rates may result in the expected additional tax revenues not materializing to the extent projected. In extreme cases, an excessive increase in statutory rates could even lead to a decrease in total tax revenues, as discussed in more detail in a later section.
Competitiveness and Tax Revenue
A question that might arise at this point of the discussion is whether raising statutory rates in such a way as to increase the gap between these and implicit rates produces distortions in the tax system, or whether it enables government revenues to increase. In other words, attention must be paid to tax competitiveness and the threshold above which higher tax rates fail to generate significant increases in government revenues.
Tax competitiveness refers to a country’s ability to attract and retain business activity and investment by implementing an efficient, favorable tax system. This concept involves keeping tax rates low and simplifying the tax code to minimize administrative burdens and compliance costs. A competitive tax system seeks to balance the revenue collection needed to fund government priorities while encouraging economic growth and investment. In a globalized environment, where capital and business can move easily between jurisdictions, a competitive tax system is crucial for attracting companies seeking to maximize their net after-tax return.[9]
The importance of tax competitiveness lies in its direct impact on foreign direct investment (FDI) as well as the general output of the domestic economy. A competitive tax system can stimulate investment by reducing the cost of capital and increasing the profitability of investments. This, in turn, can lead to higher economic growth, job creation, and expansion of the tax base. In addition, a well-designed tax system can improve market efficiency by reducing tax distortions that could divert resources to less productive uses. Tax competitiveness not only attracts foreign investment, but also promotes a dynamic and competitive business environment that benefits the entire economy.
However, an increase in statutory rates can reduce the competitiveness of a country’s tax code by creating an excessive gap between nominal and implicit tax rates. This discrepancy can incentivize companies and individuals to seek mechanisms to reduce their tax burdens, such as tax avoidance, aggressive tax planning, or shifting their operations to jurisdictions with lower tax rates. When statutory rates are much higher than implicit rates, this distortion that arises from the tax system can discourage investment decisions and hinder economic growth. Therefore, it is critical for tax policymakers to consider both the direct and indirect effects of tax rate increases to maintain competitiveness and avoid negative economic consequences.
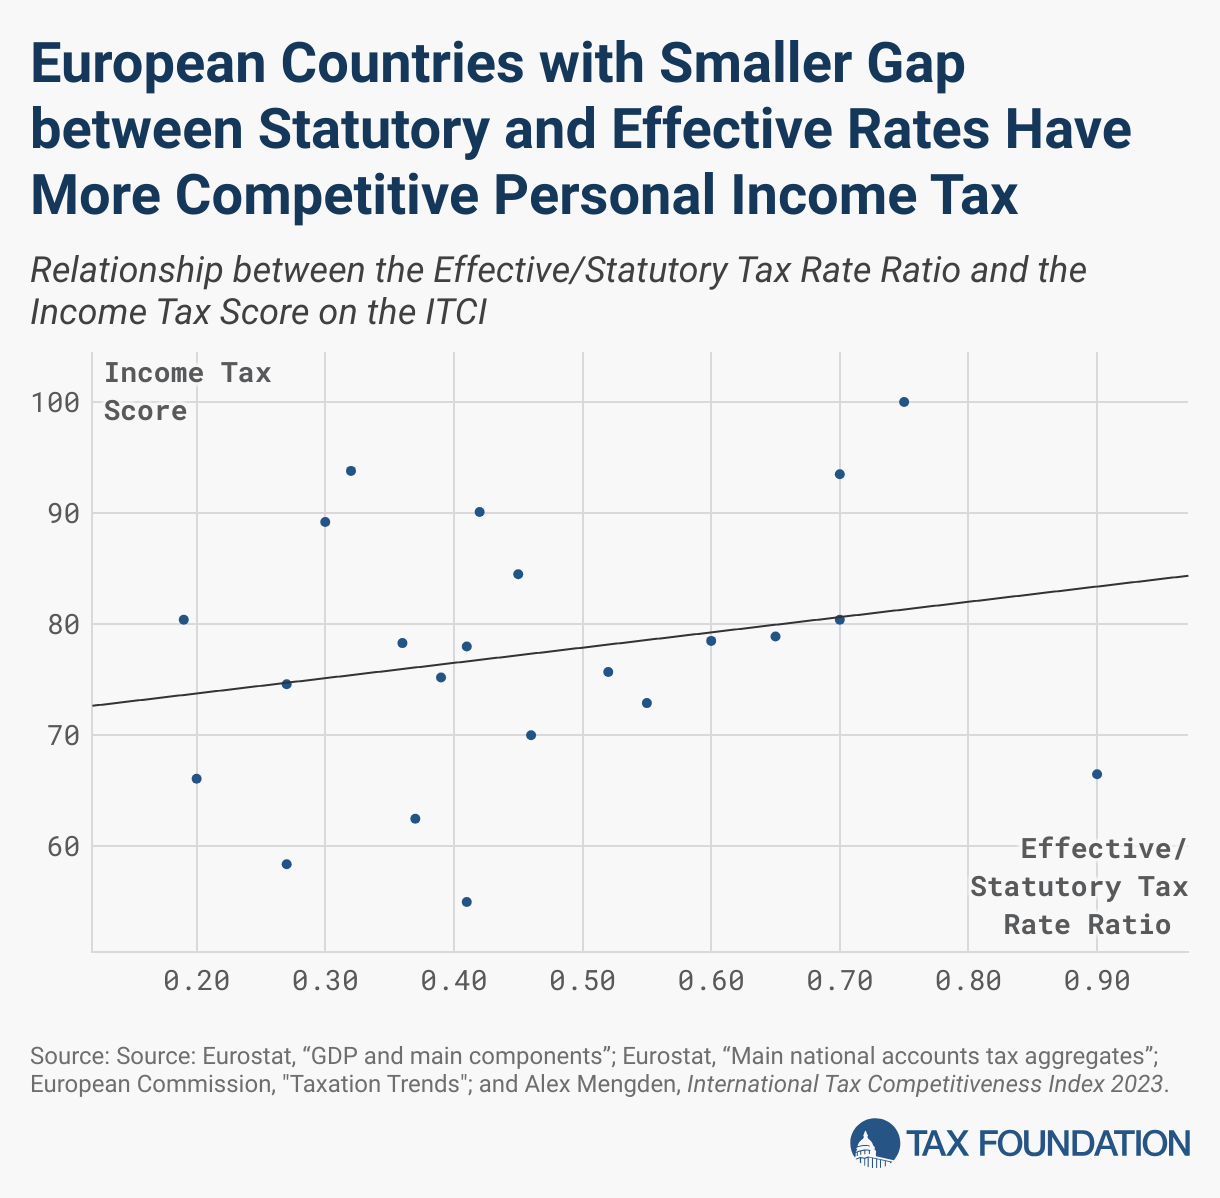
To test the relationship between the ratio of implicit to statutory rates and the levels of tax competitiveness seen in different nations, Figure 1 correlates said ratio with the score earned by EU countries in the PIT category of the International Tax Competitiveness Index (ITCI).[10] This score is based primarily on two factors: the top personal income tax rate and the income level at which this rate is first applied. The top rate measures the highest percentage that applies to personal income. The income level considers how much income needs to be earned for this top rate to apply relative to the average income of the country. Countries with lower top rates and higher income levels for the application of these rates generally score better, as they provide more incentive for additional work and personal investment.
Figure 1 shows that countries with a higher ratio between their implicit and statutory tax rates have more competitive personal income tax systems. Although there is some variation in this relationship, this can be attributed to other factors, such as the level of income at which the marginal tax rate is applied. Overall, it can be concluded that policymakers can achieve a more neutral and less complex tax system by keeping the discrepancy between implicit and statutory rates in check. By minimizing this gap, countries can reduce economic distortions and create a more favorable environment for both workers and investors.
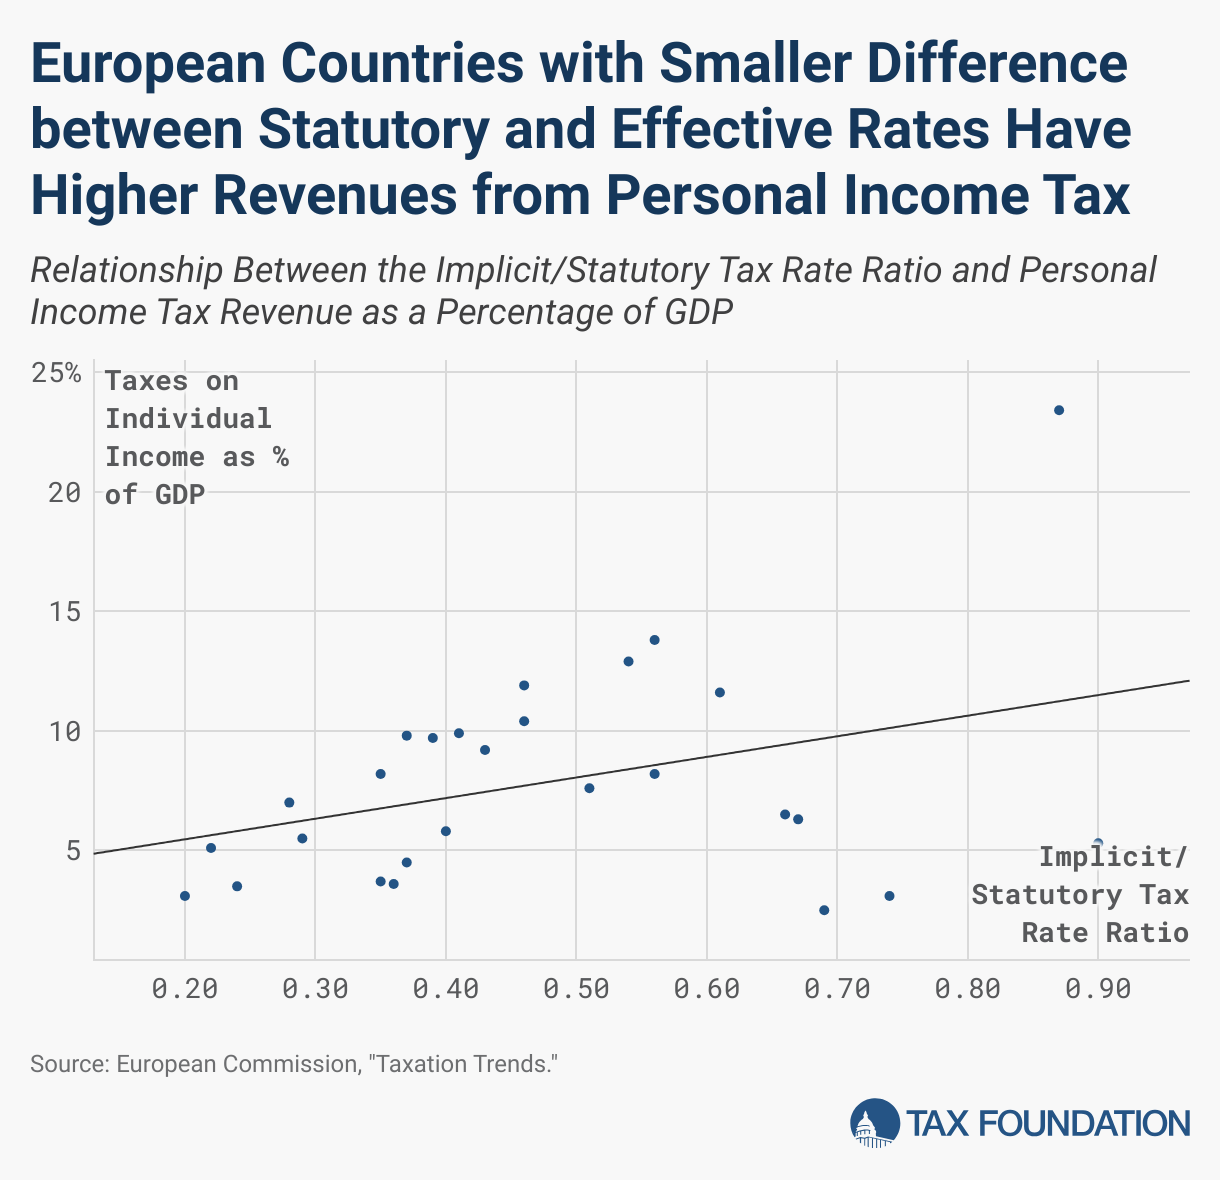
In fact, bringing the effective rate closer to the statutory rate is associated with a higher level of tax revenue owed to personal income taxes. One explanation for this is that, by reducing the gap captured by this ratio, the personal income tax is applied more efficiently and on a broader basis. This efficiency not only enhances compliance but also minimizes incentives for tax avoidance and evasion. As a result, the system becomes more effective in capturing the intended revenue, leading to a more robust and predictable stream of income for government budgets.
The Laffer Curve: A Discussion
As statutory tax rates increase, the implicit tax rates may initially increase proportionally. However, above a certain threshold, implicit rates begin to diverge from statutory rates. This occurs because high tax rates can discourage the generation of additional revenue and encourage tax avoidance, tax evasion, or reduced economic activity. This mechanism is similar to that of the Laffer Curve, which suggests that there is an optimal point of tax rates where tax revenue is maximized. Beyond this point, further increases in statutory tax rates may result in a decrease in revenue due to the contraction of the tax base, reflected in the divergence between statutory and implicit tax rates.
The Laffer Curve is a fundamental concept in economics that illustrates the relationship between taxation levels and tax revenues. Its origin is sometimes dated back to an informal meeting in 1974 in a Washington, DC restaurant, where Arthur B. Laffer, an American economist, explained this theory to a group of journalists and politicians, including Donald Rumsfeld and Dick Cheney. At this meeting, Laffer supposedly illustrated his point on a napkin, which is preserved in the National Museum of American History.
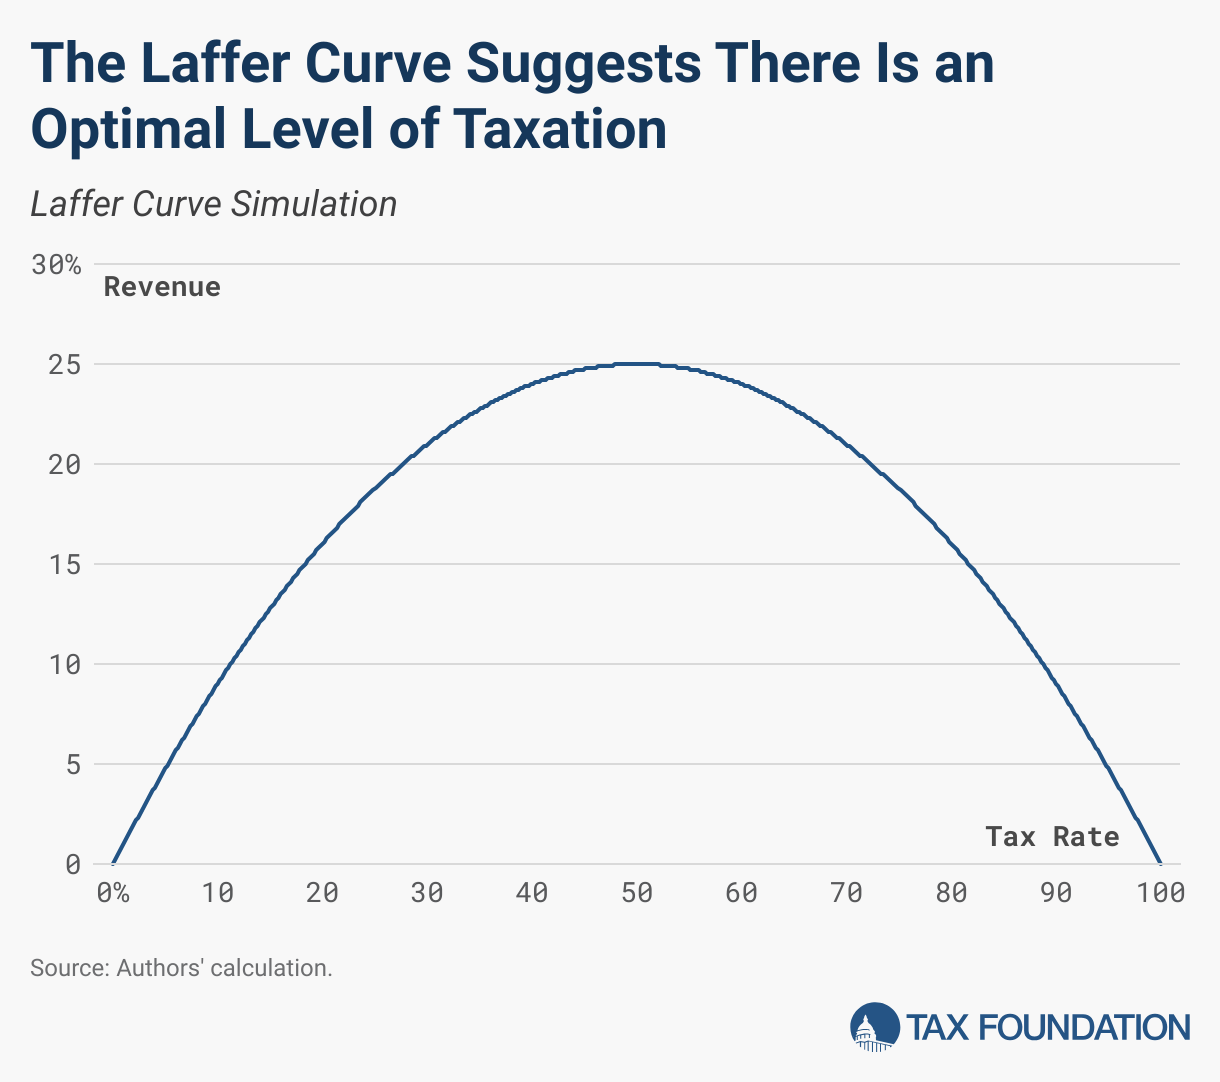
The Laffer Curve shows that as tax rates increase from a low level, tax revenues also increase. However, beyond a certain point, increasing tax rates further reduces tax revenues, due to decreased incentives to work, invest, and produce. This theory suggests that there is an optimal level of taxation that maximizes tax revenues without discouraging economic activity.
Visually, the Laffer Curve is arc-shaped. The horizontal axis represents tax rates, which vary from 0 percent to 100 percent, while the vertical axis represents tax revenues. At the 0 percent tax point, tax revenues are zero. As the tax rate increases, tax revenues also increase until a maximum point is reached. Beyond this point, an increase in the tax rate reduces tax revenues, as individuals and companies find it less attractive to generate taxable income.
The idea behind the Laffer Curve is that there are two tax rates that can generate the same tax revenue: a low rate and a high rate. However, the high rate is detrimental to the economy because it discourages economic activity. Therefore, Laffer argues that reducing tax rates from very high levels can, paradoxically, increase tax revenues. This notion gained prominence during President Ronald Reagan’s administration in the 1980s. The former US leader pursued policies based on Laffer’s theory, significantly reducing tax rates in the hope of stimulating the economy and, in the long run, increasing tax revenues.
Critics of the Laffer Curve argue that its simplicity does not capture the complexity of modern economies and that the effects of changes in tax rates may vary depending on the economic and social context. In addition, they point out that finding the optimal point of the curve is not straightforward and may be different for each economy. Also, practical application of the theory has proven to be difficult in some cases, with results varying considerably in different situations.
The Laffer Curve is also used often to make the case against extremely high tax rates, suggesting that they may be counterproductive and that tax reductions, in certain cases, may be more effective in generating sustainable tax revenues in the long run. This explains why this theoretical insight has become controversial, as supporters of higher taxes will often try to discredit the merits of Laffer’s tool.
In summary, the Laffer Curve is a powerful theoretical tool for understanding the relationship between tax rates and tax revenues, highlighting the importance of finding an optimal balance that maximizes revenue without discouraging economic activity. Its legacy continues to influence fiscal debates and economic policies around the world.
How Far Are We from the Point of Maximum Revenue?
Having reviewed the Laffer Curve, the question of interest is clear: how much can governments raise revenue by increasing statutory tax rates? Indeed, policymakers only have the power to change statutory rates; however, effective rates indicate the ability to raise revenue. Or, to put it another way, how far are we from the peak of the Laffer Curve?
Different academic works have addressed this matter. For example, Holter et al. (2019) investigate how income tax progressivity and household diversity affect the government’s ability to raise taxes, through the modernization of the Laffer Curve.[12] The authors find that the peak of the Laffer Curve in the United States is reached at an average tax rate of 58 percent, which would enable tax revenues to increase by 59 percent if current progressivity is maintained. However, a flat tax system would increase this peak by 7 percent, while a system with Denmark’s progressivity would reduce it by 8 percent. The study shows that higher tax progressivity significantly decreases the labor participation of married women and increases that of single women, especially when their future wages depend on their past work experience. Moreover, high-income households reduce their labor supply more than low-income households when progressivity increases. In conclusion, tax progressivity has a significant impact on the government’s ability to raise revenue. Policies that increase progressivity may have varying effects on revenue and labor participation, depending on household structure and human capital accumulation. This reflects the idea that there is great heterogeneity in the elasticity of the personal income tax.
Mathias Trabandt and Harald Uhlig (2011) analyze Laffer Curves for labor and capital income taxes in the United States, the European Union (EU-14), and different individual European countries, quantifying how tax revenues vary as a function of tax rates.[13] To do so, they estimate the maximal labor tax rate, identifying the point of maximum revenue collection, i.e., the highest level of taxes on labor that an economy can bear before negative effects on workers’ behavior (such as a reduction in hours worked or an increase in tax evasion) cause a decline in total tax revenues.
A key result of the study is that in the European Union, there is significantly less scope for increasing tax revenues by raising tax rates compared to the United States. Specifically, the authors found that in the United States, tax revenue on labor income could increase by 30 percent and on capital income by 6 percent by maximizing tax rates. In contrast, for the EU-14, these increases are much smaller, with a potential increase of 8 percent for labor taxes and only 1 percent for capital taxes. This result suggests that the EU-14 countries are already closer to the downward slope of their respective Laffer Curves, thus limiting their ability to significantly increase tax revenues through higher tax rates.
The concept of “self-financing percentage” is central to understanding these results. This percentage refers to the proportion of a tax cut that is “self-financing” through incentive effects that increase economic activity and thus the tax base. For example, if a country reduces the tax rate on labor income, part of the initial loss of tax revenue may be recovered due to an increase in labor supply and, consequently, in taxable labor income. In the study, it is estimated that in the EU-14, 54 percent of a labor tax cut and 79 percent of a capital tax cut are self-financing. This means that more than half of the tax revenue lost from labor tax cuts and almost four-fifths of the tax revenue lost from capital tax cuts is recovered through the increased economic activity induced by lower taxes. Therefore, although tax cuts do not entirely “pay for themselves,” their actual budgetary impact is significantly lower than that suggested by static assessments.
Table 3. The Laffer Curve of the Tax on Labor in the US and Selected EU Countries
| Percent Self-Financing | Maximal Labor Tax Rate | Maximum Additional Tax Revenues | |
|---|---|---|---|
| USA | 32 | 63 | 30 |
| EU-14 | 54 | 62 | 8 |
| Germany | 50 | 64 | 10 |
| France | 62 | 63 | 5 |
| Italy | 63 | 62 | 4 |
| United Kingdom | 42 | 59 | 17 |
| Austria | 71 | 61 | 2 |
| Belgium | 69 | 61 | 3 |
| Denmark | 83 | 55 | 1 |
| Finland | 70 | 62 | 3 |
| Greece | 54 | 60 | 7 |
| Ireland | 35 | 68 | 30 |
| Netherlands | 53 | 67 | 9 |
| Portugal | 45 | 59 | 14 |
| Spain | 46 | 62 | 13 |
| Sweden | 83 | 63 | 1 |
These findings indicate that self-financing effects are more pronounced in Europe, suggesting that tax cuts may be a more effective tool than expected to maintain tax revenues without generating large deficits. In summary, Trabandt and Uhlig’s study provides a detailed understanding of fiscal constraints and opportunities in different regions, highlighting the importance of considering incentive effects in tax policy and the limited potential to raise tax revenues in the EU-14 through higher tax rates.
However, this type of work, based on the parameterization of certain characteristics at the aggregate level of tax systems, suffers from some weaknesses. One of them is that they do not take into account that changes in personal income tax rates also have an impact on revenues from other taxes (i.e., consumption taxA consumption tax is typically levied on the purchase of goods or services and is paid directly or indirectly by the consumer in the form of retail sales taxes, excise taxes, tariffs, value-added taxes (VAT), or income taxes where all savings are tax-deductible. or social contributions). In addition, it overlooks the fact that increasing rates generates greater regulatory complexity, which raises compliance costs. In other words, the two studies cited above calculate a gross Laffer Curve.
Sanz-Sanz (2022) presents a novel estimate by calculating a fully-fledged Laffer Curve.[14] Indeed, through a simulation of the Spanish tax system, this research reveals that the traditionally used Laffer Curve underestimates the real revenue capacity when the effects on other taxes and administration and compliance costs are not considered. The results show that, when incorporating consumption taxes and social security contributions, the Laffer Curve shifts to the left, indicating that revenue-maximizing rates are lower than previously estimated. For example, in Spain, the revenue-maximizing rate is significantly reduced when all factors are included, going from 62.50 percent to 28.20 percent.
The estimation of an individual Laffer Curve is another crucial issue for understanding how variations in tax rates affect tax revenues at the microeconomic level. This approach enables the identification of the point at which each taxpayer maximizes his tax contribution without reducing incentives to generate additional revenue. Since tax systems are often progressive and contain multiple marginal rates, the individual-level analysis provides a more detailed and accurate view of tax behavior and collection efficiency compared to traditional macroeconomic approaches.
Gamarra et al. (2024) use microeconomic data from the Spanish Tax Agency to model individual taxpayer Laffer Curves.[15] Analytical expressions are used to determine revenue-maximizing tax rates and elasticities, taking into account both the mechanical impact and taxpayer behavior in the face of tax changes. This approach captures individuals’ responses to changes in tax rates, including income shifting to less-taxed tax bases.
The 2012 tax reform in Spain, which increased tax rates, provides an empirical context for assessing the actual impact of rate changes on tax revenues. The results indicate that the expected gain in tax revenues was significantly reduced when taxpayers’ behavioral responses were considered. This finding suggests that a significant portion of potential revenue is lost due to taxpayer adaptation, underscoring the need for tax policies that minimize such losses.
More specifically, the authors estimate that 49.5 percent of the work income taxed by the personal income tax in Spain is on the “prohibitive” side of the Laffer Curve. That is, half of the taxpayers pay marginal rates above the inflection point of the Laffer Curve.
On the other hand, doing the analysis by income brackets, the authors find that the most affected income levels were the third, fourth, and fifth, in which the levy was located in the “prohibitive” zone of the Laffer Curve for 89.5 percent, 86.2 percent, and 100 percent of taxpayers. This implies that from €32,360 onwards, the majority of taxpayers are situated on the decreasing slope of the Laffer Curve.
Finally, the study concludes that in order to formulate effective tax policies, it is essential to consider both the mechanical and behavioral effects of changes in tax rates. The elasticity of taxable income, which reflects taxpayers’ responses, plays a crucial role in shaping the Laffer Curve and determining optimal tax rates. This detailed analysis at the individual level provides a valuable tool for policymakers seeking a balance between equity and revenue efficiency.
A Simple Estimation of the Laffer Curve for Spain and Germany
Making a simulation of the tax system from which to derive the tax curves is far from the goal of this work. However, it is possible to approximate the Laffer Curve in a simpler way that reflects the ideas represented above: given a certain threshold, governments are not able to increase tax revenue by changing statutory rates.
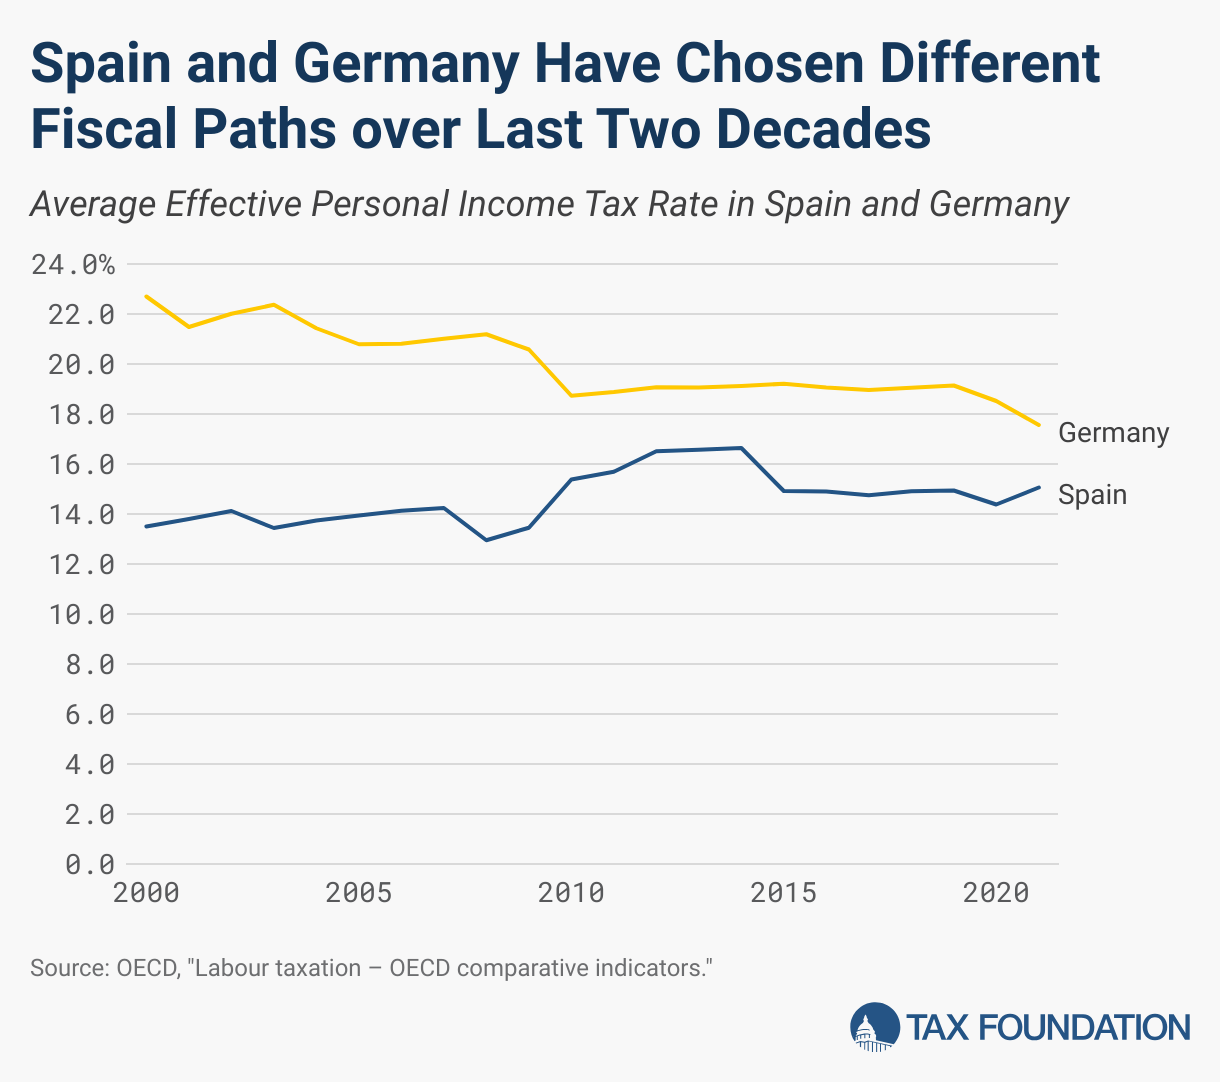
Spain and Germany may be two interesting cases to study, since they represent two contrasting models in terms of the average effective rate applied in the personal income tax. As can be seen in Figure 4, the time evolution between the years 2000 and 2021 reflects a progressive decrease in Germany, as opposed to an increase in Spain. Therefore, this allows us to observe two types of tax policy within the European Union.
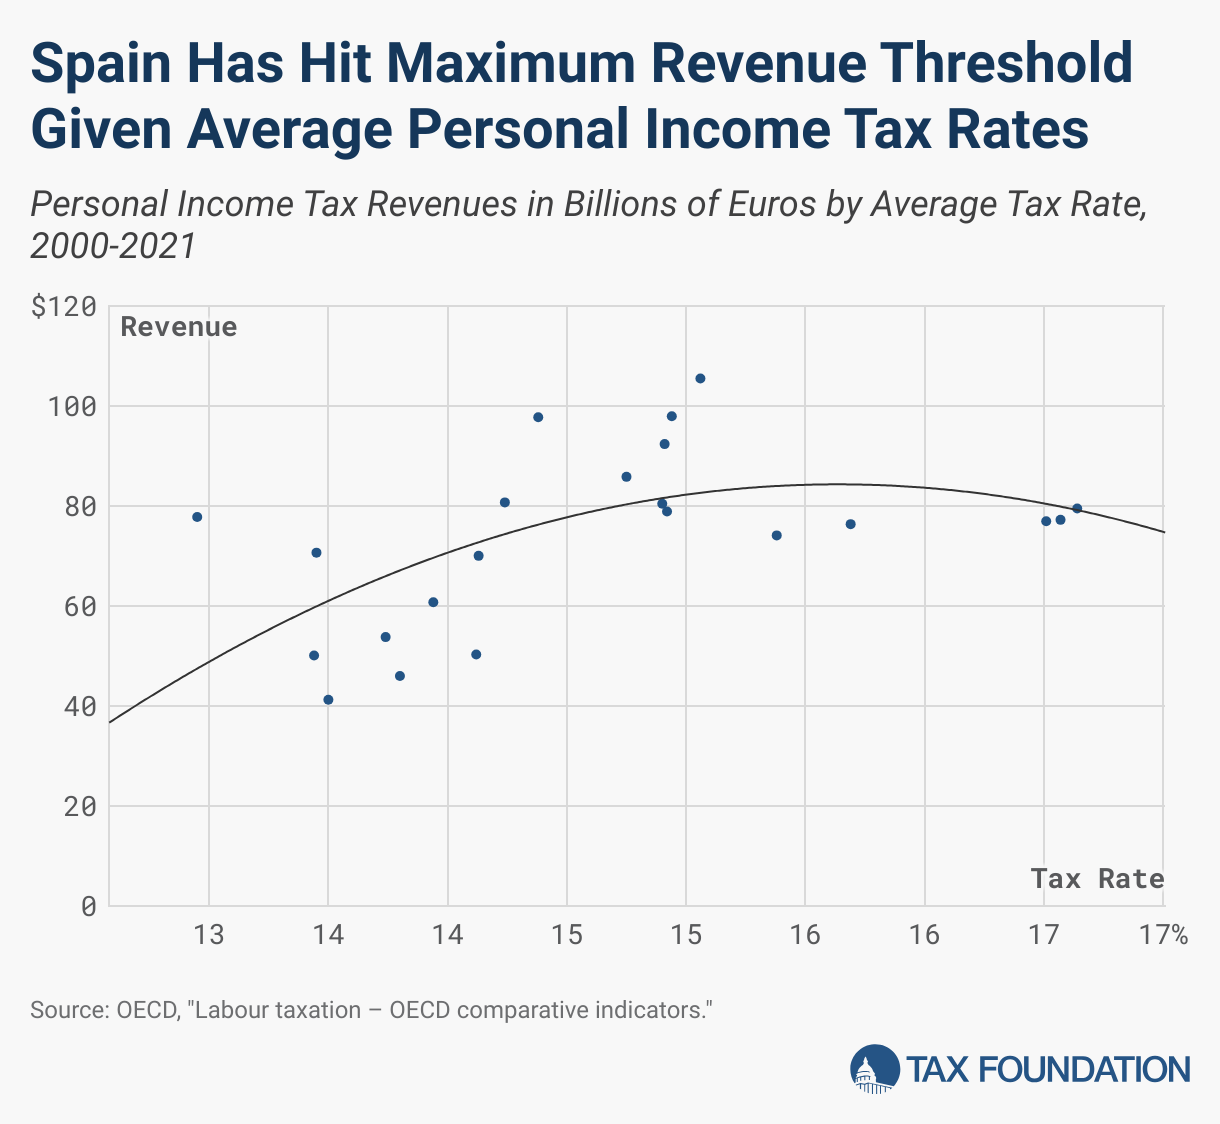
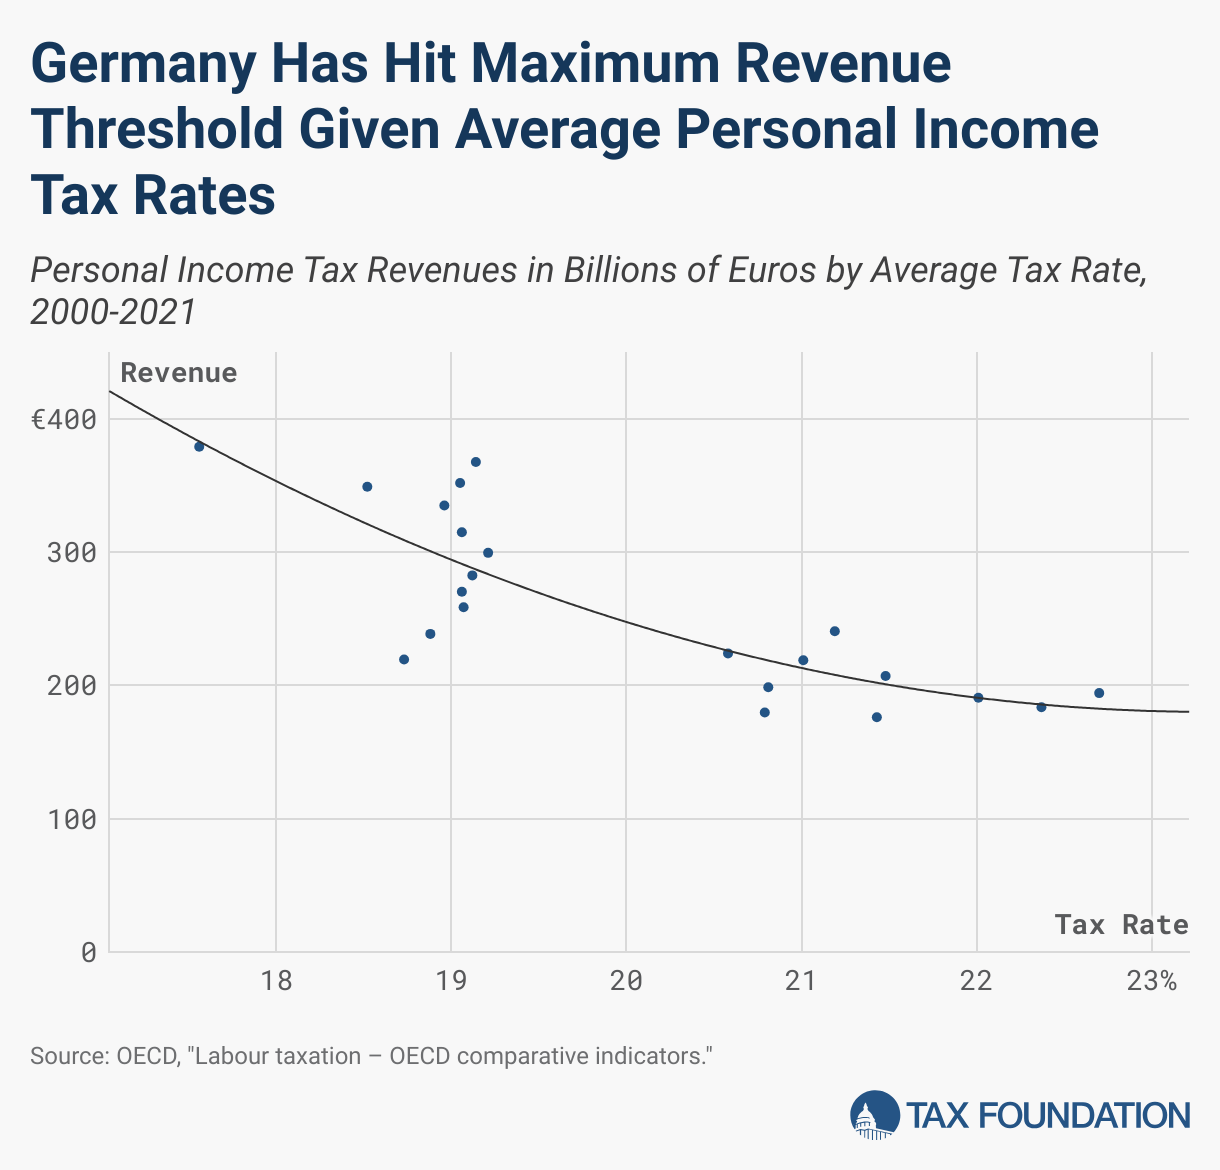
To derive a proxy of the Laffer Curve, several steps have been followed. First, the relationship between the different average effective personal income tax rates and revenue in billions of euros between the years 2000 and 2021 is provided in the scatter plots. As shown, both Germany and Spain have reached their maximum revenue thresholds given their average tax rates. In Spain, the rate is around 15 percent. This threshold was exceeded between the years 2010 and 2014. It is currently rising again to 15.6 percent, so it has again exceeded this maximum tax rate. Germany, on the other hand, is clearly on the right-hand side of the curve, with an average tax rate above that of Spain. However, unlike the Spanish case, there has been a downward trend in the average tax rate in recent years.[16]
Akgun et al. (2017) have conducted an exercise that can serve as a complement to the Laffer Curve simulation for OECD countries with respect to the personal income tax.[17] The results point to the fact that in developed economies, there is a non-monotonic relationship between average effective rates and tax revenue. This means that the relationship between these two variables does not follow a single, consistent trend (either always increasing or always decreasing). Instead, it suggests that tax revenue first increases with rising average effective rates up to a certain point, and then begins to decrease beyond that point, indicating the presence of an optimal tax rate that maximizes revenue. This is clearer especially in the lower and higher income brackets, where taxpayers seem to be more sensitive to changes in tax rates.
In conclusion, the data presented support the hypothesis that both Germany and Spain have reached a threshold at which an additional increase in tax rates would not generate a significant increase in tax revenues. This phenomenon is in line with the Laffer Curve theory, which postulates that there are tax saturation points beyond which collection efficiency decreases. The situation in Spain, with an efficiency threshold around 15 percent, and the decreasing revenue trend in Germany indicate that both countries should consider alternative tax strategies to optimize their revenues. Clearly, changes in statutory rates in these two countries need not be accompanied by increases in effective rates.
Conclusion
Simplifying and improving the efficiency of tax systems are essential to optimize revenue and reduce the administrative burden. A simple tax system, with fewer deductions and exemptions, makes it easier for taxpayers to understand and comply with their tax obligations. This not only reduces the need for professional advice, but also enables tax authorities to focus their resources on more critical areas, improving the overall efficiency of the system.
In addition, simplifying the tax system decreases opportunities for tax avoidance. When tax rules are clear and straightforward, taxpayers have less incentive to pursue evasion strategies. This enables tax auditors to detect irregularities more easily, increasing the efficiency of the tax administration and reducing the administrative workload.
It is critical to understand the differences between statutory tax rates and implicit tax rates. Statutory rates are the rates set by law, while implicit rates reflect the actual tax burden borne by taxpayers, considering deductions and exemptions. Simplifying the tax system can help reduce the gap between these rates, making revenue more predictable and efficient.
A focus on tax efficiency also involves maintaining an appropriate balance between marginal and effective tax rates. Significant discrepancies between these rates can generate economic distortions, incentivizing individuals and companies to modify their behavior to minimize their tax burden. Aligning these rates facilitates financial planning and reduces the administrative burden for both taxpayers and tax authorities.
Tax competitiveness is another essential aspect of tax efficiency. A competitive tax system attracts foreign investment and stimulates domestic economic activity by reducing capital costs and increasing the profitability of investments. This can translate into sustained economic growth, job creation, and a broadening of the tax base. Therefore, policymakers should consider both the direct and indirect effects of tax rates to maintain and improve competitiveness.
Stay informed on the tax policies impacting you.
Subscribe to get insights from our trusted experts delivered straight to your inbox.
SubscribeAppendix
For the estimation of the average effective personal income tax rate, we follow the strategy used by Kotsarakos and Varthalitis (2020).[18] More specifically, the goal is to estimate the effective rate , which is derived from the following equation:

Personal income tax revenues are obtained directly through Eurostat.[19] For the tax base, the pre-tax compensation of employees is taken into account, i.e., after the deduction of social security contributions, in addition to entrepreneurial and net interest income.[20]
[1] Emilio Albi, José Manual González-Páramo, Rosa M. Urbanos, and Ignacio Zubiri, Economía Pública II (Barcelona: Editorial Planeta, 2018).
[2] Henceforth, when the report refers to the effective tax rate, it will refer to income or labor tax in particular, while when the implicit tax rate is used, it will refer to a broader view that includes all taxes affecting an individual or company.
[3] Alex Mengden, International Tax Competitiveness Index 2023 (Tax Foundation, 2023). https://taxfoundation.org/wp-content/uploads/2023/10/TF-ITCI23-Book_16-10_FV.pdf
[4] European Commission, “Taxation Trends,” https://taxation-customs.ec.europa.eu/taxation-1/economic-analysis-taxation/data-taxation-trends_en.
[5] Ilias Kostarakos and Petros Varthalitis, “Effective Tax Rates in the EU: An updated database over 1995-2017,” https://www.esri.ie/system/files/publications/RS110_technical%20appendix.pdf.
[6] Ana Gamarra Rondine, José Félix Sanz-Sanz, and María Arrazola, “The individual Laffer Curve: evidence from the Spanish income tax,” Empirical Economics (July 2024).
[7] Ana Gamarra Rondine, “The Elasticity of Taxable Income of Low-Income Earners: Bunching Evidence from Spain,” Austaxpolicy: Tax and Transfer Policy Blog, Mar. 28, 2023, https://www.austaxpolicy.com/the-elasticity-of-taxable-income-of-low-income-earners-bunching-evidence-from-spain/.
[8] Ana Gamarra Rondine, María Arrazola, and José Félix Sanz-Sanz, “The elasticity of taxable income of low-income earners: bunching evidence from Spain,” Applied Economics 55:21 (August 2022): 2389-2412, https://doi.org/10.1080/00036846.2022.2102576.
[9] Alex Mengden, International Tax Competitiveness Index 2023, Tax Foundation, https://taxfoundation.org/wp-content/uploads/2023/10/TF-ITCI23-Book_16-10_FV.pdf.
[10] These countries are Hungary, Denmark, Estonia, Ireland, Italy, Sweden, Finland, Lithuania, Belgium, Luxembourg, Spain, Austria, Latvia, Germany, Poland, France, Czechia, Slovakia, Netherlands, Greece, Portugal, and Slovenia.
[11] This section is based on a portion of a book written by one of the authors: Santiago Calvo and Álvaro Martín, ¡Que no te engañen! Un repaso a las grandes falacias de los populismos a derecha e izquierda (Barcelona, Spain: Ediciones Deusto, 2022), 226-229.
[12] Hans A. Holter, Dirk Krueger, and Serhiy Stepanchuk, “How do tax progressivity and household heterogeneity affect Laffer Curves?,” Quantitative Economics 10:4 (December 2019): 1317-1356, https://doi.org/10.3982/QE653.
[13] Mathias Trabandt and Harald Uhlig, “The Laffer Curve revisited,” Journal of Monetary Economics 58:4 (May 2011): 305-327, https://doi.org/10.1016/j.jmoneco.2011.07.003.
[14] José Félix Sanz-Sanz, “A full-fledged analytical model for the Laffer Curve in personal income taxation,” Economic Analysis and Policy 73 (March 2022): 795-811, https://doi.org/10.1016/j.eap.2022.01.008.
[15] Ana Gamarra Rondine, José Félix Sanz-Sanz, and María Arrazola, “The individual Laffer Curve: evidence from the Spanish income tax,” Empirical Economics (July 2024).
[16] A more detailed analysis, including control variables or year fixed effects, could further examine this relationship, but this indirect approach provides valuable information.
[17] Oguzhan Akgun, David Bartlini, and Boris Cournède, “The capacity of governments to raise taxes,” OECD Economics Department Working Papers No. 1407 (September 2017), https://www.oecd-ilibrary.org/docserver/6bee2df9-en.pdf?expires=1722954938&id=id&accname=guest&checksum=57E13BF83C90AF80F88FB04D7DD910C2.
[18] Ilias Kostarakos and Petros Varthalitis, “Effective Tax Rates in the EU: An updated database over 1995-2017,” https://www.esri.ie/system/files/publications/RS110_technical%20appendix.pdf.
[19] Eurostat, “Main national accounts tax aggregates,” https://ec.europa.eu/eurostat/databrowser/view/GOV_10A_TAXAG/default/table?lang=en.
[20] For a more in-depth review of the variables used, see Ilias Kostarakos and Petros Varthalitis, “Effective Tax Rates in the EU: An updated database over 1995-2017.”
Share this article