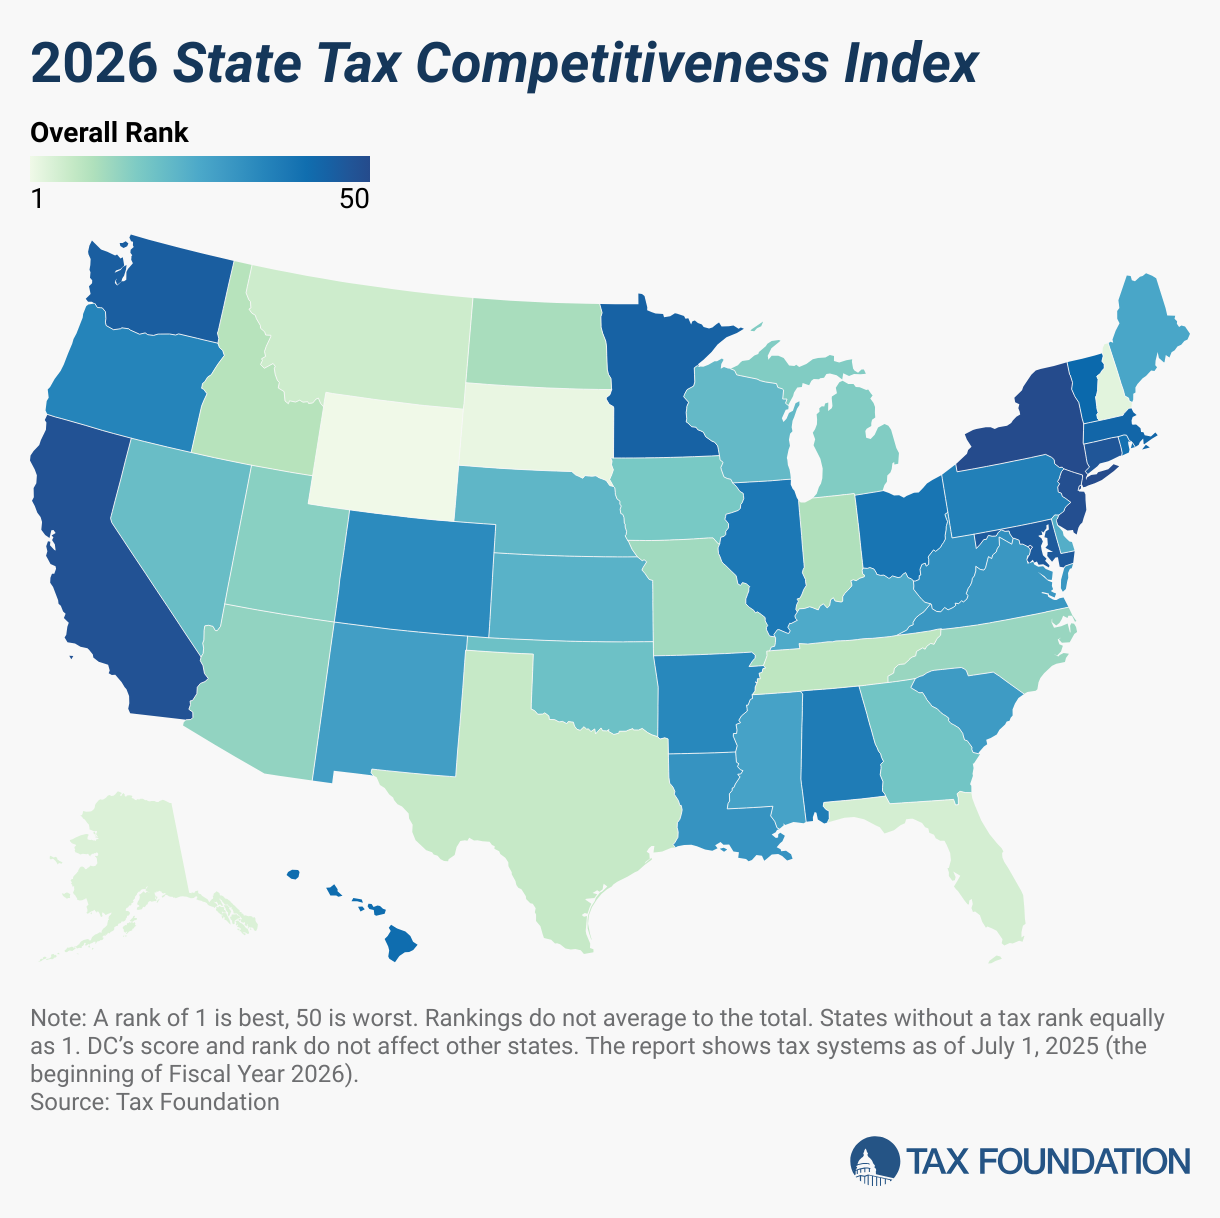
Skip to content

Taxes In North Dakota

North Dakota Tax Rates, Collections, and Burdens

How does North Dakota’s tax code compare? North Dakota has a graduated individual income tax, with rates ranging from 1.10 percent to 2.90 percent. North Dakota also has a 1.41 percent  to 4.31 percent corporate income tax rate. North Dakota has a 5.00 percent state sales tax rate, a max local sales tax rate of 3.50 percent, and an average combined state and local sales tax rate of 6.97 percent. North Dakota’s tax system ranks 17th overall on our 2023 State Business Tax Climate Index.

Each state’s tax code is a multifaceted system with many moving parts, and North Dakota is no exception. The first step towards understanding North Dakota’s tax code is knowing the basics. How does North Dakota collect tax revenue? Click the tabs below to learn more! You can also explore our state tax maps, which are compiled from our annual publication, Facts & Figures: How Does Your State Compare?

See Related Articles

Tax Data by State

Get facts about taxes in your state and around the U.S.

Explore Data

State Tax Data

Individual Taxes

Top Individual Income Tax Rate
2.90%See Full Study
State Local Individual Income Tax Collections per Capita
$579Rank: 40
State and Local Tax Burden
8.9%Rank: 9See Full Study

Business Taxes

Top Corporate Income Tax Rate
4.31%See Full Study
State Business Tax Climate Index Ranking
17See Full Study

Sales Taxes

State Sales Tax Rate
5.00%Rank: 33See Full Study
Average Local Sales Tax Rate
1.96%See Full Study
Combined State and Average Local Sales Tax Rate
6.97%Rank: 27See Full Study
State and Local General Sales Tax Collections per Capita
$1732Rank: 7
State Gasoline Tax Rate (cents per gallon)
23¢Rank: 40
State Cigarette Tax Rate (dollars per 20-pack)
$0.44Rank: 48

Property Taxes

Property Taxes Paid as a Percentage of Owner-Occupied Housing Value
0.98%Rank: 23
State and Local Property Tax Collections Per Capita
$1538Rank: 30

All Related Articles

2022 State Business Tax Climate Index 2022 State Tax Rankings and 2022 State Business Rankings

2022 State Business Tax Climate Index

While there are many ways to show how much is collected in taxes by state governments, our State Business Tax Climate Index is designed to show how well states structure their tax systems and provides a road map for improvement.

169 min read
Property taxes by county. Explore 2021 county property tax paid map. Which county has the highest property tax rate? Are property taxes by city or county? Who pays the most property taxes in America?

Where Do People Pay the Most in Property Taxes?

The six counties with the highest median property tax payments all have bills exceeding $10,000—Bergen, Essex, and Union Counties in New Jersey, and Nassau, Rockland, and Westchester counties in New York. All six are near New York City, as is the next highest, Passaic County, New Jersey ($9,881).

3 min read
State and local tax deduction benefit by county, compare state and local taxes impact of SALT deduction benefit by county. SALT deduction benefit analysis

Reviewing Benefits of the State and Local Tax Deduction by County in 2018

It is important to understand how the SALT deduction’s benefits have changed since the SALT cap was put into place in 2018 before repealing the cap or making the deduction more generous. Doing so would disproportionately benefit higher earners, making the tax code more regressive.

6 min read
sales tax rates by city, cities with highest sales tax rate, city highest sales tax rate, cities with the highest sales tax

Sales Tax Rates in Major Cities, Midyear 2021

Neither Anchorage, Alaska, nor Portland, Oregon, impose any state or local sales taxes. Honolulu, Hawaii, has a low rate of 4.5 percent and several other major cities, including Milwaukee and Madison, Wisconsin, keep overall rates modest.

13 min read
2022 state tax resource center offers leading 2022 state tax resources and 2022 state tax policy resources

Location Matters 2021: The State Tax Costs of Doing Business

A landmark comparison of corporate tax costs in all 50 states, Location Matters provides a comprehensive calculation of real-world tax burdens, going beyond headline rates to demonstrate how tax codes impact businesses and offering policymakers a road map to improvement.

8 min read
State conformity to federal pandemic relief, state tax conformity to federal COVID-19 relief legislation (CARES Act, American Rescue Plan), including Paycheck Protection Program (PPP) loans and unemployment compensation tax exclusion.

State Conformity to Federal Pandemic-Related Tax Provisions in CARES and ARPA

With so many federal changes occurring in such a short amount of time—including some federal provisions changing more than once and a major change to the treatment of UC income occurring in the middle of tax filing season—state legislators have faced the challenge of responding to these changes quickly in order to provide certainty to taxpayers.

24 min read
State tax burden map, state and local tax burden, state-local tax burden rankings, 2021 state tax burden rankings, state tax burdens map

State and Local Tax Burdens, Calendar Year 2019

New Yorkers faced the highest burden, with 14.1 percent of income in the state going to state and local taxes. Connecticut (12.8 percent) and Hawaii (12.7 percent) followed.

19 min read