Download Testimony of Scott A. Hodge before the U.S. Senate Committee on Finance–20110503
“Is the Distribution of Tax Burdens and TaxA tax is a mandatory payment or charge collected by local, state, and national governments from individuals or businesses to cover the costs of general government services, goods, and activities. Benefits Equitable?”
By Scott A. Hodge
President, Tax Foundation
Hearing before the U.S. Senate Committee on Finance
May 3, 2011
Mr. Chairman and members of the Committee:
I am Scott Hodge, president of the Tax Foundation. Thank you for the opportunity to speak to you today about the equity issues surrounding tax burdens and the benefits in the code.
Founded in 1937, the Tax Foundation is the nation’s oldest non-partisan, non-profit organization dedicated to promoting economically sound tax policy at all levels of government.
We are guided by the immutable principles of economically sound tax policy—taxes should be neutral to economic decision making, they should be simple, transparent, stable, and they should promote economic growth.
In other words, the ideal tax system should do only one thing—raise a sufficient amount of revenues to fund government activities with the least amount of harm to the economy.
By all accounts, the U.S. tax system is far from that ideal.
Introduction
Over the past two decades, lawmakers have increasingly asked the tax code to direct all manner of social and economic objectives, such as encouraging people to buy hybrid vehicles, turn corn into gasoline, save more for retirement, purchase health insurance, buy a home, replace the home’s windows, adopt children, put them in daycare, take care of Grandma, buy bonds, spend more on research, purchase school supplies, go to college, invest in historic buildings, and the list goes on.
The U.S. tax system is in desperate need of simplification and reform. The relentless growth of credits and deductions over the past 20 years has made the IRS a super-agency, engaged in policies as unrelated as delivering welfare benefits to subsidizing the manufacture of energy efficient refrigerators. I would argue that were we starting from scratch, these would not be the functions we would want a tax collection agency to perform.
So the question before the committee today is: “Is the distribution of tax burdens and tax benefits equitable?”
My answer is no, they are not. But not in the way most of you may think.
First, while it’s well understood that the major tax preferences largely benefit upper income taxpayers, the real issue is the harmful effects that these preferences are having on the economy and the people they are intended to benefit. The biggest crises facing working families and the economy are health care, housing, and state and local government finances, yet these are the areas in which government and the tax code is already the most involved. The cure for what ails these industries is to be weaned off the tax code, not given more subsidies through such things as the First Time Homebuyer’s Credit, Premium Assistance credits, or more tax free bonds.
Second, as a consequence of trying to use the tax code to help the “middle-class,” we have knocked millions of people off the tax rolls, turned the IRS into an extension of the welfare state, and created a growing class of people who are disconnected from the basic cost of government.
We need to have a national discussion over whether it is fair or equitable to have millions of people enjoy the benefits of civil society but contribute nothing to its costs. I believe that it is bad for democracy and bad for the fiscal health of the nation to have so many Americans with no skin in the game.
Lastly, while some people would like to make the tax code more progressive, the fact is that the U.S. already has the most progressive income tax system of any industrialized country. The top 1 percent of taxpayers pays a greater share of the tax burden than the bottom 90 percent combined. Moreover, the nation’s tax and spending policies currently combine to redistribute more than $826 billion annually from the top 40 percent of families to the bottom 60 percent. We should have an honest discussion over how much redistribution is considered fair.
The taxpayers who are now shouldering the lion’s share of the burden of funding government are what I call the “successful middle class” in America today. These are educated, dual-income families who are the heart of the nation’s successful entrepreneurial class. Unlike their parents, their incomes do not fit in the statistical middle of the income scale. They might be considered “rich” by some, but their values are distinctly middle class. We should question the wisdom of placing so much of the tax burden on the people who society values the most—working families and entrepreneurs.
Let’s examine these issues one by one.
The Harmful Effects of Tax Expenditures
With massive federal deficits as far as the eye can see, there is growing talk of cutting some of the roughly $1 trillion in “tax expenditures” or preferences in the code that effectively subsidize everything from charitable giving to purchasing electric cars. While it is tempting to look at “closing loopholes” as a honeypot for deficit reduction, the right reason to eliminate these tax preferences is that they are doing harm to the economy and, in many cases, the very people they are intended to help. The best solution for the nation is to eliminate the majority of these tax preferences while dramatically cutting tax rates.
Figure 1 shows the composition of the largest categories of tax expenditures in FY 2011. By far the largest of these, at $174 billion, is the tax exclusion for employer-provided health insurance. The next largest category, at $135 billion, is for the collection of tax exclusions for pensions, 401(k)s, Individual Retirement Accounts, and Keogh plans.
For the sake of comparability, I’ve included the actual outlay cost of the refundable portion of tax credits even though they are not included in the overall cost of traditional tax expenditures. However, as we will discuss later, they are among the fastest-growing tax preferences and now comprise the third-largest category of preferences in the tax code with an actual cost of $108 billion in 2011.
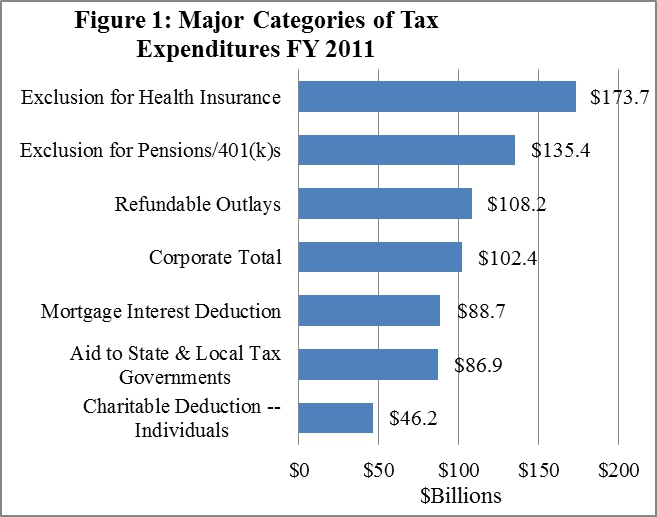
The amount of corporate “loopholes” is actually much less than what is commonly thought. Overall, the roughly 80 separate corporate tax preferences have a combined budgetary cost of roughly $102 billion in FY 2011, only slightly larger than the cost of the mortgage interest deduction alone.
As Figure 1 shows, the mortgage interest deductionThe mortgage interest deduction is an itemized deduction for interest paid on home mortgages. It reduces households’ taxable incomes and, consequently, their total taxes paid. The Tax Cuts and Jobs Act (TCJA) reduced the amount of principal and limited the types of loans that qualify for the deduction. confers roughly $89 billion in benefits to homeowners and the housing industry each year. State and local governments receive about $87 billion in benefits through the combined effects of the deduction for state and local taxes and through tax-exempt bonds. Lastly, charities benefit from about $46 billion in budgetary resources each year.
Tax expenditures and distributional issues: Setting aside for the moment the question of the true economic incidence of tax expenditures (i.e. who ultimately benefits from them), the major individual tax expenditures are largely claimed on the returns of upper-income taxpayers. For example, according to the Joint Committee on Taxation, 64 percent of the benefits of the mortgage interest deduction flow to taxpayers earning over $100,000, while 81 percent of the benefits of the deduction for state and local taxes (income, property, and sales) went to the same group.[1] Many rightfully argue that these provisions effectively subsidize high-tax communities at the expense of low-tax communities or subsidize homeowners at the expense of renters.
Similarly, JCT found that 80 percent of the benefits of the charitable deduction went to taxpayers earning over $100,000. To be sure, Americans earning under $100,000 give billions each year to charity, but because they are not among the roughly one-third of taxpayers who itemize on their tax returns, the tax code does not reward them for their generosity.
Tax expenditures causing today’s financial crises: Today, the biggest financial crises facing working families and the economy are health care, housing, and state and local government finances. Ironically, these are the areas in which government is already the most involved.
For example, the tax preference for employer-provided health insurance creates a classic third-party payer problem in which patient-consumers are disconnected from the cost of service. The cost of health care is soaring because we have an unlimited demand for health care since someone else is paying the bills. The market forces that deliver quality goods at low prices for everything from toasters to automobiles have been disrupted in the health care system because it is tax preferred. The recent health care reform legislation will make this problem worse, not better.
Housing suffers a similar problem because of the plethora of tax and spending subsidies intended to promote home ownership. Professor Dennis J. Ventry, Jr. of the UC Davis School of Law, calls the mortgage interest deduction (MID) the “accidental deduction,” because the authors of the original tax code never intended the deduction for personal interest expenses to subsidize home ownership.[2]
Economists find that the MID gets capitalized into the price of homes and may amplify price volatility,[3] which offsets whatever effect it has on promoting home ownership. The actual economic benefits of those capitalized costs tend to flow to the home builders and realtors, who have naturally been the most vocal opponents of eliminating the MID. One study determined that the MID is “an ineffective policy to promote homeownership and improve social welfare.”[4]
While the lion’s share of the blame for the current housing crisis properly rests with government-sponsored enterprises Fannie Mae and Freddie Mac, the MID certainly played a role in encouraging some families to purchase homes that they really could not have afforded otherwise. Canada does not have a mortgage interest deduction, yet its rate of homeownership is equal to that in the U.S. Even the Washington Post has editorialized that it is time to “[t]rim the excessive tax subsidy for real estate.”[5]
The deduction for state and local taxes and the tax subsidies for municipal bonds allow local governments to raise taxes and pass as much as one-third of those costs to Uncle Sam. This is especially true for high-cost, high-tax suburban communities. Ironically, the state and local tax deduction is the primary reason more and more taxpayers in these high-tax urban areas-largely in so-called Blue States-are being ensnared in the Alternative Minimum Tax. The AMT is not an issue for taxpayers in lower-tax states and communities.
One study found that the state and local tax deductionA tax deduction allows taxpayers to subtract certain deductible expenses and other items to reduce how much of their income is taxed, which reduces how much tax they owe. For individuals, some deductions are available to all taxpayers, while others are reserved only for taxpayers who itemize. For businesses, most business expenses are fully and immediately deductible in the year they occur, but others, particularly for capital investment and research and development (R&D), must be deducted over time. leads to higher local tax revenues “by increasing the rate of local property taxation.” Specifically, the authors found “that if deductibility were eliminated, the mean property taxA property tax is primarily levied on immovable property like land and buildings, as well as on tangible personal property that is movable, like vehicles and equipment. Property taxes are the single largest source of state and local revenue in the U.S. and help fund schools, roads, police, and other services. rate in our sample of 82 communities would fall by 0.00715 ($7.15 per thousand dollars of assessed property), or 21.1 percent of the mean tax rate.”[6]
In the same way that the MID encourages some families to purchase larger, more expensive homes than they otherwise could afford, federal tax subsidies for state and local activities may encourage some governments to buy more government than their taxpayers could otherwise afford. In recent years, state and local debt has grown significantly as a share of GDP according to Steven Malanga, a fellow with the Manhattan Institute. He estimates that:
Over the last decade, through good times and bad, total state and local debt has soared from $1.5 trillion in 2000 to $2.4 trillion (in current dollars). When that debt is added to other growing obligations that governments are racking up, using techniques like not paying their bills on time, state and local liabilities have increased from 15 percent of GDP in 2000 to an estimated 22 percent this year. In 1980, they were 12 percent.[7]

It is very likely that these governments would not have borrowed as much as they did were it not for the fact that tax-free municipal bonds allow them to pass some of that cost off to the federal government.
The Troubling Growth of the Nonpaying Population
While the tax code’s benefits to high-income taxpayers is well documented, less attention has been given to the growth in tax benefits targeted to low- and middle-income taxpayers. Since it was enacted in 1913, the income tax code has contained provisions—such as the standard deduction, personal exemption, and dependent exemption—that exempted low-income workers from tax or greatly reduced their income tax burden.
Figure 2 shows the fluctuation in the number and percentage of these “nonpayers” since 1950 and how that number has soared over the past decade.[8] The percentage of tax returns with no liability was fairly low in the 1960s and again in the early 1980s. The modern growth in the number of nonpayers was spurred by the expansion of the Earned Income Tax Credit (EITC) and the enactment of the $500 per-child tax creditA tax credit is a provision that reduces a taxpayer’s final tax bill, dollar-for-dollar. A tax credit differs from deductions and exemptions, which reduce taxable income rather than the taxpayer’s tax bill directly. in 1997. The 2001 and 2003 tax bills doubled the value of the credit to $1,000 and added a refundable component.
The number of nonpayers accelerated once again following the enactment of the Economic Stimulus Act of 2008 (which included a tax rebate of $300 per person, $600 per couple) and the American Recovery and Reinvestment Act of 2009, which included President Obama’s making-work-pay credit, first-time homebuyer credit, and the American Opportunity tax credit.[9]
While the final IRS data for 2009 and 2010 are not yet available, the data for 2008 shows that the tax rebates boosted the number of nonpayers to nearly 52 million, or roughly 36 percent of all tax filers. [10]
Nonpaying status used to be a sure sign of poverty or near-poverty, but Congress and the President have changed the tax laws to pull much of the middle class into the growing pool of nonpayers. The income level at which a typical family of four will owe no income taxes has risen rapidly, now topping $51,000.
Refundable Credits Soar: Some will argue that while the nonpayers may not owe any income taxes, they pay other federal taxes such as payroll taxes and excises taxes and, therefore, are still contributing to the cost of government. Not so.
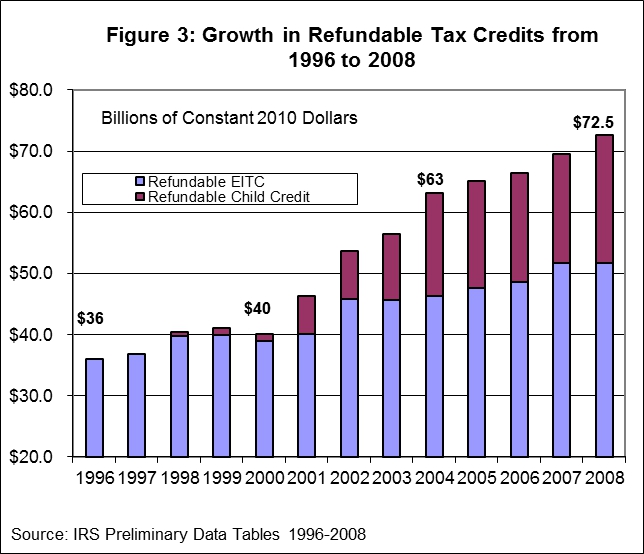
Many nonpayers receive generous cash payments through “refundable” tax programs such as EITC or the child tax credit which off-set the other taxes they may pay. In fact, as Figure 3 shows, the IRS paid out more than $72 billion in these refundable tax credits in 2008, double the amount of refundable tax credits in 1996.
These credits are so generous, that the Joint Committee on taxation estimates that in 2009, they exceeded the employee share of payroll taxes for 23 million tax filers and exceeded the employer’s share of payroll taxes for 15.5 million filers.[11]
In recent years, more and more tax provisions are resulting in a cash outlay from the IRS. In 2011 there are 13 tax provisions that will result in $108 billion in outlays. In five years, after the Premium Assistance Credit takes effect in 2014, tax outlays will top $117 billion.
What is wrong with so many nonpayers? There are actually more Americans outside of the income tax system than these figures would indicate. There are millions of people who earn some income but are below the threshold for filing a tax return. When these people are added to the nonpayers, the Tax Policy Center at Brookings estimates that 47 percent of all households pay no income taxes.[12]
Beside the fact that we are getting dangerously close to the “tipping point” in which there are more nonpayers than payers, there are many problems with having so many Americans exempted from income tax. On a practical level, we need to ask whether the proper function of the IRS is to deliver welfare benefits and income subsidies. Do we want millions of Americans to see April 15th as “payday” rather than “tax day?”
On a societal level, these citizens have no “skin in the game” yet they benefit greatly from government spending. I would argue that a functioning democracy cannot have nearly half of its citizens with no real connection to the basic cost of government but still have a legal claim on the government’s purse. Good citizenship requires that we contribute at least something to the basic cost of government if we are to enjoy the benefits of it.
On an economic level, we need to worry about a phenomenon that economists call “fiscal illusion.” When people perceive the cost of government is less than what it really is, they will demand ever more government knowing that someone else is picking up the check. This is already a problem because the $1.5 trillion deficits today are making the cost of government looks cheap for all of us.
Do the Rich Really Not Pay Their “Fair Share”?
There is a common belief that because of the 2001 and 2003 tax cuts—as well as the fact the so many tax expenditures benefit upper-income taxpayers—that the “rich” are not paying their fair share of taxes. Nothing could be further from the truth.
Indeed, the OECD finds that the U.S. has the most progressive income tax system of any industrialized country. What that means is that the top 10 percent of U.S. taxpayers pay a larger share of the income tax burden than do the wealthiest decile in any other industrialized country, including traditionally “high-tax” countries such as France, Italy, and Sweden.[13]
Meanwhile, because of the generosity of such preferences as the EITC and child credit, low-income Americans have the lowest income tax burden of any OECD nation. Indeed, the study reports that while most countries rely more on cash transfers than taxes to redistribute income, the U.S. stands out as “achieving greater redistribution through the tax system than through cash transfers.”[14]

The share of the income tax burden borne by America’s wealthiest taxpayers has been growing steadily for more than two decades. Figure 4 contrasts the share of income taxes paid by the bottom 90 percent, top 10 percent, and top 1 percent of taxpayers between 1987 and 2008.
Between 1987 and 2008, the tax burden on the top 10 percent of taxpayers grew from 55.6 percent to 70 percent, while the burden on the top 1 percent grew from 24.8 percent to 38 percent. By contrast, the tax burden for the bottom 90 percent of taxpayers fell from 44.4 percent in 1987 to 30 percent in 2008.
In other words, the tax burden on the top 1 percent of taxpayers is greater than the total burden on the bottom 90 percent of taxpayers. And the tax burden on the top 10 percent is more than twice that of the bottom 90 percent combined. By any measure, this is the sign of a very progressive tax system.
Measuring the Distribution of Both Taxes and Spending
While the topic of this hearing is the equity of the tax burden and tax expenditures, it is a mistake to focus solely on the distributional effects of tax policy without considering the distributional effects of spending. After all, federal spending is intended to achieve various policy objectives and benefit different groups of Americans in different ways. Thus, it is important to look at the progressivity of the entire fiscal system, not just the tax side.
In an important 2009 study, Tax Foundation economists measured how much families at various income levels paid in taxes versus how much they received in spending benefits. The results of this analysis show that federal tax and spending policies are very heavily tilted to the poor and middle-class, even before considering the Obama administration’s major policy initiatives such as health care reform.
Overall, the study found that in 2010, the bottom 60 percent of families—those earning up to about $86,000—got more in federal spending benefits than they paid in taxes. By contrast, the top 40 percent of families paid more in taxes than they received in federal spending benefits.
Figure 5 illustrates the ratio of taxes paid to spending received on a per-family basis. Not surprisingly, the lowest-income families received $10.44 for every dollar they paid in taxes. Remarkably, however, families in the middle-income group received $1.15 for every dollar they paid in taxes.

By contrast, the highest-income families received 43 cents in government spending for every dollar they pay in taxes, even though they are assumed in this study to disproportionately benefit from public goods such as national defense.
Taken together, federal tax and spending policies work to redistribute more than $826 billion in income from the top 40 percent of families to the bottom 60 percent. In other words, the entire federal fiscal system is very progressive and redistributive.
Putting a Face on America’s Successful Middle Class
In Washington, every tax discussion begins with the premise that tax policies should either help or at least protect the “middle class.” And by middle class, most politicians tend to equate the “middle class” with the median taxpayer or those in the statistical middle.
But middle-income is not the same as middle class. Middle-income is a point on the income scale for which only a handful of people can qualify. But middle class is a value system that most Americans identify with. Indeed, polls show that 80 percent of Americans see themselves as middle class. Only 2 percent identify themselves as “upper class.”
June and Ward have been replaced in the middle by Phoebe and Joey. When we think of middle class families, we think of intact, working couples with children—such as June and Ward Cleaver from the 1950s show “Leave it to Beaver.”
Once upon a time, June and Ward did represent the statistical middle, but demographic changes have made those old notions obsolete. Today, these families are considered upper-income or “rich” by some standards.

Figure 6 gives us a snapshot of the distribution of filing status within each quintile in 1960. It shows the percentage of single filers, married filers, and married filers with children within each quintile.
We can see that in 1960, married taxpayers were the majority of filers within every quintile but the lowest. More than 70 percent of filers in the lowest quintile were single workers. However, in the middle quintile, married couples comprised 68 percent of the filers, twice the number of singles. Moreover, 50 percent of all filers in the middle were married couples with children, such as June and Ward Cleaver. In the top two quintiles, nearly every taxpayer was a married couple.

Over the past five decades there have been many demographic and economic changes that have greatly reshaped the composition of American taxpayers. Figure 7 shows the composition of taxpayers within each quintile in 2006, from the most current IRS public use file.
The most startling change is the dramatic increase in the number of single filers in first three quintiles—especially the middle quintile. Whereas in 1960 there were twice as many married couples in the statistical middle as there were single filers, today there are twice as many single filers as there are married couples.
In other words, in the statistical “middle class,” June and Ward have been replaced by Phoebe and Joey from the once popular TV show “Friends.”
Where on the distributional charts do we find married couples, especially those with children? They now populate the top two quintiles. Indeed, over 70 percent of married taxpayers with children are now in the top two quintiles. However, even in fourth quintile, just 55 percent of filers are married and only 28 percent are married with children. At the top of the income scale, married taxpayers comprise 82 percent of filers in the highest quintile; some 45 percent are families with children.
Four factors contributed to these demographic and economic shifts. While America has certainly changed a great deal since 1960, there are four main factors that contributed to the vast changes in the composition of taxpayers across the income scales:
1. The growth of dual-earner couples;
2. The growth of pass-through business entities;
3. The aging of Baby Boomers; and
4. The economic returns to education.
For the sake of brevity, I am going to focus on the first two factors. But previous Tax Foundation research found that taxpayers in the top income group were 50 percent older than taxpayers at the bottom of the income scale. We also found that more than 80 percent of high-income taxpayers had some college education or more, while roughly 62 percent of low-income taxpayers had a only a high school education or less.[15] The education gap in America should probably worry lawmakers much more than the income gap.

As Figure 8 illustrates, America has become a nation of dual-income working couples. While it is clear from the chart that the husband-as-sole-breadwinner stereotypical family of the 1960s was not the norm then, it is even less so today. Moms worked during the 1960s but fewer than half of all married couples during that era were dual-earners. Today, that number has risen to 67 percent, three times the number of sole-earner married couples.
These two-earner couples don’t reside in the statistical middle of the income scale. Instead, they populate the top 20 percent of families, and look comparatively “rich” on paper because of their two full-time paychecks.
The Successful Middle Class is America’s Entrepreneurial Class
What also sets the successful middle class apart from other taxpayers is that they derive a large share of their overall earnings from flow-through businesses such as S-corporations, LLCs, and partnerships. Over the past 30 years, the number of these non-corporate business forms has exploded such that there is now more business income taxed under the individual tax code than the traditional corporate code.

Between 1980 and 2007, for example, the number of sole proprietors grew from 8.9 million to more than 23 million, and the number of S-corporations and partnerships (which include LLCs) grew at a faster rate from 1.9 million to more than 7 million. There are now three and one-half times as many pass-through firms as traditional C-corporations.[16]
While we often here the statistic that only 2 or 3 percent of tax returns pay tax in the top two brackets, the more economically relevant question is how much business income is earned by those in the top tax brackets.
To understand how significant business income is for these upper-income taxpayers, Figure 9 illustrates how much more business income there is at the top of the income scale compared to the amount of salary and wage income or to the broader measure of adjusted gross income (AGI).
Looking first at the distribution of adjusted gross incomeFor individuals, gross income is the total pre-tax earnings from wages, tips, investments, interest, and other forms of income and is also referred to as “gross pay.” For businesses, gross income is total revenue minus cost of goods sold and is also known as “gross profit” or “gross margin.” (AGI)—the measure by which most distributional discussions revolve—we find that it is dispersed roughly equally among taxpayers earning less than $100,000, but 22 percent is earned by taxpayers with incomes between $100,000 and $200,000, and 30 percent is earned by taxpayers with incomes above $200,000.
Salary and wage income follows roughly the same pattern except for the highest earning taxpayers. The largest share of salaries and wages, 24 percent, are earned by families with incomes between $100,000 and $200,000. Interestingly, taxpayers who earn above $200,000 take home 20 percent of overall salary and wage income, less than their share of total AGI. This indicates that other sources of income play a large role in their overall compensation.
Indeed, Figure 9 shows that nearly two-thirds of all flow-through business income is earned by taxpayers earning over $200,000, twice the amount of business income earned by all other income groups combined.
Another way of looking at the distribution of business income is to see how many taxpayers at the highest tax bracketsA tax bracket is the range of incomes taxed at given rates, which typically differ depending on filing status. In a progressive individual or corporate income tax system, rates rise as income increases. There are seven federal individual income tax brackets; the federal corporate income tax system is flat. have business income. According to Tax Policy Center estimates, more than 74 percent of tax filers in the highest tax bracket report business income, compare to 20 percent of those at the lowest bracket.
While they may be relatively few in number, these statistics clearly indicate that high-income taxpayers represent the most successful flow-through businesses.
Tax Fairness and Mobility
Most debates about the equity of the tax burden are waged over static distributional tables that record the incomes and tax burdens of taxpayers in a single year. However, there is a great deal of mobility in America as people move through the various stages of life. So policies that try to target “the rich” or benefit “the poor” are likely to be ineffective because they are aiming at a moving target.
A recent Tax Foundation study used special Treasury panel data to look at the mobility of taxpayers between 1999 and 2007.[17] The findings suggest that concerns over increased income inequality should be tempered by the fact that a substantial number of households move up or down through the income distribution over time.
Among the key findings:
• Nearly 60 percent of households in the bottom income quintile in 1999 were in a higher quintile in 2007, and roughly 40 percent of tax returns in the top quintile in 1999 were in a lower quintile in 2007.
• Roughly half of millionaires during the1999 through 2007 period attained this status just once during those nine years. Only 6 percent of this group were millionaires in all nine years.
• The volatile nature of capital gains realizations appears to be a major explanation for the transiency of millionaires.
IRS data on the so-called Fortunate 400 also shows that wealthy Americans are not a static elite club that no one can penetrate. Indeed, the report indicates a great deal of churning among the top 400 taxpayers over a 15 year period. Over that period, 3,305 taxpayers had large enough incomes to put them among the Fortunate 400 at least once. However, 73 percent of these taxpayers appeared on the list just once and about 15 percent appeared more than twice. In any given year, 40 percent of these taxpayers had never been on the list in any other year.[18]
Conclusion
The U.S. tax system is in desperate need of simplification and reform. While targeted tax cuts will always curry more favor with voters than new spending programs, Washington needs to call a truce to using the tax code for social or economic goals. The consequence of trying to micromanage the economy as well as individual citizens’ behavior through the tax code has produced a narrow tax base and unnecessarily high tax rates. These high rates are endangering America’s global competitiveness and undermining the nation’s long-term economic growth.
I suggest that we develop a new way of thinking about equity in the tax code. We should strive to build consensus around these basic concepts:
• An equitable tax system should be free of most credits or deductions and not micromanage individual or business behavior. It should apply a single, low flat rate on most everyone equally. That way, every citizen pays at least something toward the basic cost of government.
• An equitable tax code should be simple—which would save all of us time, money and headache and would save the economy the deadweight loss of the current system.
• An equitable tax code should have dramatically lower rates than we have today – in the mid-20s according the Bowles-Simpson plan—and the government could still raise the same amount of revenues.
I believe that such a tax code would actually generate a more predictable and stable revenue stream to fund government programs as opposed to the roller coaster revenues we have today.
And, most importantly, such a tax code would be conducive to long-term economic growth, which is one of the keys to fixing the long-term fiscal crisis facing the country.
Thank you, I’m happy to answer any questions you may have.
[1]. “Estimates of Federal Tax Expenditures for Fiscal Years 2010-2014,” Joint Committee on Taxation, U.S. Government Printing Office, December 15, 2010, p. 55-56.
[2]. Dennis J. Ventry, Jr., “The Accidental Deduction: A History and Critique of the Tax Subsidy for Mortgage Interest,” UC Davis Legal Studies Research Paper Series, Research Paper No. 196, November 2009.
[3]. Dan Andrews, “Real House Prices in OECD Countries: The Role of Demand Shocks and Structural and Policy Factors,” OECD Economics Department Working Papers, No. 831, OECD Publishing, 2010.
[4]. Christian A. L. Hilber and Tracy M. Turner, “The mortgage interest deduction and its impact on homeownerhip decisions,” August 2010.
[5]. “Trim the excessive tax subsidy for real estate,” Washington Post, January 1, 2011.
[6]. Douglas Holtz-Eakin and Harvey S. Rosen, “Federal Deductibility and Local Property Tax Rates,” NBER Working Paper Series, Vol. w2427, December 1990.
[7]. Steven Malanga, “The Muni-Bond Debt Bomb. . . and how to dismantle it,” City Journal, Summer 2010, Vol. 20, No. 3. http://www.city-journal.org/2010/20_3_muni-bonds.html
[8]. Individual Income TaxAn individual income tax (or personal income tax) is levied on the wages, salaries, investments, or other forms of income an individual or household earns. The U.S. imposes a progressive income tax where rates increase with income. The Federal Income Tax was established in 1913 with the ratification of the 16th Amendment. Though barely 100 years old, individual income taxes are the largest source of tax revenue in the U.S. Returns, Tax Year 2008 Preliminary Data: Selected Income and Tax Items, by Size of Adjusted Gross Income. Internal Revenue Service. http://www.irs.gov/pub/irs-soi/08in01pl.xls.
[9] http://www.taxfoundation.org/legacy/show/24382.html
[10]. Scott A. Hodge, “Record Numbers of People Paying No Income Tax; Over 50 million “Nonpayers” Include Families Making over $50,000,” Tax Foundation Fiscal Fact No. 214, p. 4.
[11]. Joint Committee on Taxation, Letter to Representative Dave Camp and Senator Kent Conrad, May 28, 2010.
[12] http://www.taxpolicycenter.org/taxtopics/federal-taxes-households.cfm
[13]. “Growing Unequal? Income Distribution and Poverty in OECD Countries,” Organization for Economic Cooperation and Development, 2008. p. 112. http://dx.doi.org/10.1787/422013187855. Here income taxes refer to both personal and social insurance taxes.
[15] Scott A. Hodge, Putting a Face on America’s Tax Returns, Tax Foundation, 2005.p. 15.
[16] Scott A. Hodge, “Over One-Third of New Tax Revenue Would Come from Business Income if High-Income Personal Tax Cuts Expire,” Tax Foundation Special Report No. 185, September 2010, p. 4.
[17] Robert Carroll, “Income Mobility and the Persistence of Millionaires, 1999 to 2007,” Tax Foundation Special Report No. 180, June 2010.
[18] http://www.irs.gov/pub/irs-soi/06intop400.pdf
Share this article