Facts & Figures 2026: How Does Your State Compare?
Facts & Figures serves as a one-stop state tax data resource that compares all 50 states on over 40 measures of tax rates, collections, burdens, and more.
2 min readProviding journalists, taxpayers, and policymakers with the latest data on taxes and spending is a cornerstone of the Tax Foundation’s educational mission.
As a nonpartisan, educational organization, the Tax Foundation has earned a reputation for independence and credibility. Our state tax policy team regularly provides accessible, data-driven insights on state tax rates, collections, burdens and more, from sources such as the U.S. Census Bureau, Internal Revenue Service (IRS), and others.

Get facts about taxes in your state and around the US

Facts & Figures serves as a one-stop state tax data resource that compares all 50 states on over 40 measures of tax rates, collections, burdens, and more.
2 min read
Individual income taxes are a major source of state government revenue, accounting for more than a third of state tax collections. How do income taxes compare in your state?
9 min read
Retail sales taxes are an essential part of most states’ revenue toolkits, responsible for nearly a quarter of combined state and local tax collections.
18 min read
Forty-four states levy a corporate income tax, with top rates ranging from a 2 percent flat rate in North Carolina to an 11.5 percent top marginal rate in New Jersey. Four states—Georgia, Nebraska, North Carolina, and Pennsylvania—reduced their corporate income tax rates effective January 1, 2026.
5 min read
Property taxes are the primary tool for financing local governments. While no taxpayers in high-tax jurisdictions will be celebrating their yearly payments, property taxes are largely rooted in the benefit principle of taxation: the people paying the property tax bills are most often the ones benefiting from the services.
9 min read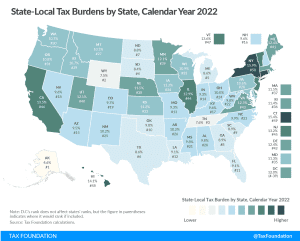
Tax burdens rose across the country as pandemic-era economic changes caused taxable income, activities, and property values to rise faster than net national product. Tax burdens in 2020, 2021, and 2022 are all higher than in any other year since 1978.
24 min read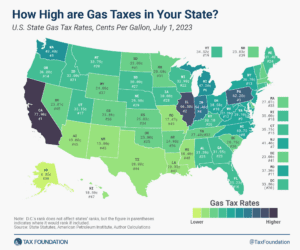
California pumps out the highest state gas tax rate of 77.9 cents per gallon (cpg), followed by Illinois (66.5 cpg) and Pennsylvania (62.2 cpg).
2 min read
However well-intended they may be, sales tax holidays remain the same as they always have been—ineffective and inefficient.
4 min read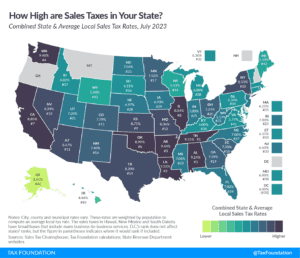
Compare the latest 2023 sales tax rates as of July 1st. Sales tax rate differentials can induce consumers to shop across borders or buy products online.
8 min read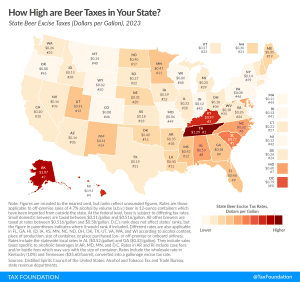
Taxes are the single most expensive ingredient in beer, costing more than the labor and raw materials combined.
3 min read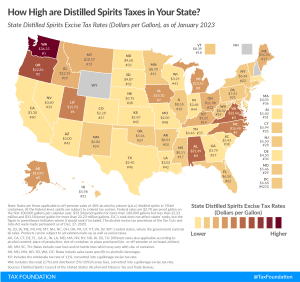
Of all alcoholic beverages subject to taxation, stiff drinks—and all distilled spirits—face the stiffest tax rates. Like many excise taxes, the treatment of distilled spirits varies widely across the states.
4 min read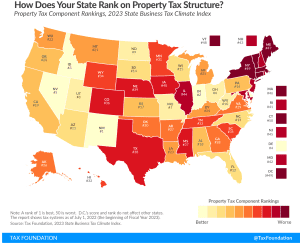
States are in a better position to attract business investment when they maintain competitive real property tax rates and avoid harmful taxes on tangible personal property, intangible property, wealth, and asset transfers.
5 min read