Introduction
Earlier this month, President Obama renewed his pledge to raise taxes on high-income earners, premised upon the belief that they do not pay their “fair share.”[1] However, the latest data reveals that their share, whether fair or not, has actually gone up in recent years, while the share paid by everyone else has gone down. For instance, the top 20 percent of households now pay more than 94 percent of federal income taxes, a record high. The data also shows that effective taxA tax is a mandatory payment or charge collected by local, state, and national governments from individuals or businesses to cover the costs of general government services, goods, and activities. rates have been going down for almost everyone, except the top 1 percent of households. Meanwhile, there is no evidence of a long-term trend in income inequality, but rather temporary peaks caused by two historic stock market bubbles. For instance, in the wake of the 2008 financial crisis and ensuing stock market collapse, the share of income earned by the top 1 percent has collapsed back to where it was in the late-1980s and mid-1990s.
High Taxes for Some, Negative Taxes for Others
The charts below show the latest data from the Congressional Budget Office (CBO) on income and federal taxes paid by households from 1979 to 2009.[2] In Figure 1, we can see that average effective income tax rates have declined considerably for almost everyone, except the top 1 percent of earners.
The decline is most pronounced for the bottom quintile (bottom 20 percent) of households, whose average tax rateThe average tax rate is the total tax paid divided by taxable income. While marginal tax rates show the amount of tax paid on the next dollar earned, average tax rates show the overall share of income paid in taxes. went from zero in 1979 to a new record low of -9.3 percent in 2009. That means low-income households now receive more from the IRS in terms of refundable tax credits, such as the Earned Income Tax CreditA tax credit is a provision that reduces a taxpayer’s final tax bill, dollar-for-dollar. A tax credit differs from deductions and exemptions, which reduce taxable income rather than the taxpayer’s tax bill directly. , than they pay in taxes.[3] This trend has accelerated since 2007, when their tax rate was -5.8 percent, mainly because of higher unemployment and underemployment.

The next quintile up the income scale shows the same basic pattern. The average income tax rate went from 4 percent in 1979 to -2.6 percent in 2009, also a record low. The IRS is now a spending agency for the bottom 40 percent of households, meaning that the IRS spends more than it receives.
The middle quintile, commonly considered the “middle class,” now has an effective income tax rate of 1.3 percent, down from 7.4 percent in 1979. For all four of the bottom quintiles (i.e., the bottom 80 percent of households), the income tax rate has been dropping steadily since the early 1980s.
In contrast, the tax rate on the top 20 percent has remained relatively constant at about 14 percent of income. The tax rate on the top 1 percent has also remained relatively constant but at a higher rate of about 21 percent. Since 2007, the tax rate on the top 1 percent has actually increased, from 19.4 percent to 21 percent, such that it is higher now than at any time since the Bush tax cuts. This is largely due to the collapse of the stock market, which reduced capital gains as a source of income.[4]
High Income Households Paying a Larger Share of Income Taxes
The share of income taxes paid by top earners has increased as well. As Figure 2 shows, the share paid by the top 20 percent of households was 94.1 percent in 2009, just shy of the record high of 94.6 percent in 2008. This is up from 64.7 percent in 1979.
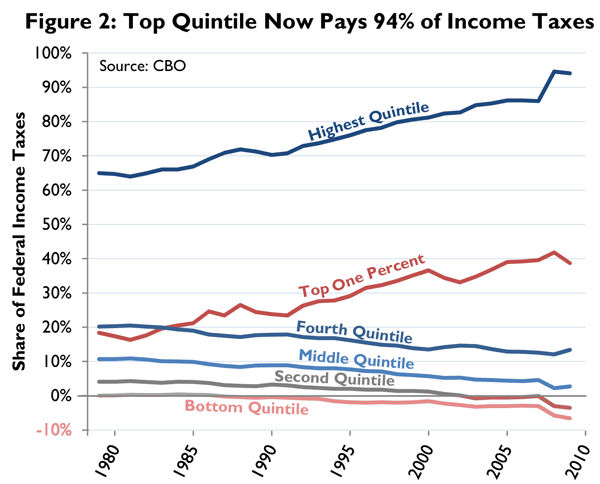 Likewise, the share of taxes paid by the top 1 percent has increased from 18.4 percent in 1979 to 38.7 percent in 2009. In contrast, the share of income taxes paid by the bottom four quintiles has decreased since 1979, particularly since 2007.
 All of this points to the increasing progressivity of the federal income tax code. The CBO measures the progressivity of the tax code in two ways, both of which are depicted in Figure 3. Progressivity is at a record high when measured by the concentration of tax payments.[5] It is just off the record high of 2008 when measured by the equalization of the income distribution; in other words, by the effect of income taxes on the distribution of income.[6] Using data from the mid-2000s, the Organization for Economic Cooperation and Development (OECD) found that the U.S. had the most progressive taxA progressive tax is one where the average tax burden increases with income. High-income families pay a disproportionate share of the tax burden, while low- and middle-income taxpayers shoulder a relatively small tax burden.
system in the developed world.[7] No doubt this continues to be the case.[8]
All of this points to the increasing progressivity of the federal income tax code. The CBO measures the progressivity of the tax code in two ways, both of which are depicted in Figure 3. Progressivity is at a record high when measured by the concentration of tax payments.[5] It is just off the record high of 2008 when measured by the equalization of the income distribution; in other words, by the effect of income taxes on the distribution of income.[6] Using data from the mid-2000s, the Organization for Economic Cooperation and Development (OECD) found that the U.S. had the most progressive taxA progressive tax is one where the average tax burden increases with income. High-income families pay a disproportionate share of the tax burden, while low- and middle-income taxpayers shoulder a relatively small tax burden.
system in the developed world.[7] No doubt this continues to be the case.[8]
Decreasing Income Inequality
Confirming an analysis I did earlier this year, [9] the CBO finds that income inequality has decreased dramatically since 2007. As Figure 4 shows, the share of income earned by the top 1 percent is now back where it was in the mid-1990s.[10] Here again the evidence points to no long-term trend in inequality since the 1980s. Rather, there were two large cycles up and down corresponding to historic stock market bubbles in the late 1990s and mid-2000s. High-income earners receive much of their income from capital gains, so their fortunes are particularly tied to the stock market.[11]
 Figure 4 also shows that President Clinton’s tax policy had about the same effect on income inequality that Bush’s did, i.e., very little relative to the stock market. Under the Clinton rates, from 1993 to 2002, tax policy reduced the income share of the top 1 percent by 2.1 percentage points on average.[12] Under President Bush, from 2003 to 2009, the reduction was 2.0 percentage points. In contrast, the stock market correction of 2000-2002 reduced the income share of the top 1 percent by more than 4 percentage points, and the 2007-2009 correction reduced it by more than 5 percentage points.[13]
Conclusion
Much fanfare was made of the CBO’s last report on this topic, which showed income inequality reaching new heights in 2007.[14] Other organizations, such as the Congressional Research Service, piled on as well, suggesting a relentless march towards greater income inequality.[15] The CBO’s update of the report to include data through 2009 shows this interpretation was unwarranted. Instead, it appears income inequality has mainly gone up and down with the stock market since the late 1980s, with no discernible long-term trend.
This CBO report does confirm one ongoing trend: greater redistribution through the tax code. Progressivity of federal income taxes is at a record high. Effective income tax rates have gone negative for the bottom 40 percent of households and are approaching zero for the 20 percent of households considered the “middle class.” In contrast, tax rates on the top 1 percent of households have remained high at about 21 percent. As a result, the share of income taxes paid by the top 1 percent has increased dramatically since 1979, reaching 38.7 percent in 2009. The top 20 percent of households now pay more than 94 percent of income taxes, roughly matching the record high set in 2008.
[1] Nick Kasprak, That $250,000 Threshold: How Does It Work?, Tax Foundation Tax Policy Blog (Juy 11, 2012), https://taxfoundation.org/blog/250000-threshold-how-does-it-work.
[2] Congressional Budget Office, The Distribution of Household Income and Federal Taxes, 2008 and 2009 (July 10, 2012), http://cbo.gov/publication/43373.
[3] Tax Foundation, Tax Facts for Journalist (and Taxpayers) (Apr. 11, 2012), https://taxfoundation.org/article/tax-facts-journalists-and-taxpayers.
[4] William McBride, The Great RecessionA recession is a significant and sustained decline in the economy. Typically, a recession lasts longer than six months, but recovery from a recession can take a few years. and Volatility in the Sources of Personal Income, Tax Foundation Fiscal Fact No. 316 (June 13, 2012), https://taxfoundation.org/article/great-recession-and-volatility-sources-personal-income.
[5] The progressivity index based on the concentration of tax payments, known as the Kakwani index, is calculated as the difference between a concentration index for tax payments and the Gini index for before-tax income. The Gini index is a standard measure of inequality based on shares of income and shares of the population. The Gini index ranges from zero, indicating complete equality, to one, indicating complete inequality. For more, see Congressional Budget Office, Trends in the Distribution of Household Income Between 1979 and 2007, Appendix, Oct. 2011.
[6] The progressivity index based on the equalization of the income distribution, known as the Reynolds-Smolensky index, is calculated as the difference between the Gini indexes for income before and after federal income taxes.
[7] Scott Hodge, News to Obama: The OECD Says the United States Has the Most Progressive Tax System, Tax Foundation Tax Policy Blog (Oct. 29, 2008), https://taxfoundation.org/blog/news-obama-oecd-says-united-states-has-most-progressive-tax-system.
[8] The federal tax code as a whole is progressive and becoming more so. For instance, the CBO finds that the top 1 percent has a total combined federal tax rate of 28.9 percent versus a 1.0 percent tax rate for the bottom quintile. The top 1 percent pays 22.3 percent of all federal taxes versus 1.0 percent for the bottom quintile. Likewise, the CBO finds that the progressivity of the entire federal tax system is at a record high.
[9] William McBride, Reversal of the Trend: Income Inequality Now Lower than It Was under Clinton, Tax Foundation Fiscal Fact No. 289 (Jan. 30, 2012), https://taxfoundation.org/article/reversal-trend-income-inequality-now-lower-it-was-under-clinton.
[10] The CBO also measures income inequality using the Gini index and the result is roughly the same, that inequality is about where it was in the mid-1990s. See note 5 for a description of the Gini index.
[11] William McBride, The Great Recession and Volatility in the Sources of Personal Income, Tax Foundation Fiscal Fact No. 316 (June 13, 2012), https://taxfoundation.org/article/great-recession-and-volatility-sources-personal-income.
[12] Under President Clinton, the top marginal rate for ordinary income was 39.6 percent and for capital gains was as high as 28 percent. See Tax Foundation, Center for Federal Tax Policy, https://taxfoundation.org/tax-topics/federal-taxes.
[13] The same result can be seen in Figure 3, in the measure of progressivity based on the equalization of the income distribution. Progressivity in this case is measured as the effect of tax policy on the Gini coefficient, which is a measure of inequality. The Clinton and Bush tax rates have about the same effect.
[14] William McBride & David Logan, Occupy CBO: A Misleading Report on Income Inequality, Tax Foundation Tax Policy Blog (Oct. 26, 2011), https://taxfoundation.org/blog/occupy-cbo-misleading-report-income-inequality.
[15] William McBride, Reversal of the Trend: Income Inequality Now Lower than It Was under Clinton, Tax Foundation Fiscal Fact No. 289 (Jan. 30, 2012), https://taxfoundation.org/article/reversal-trend-income-inequality-now-lower-it-was-under-clinton.