This week the Internal Revenue Service published its early release data on individual income taxAn individual income tax (or personal income tax) is levied on the wages, salaries, investments, or other forms of income an individual or household earns. The U.S. imposes a progressive income tax where rates increase with income. The Federal Income Tax was established in 1913 with the ratification of the 16th Amendment. Though barely 100 years old, individual income taxes are the largest source of tax revenue in the U.S. rates and shares for 2017. The release is timely given the current debate on the distribution of taxes in the United States. However, it is worth noting some of its limits and how it differs from data currently being cited about the taxA tax is a mandatory payment or charge collected by local, state, and national governments from individuals or businesses to cover the costs of general government services, goods, and activities. burden in the United States.
According to this data, in 2017, the top 1 percent of taxpayers paid an average federal income tax rate of 26.76 percent. The bottom 99 percent, or all the rest of the taxpayers, paid an average rate of 11.4 percent. If we look at just the bottom 50 percent, the average rate paid by these taxpayers is even lower, at 4 percent.
At the very top end of the AGI distribution, we see average rates decrease slightly, but remain significantly higher than the average rates paid by those lower on the income distribution: 25 percent for the top 0.01 percent and 24 percent for the top 0.001 percent.
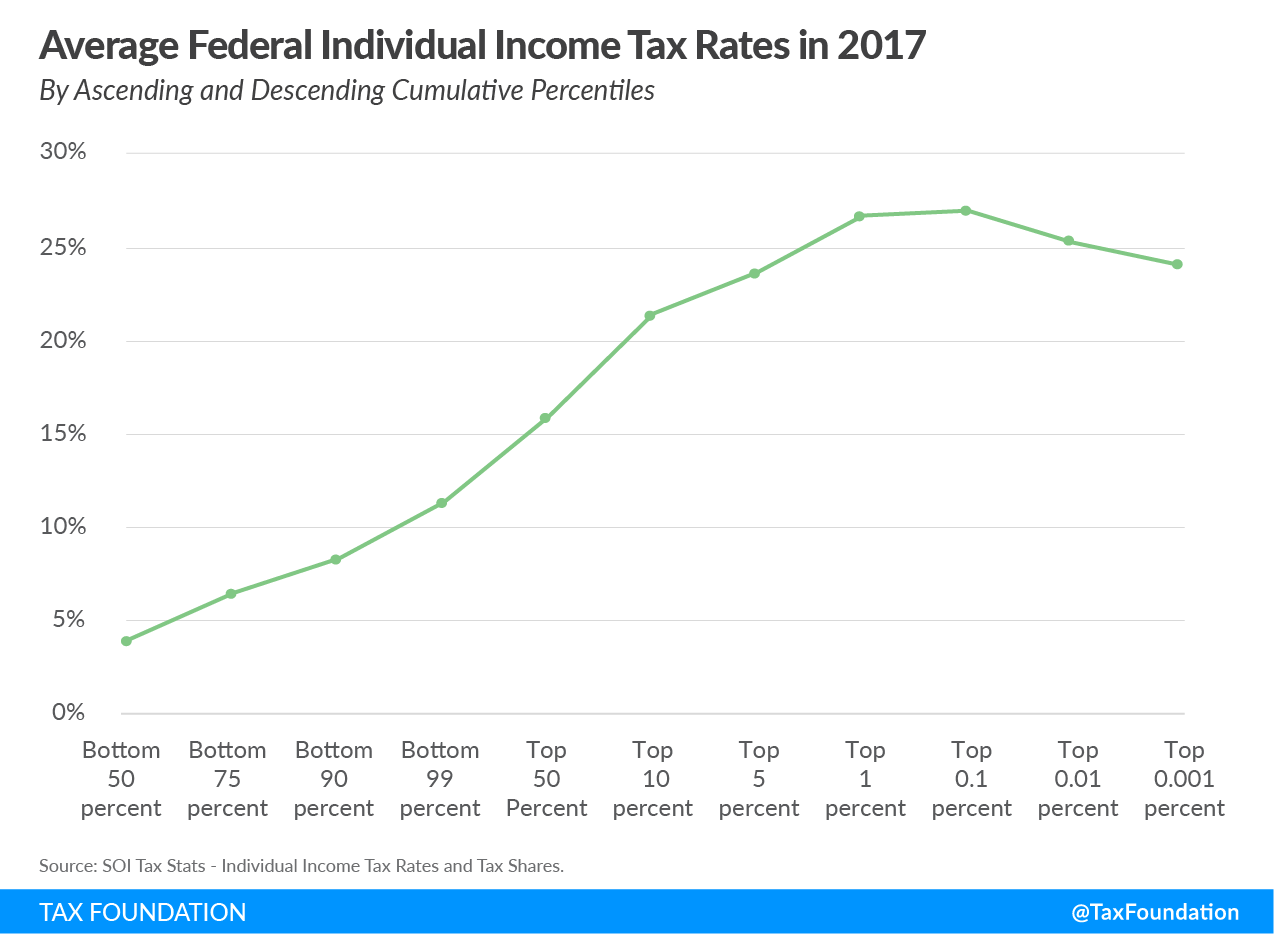
In 2017, the top 1.4 million tax returns faced an average rate more than twice as high as the bottom 141.9 million tax returns. The top half of taxpayers paid an average rate (15.99 percent) nearly four times the bottom half’s average rate (4.05 percent). And the top 0.001 percent, or the richest 1,433, in terms of AGI, paid an average federal income tax rate (24.09 percent) nearly six times that of the bottom half.
There are obviously several large differences between this IRS data and the new data being debated, which comes from a new book by economists Emmanuel Saez and Gabriel Zucman.
First, the IRS only considers the federal individual income tax. The data currently being discussed includes not just the federal individual income tax, but all federal, state, and local taxes. Some of these taxes, such as the corporate tax, are more progressive than the income tax. Other taxes, such as sales and excise taxes, are less progressive.
Second, the IRS data uses adjusted gross incomeFor individuals, gross income is the total pre-tax earnings from wages, tips, investments, interest, and other forms of income and is also referred to as “gross pay.” For businesses, gross income is total revenue minus cost of goods sold and is also known as “gross profit” or “gross margin.” as the income measurement. AGI is a rather narrow income measure that leaves out important sources of income for taxpayers at the bottom of the distribution, such as transfer payments, and for taxpayers at the top of the distribution, such as unrealized capital income.
And finally, the 2017 data does not account for changes made by the new tax law passed at the end of 2017, the Tax Cuts and Jobs Act. Data for 2018 will likely show a drop in average taxes rates across all income levels, but a somewhat larger drop for the highest-income earners.
The IRS data shows a picture of a progressive individual income tax in 2017, but remember it is only looking at one of the many types of taxes that individuals face and excludes some important types of income that individuals earn.
Stay informed on the tax policies impacting you.
Subscribe to get insights from our trusted experts delivered straight to your inbox.
Subscribe