The Organisation for Economic Co-operation and Development (OECD) recently published a report on taxA tax is a mandatory payment or charge collected by local, state, and national governments from individuals or businesses to cover the costs of general government services, goods, and activities. revenue statistics in selected Asian and Pacific countries, covering 17 tax jurisdictions. The report provides tax revenue data from 2007 to 2017 and includes a section on nontax revenue data for selected Pacific economies.
Tax revenue as a percent of GDP (tax-to-GDP ratio) varies significantly across the countries covered, with the highest ratio in New Zealand (32.0 percent) and the lowest ratio in Indonesia (11.5 percent). While all countries covered have a lower tax-to-GDP ratio than the OECD average (34.2 percent), about half of the countries’ ratios are higher than the Latin America and the Caribbean average (22.8 percent) and the African average (18.2 percent).
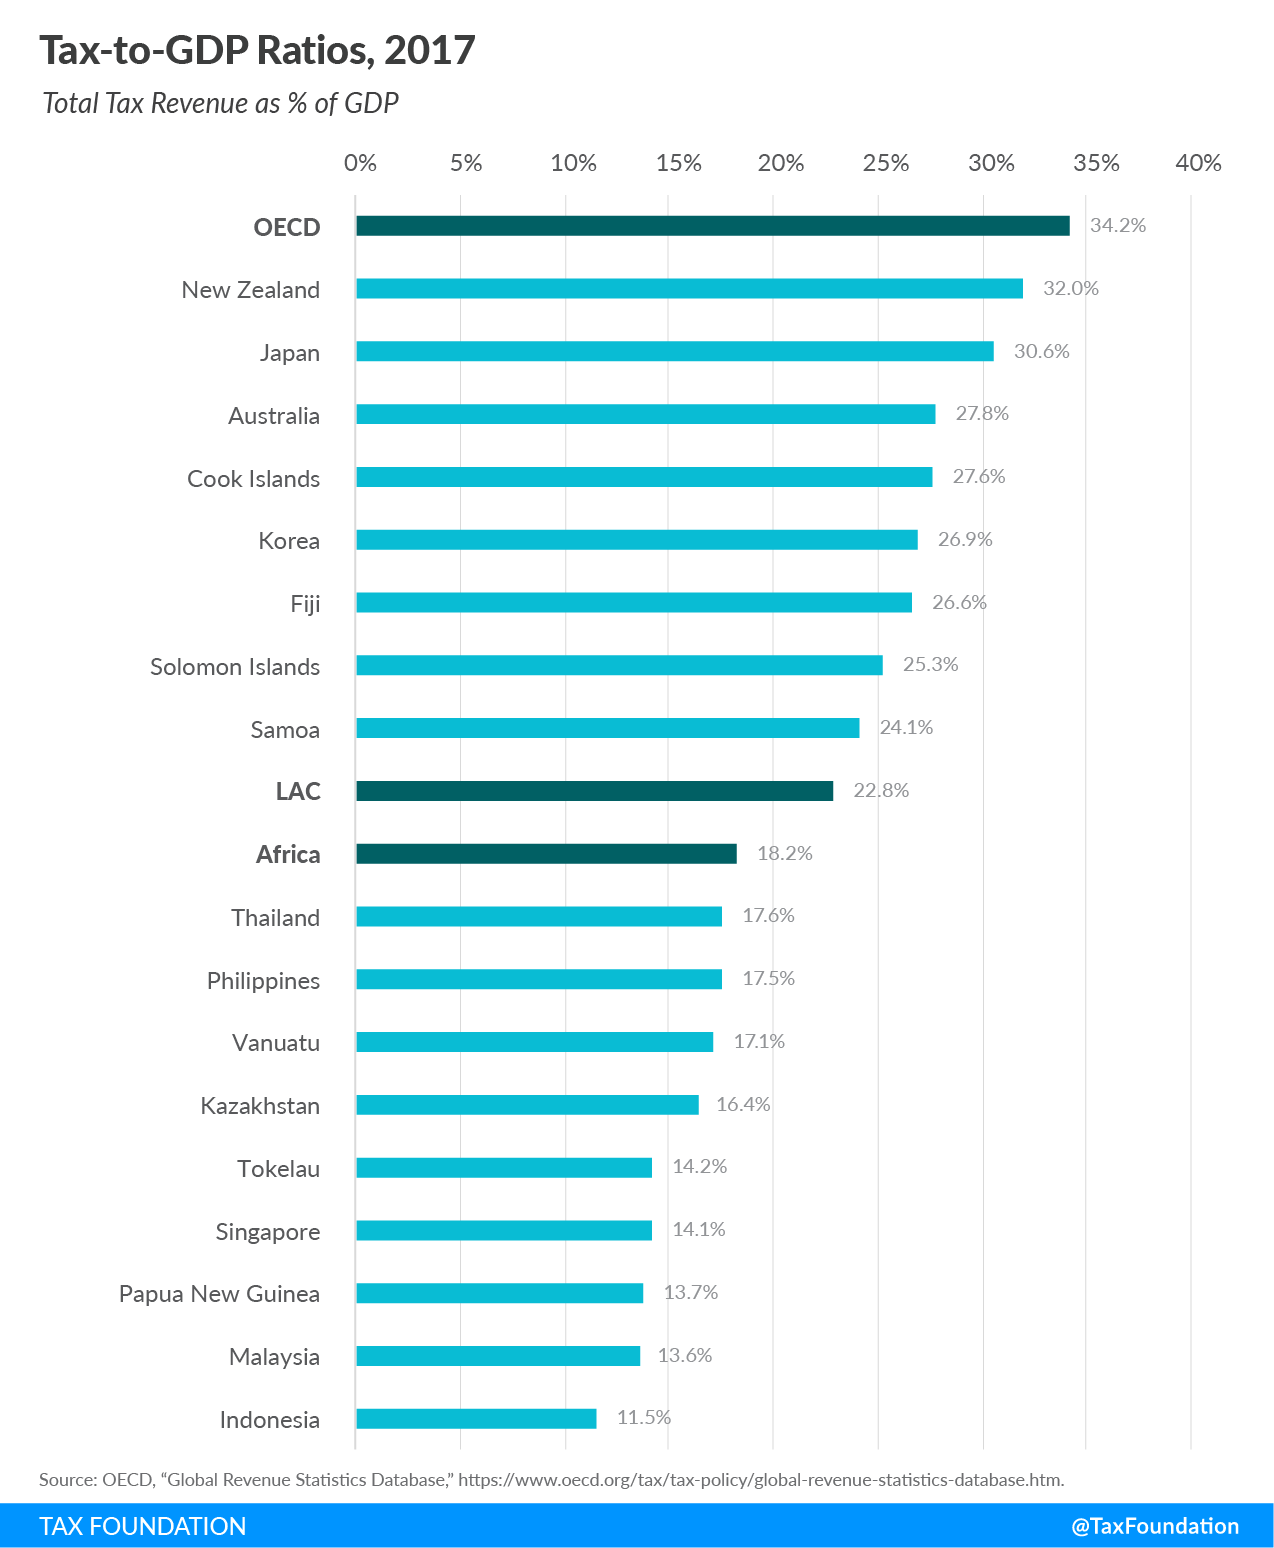
Between 2016 and 2017, Vanuatu and Fiji saw the largest increases in their tax-to-GDP ratios, at 1.9 percentage-points and 1.7 percentage-points, respectively. Papua New Guinea and Malaysia experienced the most significant decreases, both at 0.7 percentage-points.
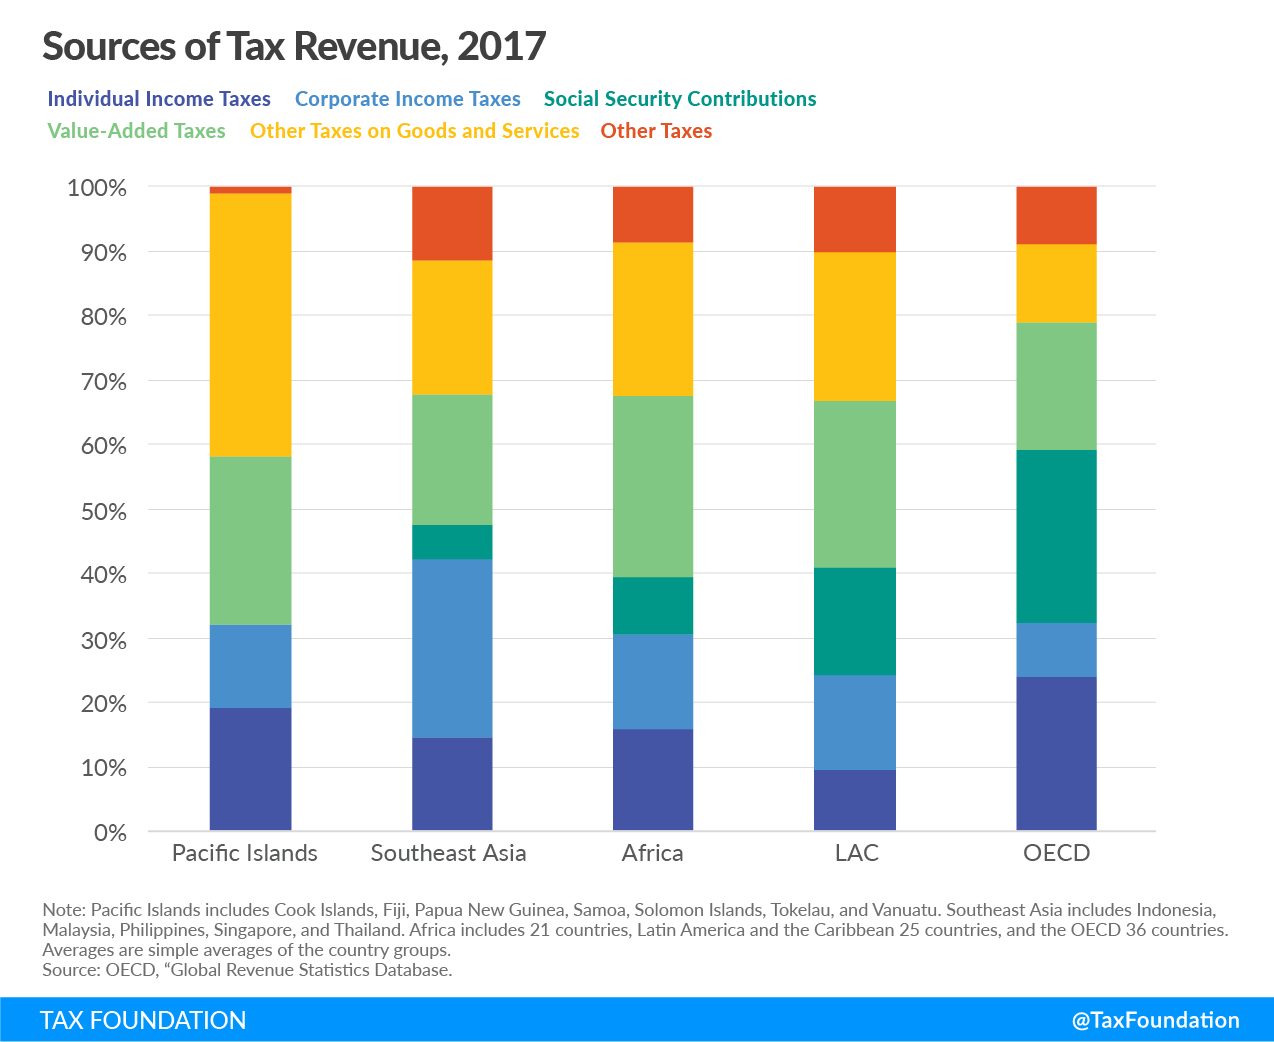
Taxes on goods and services (including value-added taxes and other taxes on goods and services) make up a significant share of total tax revenue in most countries covered. Almost 70 percent of the Pacific Islands’ tax revenue comes from taxes on goods and services, compared to between 30 and 50 percent in Southeast Asia, Africa, Latin America and the Caribbean, and the OECD.
While OECD countries on average raise a large share of their tax revenue from income taxes and social security contributions, these two types of taxes play a less significant role in the Pacific Islands, Southeast Asia, Africa, and Latin America and the Caribbean.
Corporate income taxes raise almost 30 percent of total tax revenue in Southeast Asia, compared to less than 10 percent in the OECD and between 10 and 15 percent in the Pacific Islands, Africa, and Latin America and the Caribbean.
|
Note: Australia’s, Japan’s, and Africa’s tax revenue figures are from 2016 (2017 data is not available yet). Africa includes 21 countries, Latin America and the Caribbean 25 countries, and the OECD 36 countries. Averages are simple averages of the country groups. Source: OECD, “Global Revenue Statistics Database.” |
|||||||
| Individual Income Taxes | Corporate Income Taxes | Social Security Contributions | Value-Added Taxes | Other Taxes on Goods and Services | Other Taxes | Total Tax-to-GDP Ratio | |
|---|---|---|---|---|---|---|---|
| Pacific Islands | |||||||
| Cook Islands | 5.8% | 4.3% | 0.0% | 12.3% | 5.2% | 0.0% | 27.6% |
| Fiji | 2.3% | 6.1% | 0.0% | 7.4% | 10.0% | 0.8% | 26.6% |
| Papua New Guinea | 4.7% | 3.6% | 0.0% | 2.4% | 2.9% | 0.1% | 13.7% |
| Samoa | 3.1% | 2.2% | 0.0% | 9.6% | 9.1% | 0.0% | 24.1% |
| Solomon Islands | 4.7% | 2.8% | 0.0% | 0.0% | 17.6% | 0.1% | 25.3% |
| Tokelau | 7.9% | 0.0% | 0.0% | 0.0% | 6.3% | 0.0% | 14.2% |
| Vanuatu | 0.0% | 0.0% | 0.0% | 7.3% | 9.3% | 0.5% | 17.1% |
| Southeast Asia | |||||||
| Indonesia | 2.2% | 2.6% | 0.4% | 3.5% | 1.4% | 1.4% | 11.5% |
| Malaysia | 2.1% | 5.6% | 0.3% | 3.3% | 1.5% | 1.2% | 13.9% |
| Philippines | 2.5% | 4.3% | 2.4% | 2.3% | 4.8% | 1.5% | 17.7% |
| Singapore | 2.3% | 4.2% | 0.0% | 2.3% | 1.7% | 3.9% | 14.5% |
| Thailand | 1.8% | 4.1% | 1.0% | 3.8% | 6.2% | 0.6% | 17.6% |
| Other Countries Covered | |||||||
| Australia | 11.3% | 4.6% | 0.0% | 3.6% | 3.9% | 4.4% | 27.8% |
| Japan | 5.7% | 3.7% | 12.4% | 4.1% | 2.2% | 2.6% | 30.6% |
| Kazakhstan | 1.4% | 4.5% | 0.5% | 3.1% | 5.2% | 1.6% | 16.4% |
| Korea | 4.8% | 3.8% | 6.9% | 4.3% | 3.2% | 3.9% | 26.9% |
| New Zealand | 12.1% | 4.7% | 0.0% | 9.7% | 2.6% | 3.9% | 33.0% |
| Average of All Countries Covered | 4.4% | 3.6% | 1.4% | 4.6% | 5.5% | 1.6% | 21.1% |
| Africa Average | 3.0% | 2.8% | 1.7% | 5.3% | 4.5% | 1.6% | 18.9% |
| LAC Average | 2.2% | 3.4% | 3.9% | 6.0% | 5.4% | 2.4% | 23.2% |
| OECD Average | 8.2% | 2.9% | 9.2% | 6.8% | 4.2% | 3.0% | 34.3% |