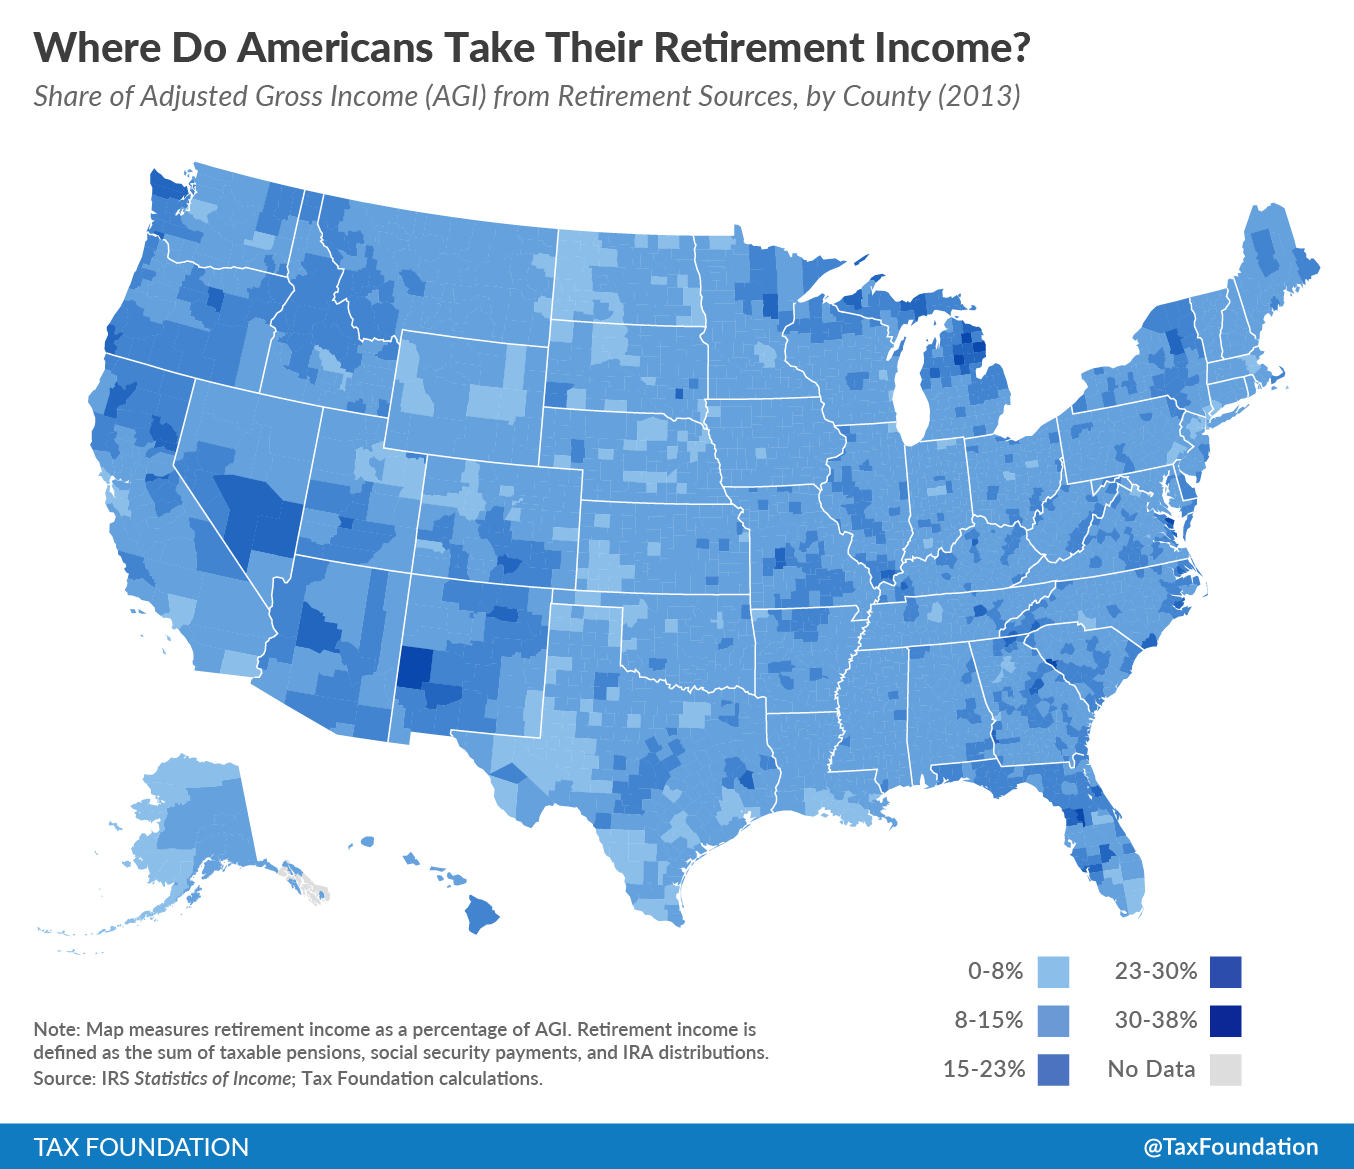
Americans of different ages tend to live in different places. This makes a great deal of sense; peoples’ needs when they are working are different from their needs in retirement. This map uses taxA tax is a mandatory payment or charge collected by local, state, and national governments from individuals or businesses to cover the costs of general government services, goods, and activities. data to help show where Americans with retirement income tend to live. It does this by measuring percentage of adjusted gross incomeFor individuals, gross income is the total pre-tax earnings from wages, tips, investments, interest, and other forms of income and is also referred to as “gross pay.” For businesses, gross income is total revenue minus cost of goods sold and is also known as “gross profit” or “gross margin.” that comes from retirement sources in each county. Retirement income, for purposes of this map, is defined as taxable pensions, social security, and IRA distributions. This is an important source of income that broadly benefits the middle class.
To examine where American retirees live, county data seems more illuminating than state-level data; the characteristics of Miami-Dade County, for example, are substantially different from the characteristics of other counties farther up the Florida coast. Therefore, this map uses county-level data in order to show where America’s seniors live.
Some noticeable patterns emerge in the county-level data. Florida’s reputation as a destination for retirees is entirely grounded in the facts. Sumter County, an inland area west of Orlando, reports more of its income from retirement sources than any other county in the country, and it’s not particularly close. This is unsurprising, as the census has often measured it as having the oldest average population. In Sumter County, 38% of all income comes from retirement sources. Several other Florida counties, such as Charlotte County (27%) and Citrus County (27%) also have large retiree populations.
More generally, America’s retirees tend to live in rural or suburban areas with pleasant climates.
In contrast, a look at the areas with the least retirement income is also revealing. Areas defined around a resource extraction economy, like Williams County ND (3%), Midland County TX (4%) and Stark County ND (4%) have very few retirees. The people living in those counties tend to do so because they are of working age, and employed in the industry the area provides.
Additionally, the centers of large cities, such as New York County (3%) and San Francisco (4%) tend to have relatively few retirees compared with working age people. Retirees tend to have fixed incomes, and are therefore sensitive to cost of living. Their retirement income simply goes further in suburbs and rural areas.
The distribution of retirement income is perhaps only incidental to policy debates, but the data reveal important characteristics of life in America.
Share this article