The Organisation for Economic Co-operation and Development (OECD) recently published a report on taxA tax is a mandatory payment or charge collected by local, state, and national governments from individuals or businesses to cover the costs of general government services, goods, and activities. revenue statistics in selected Asian and Pacific countries, covering 21 tax jurisdictions. The report provides tax revenue data from 1990 to 2018 and includes a section on nontax revenue data for selected Asian and Pacific economies. Additionally, a special feature co-authored by the Asian Development Bank (ADB) and the OECD explores the role of tax policy and administration during the COVID-19 crisis.
In spite of the good evolution of the tax-to-GDP ratios in the Asia-Pacific region in 2018, tax revenues are likely to decrease significantly as a result of the COVID-19 pandemic and the associated economic crisis.
Tax-to-GDP Ratios
Tax revenue as a percent of GDP (tax-to-GDP ratio) varies significantly across the countries covered, with the highest ratio in Nauru (35.4 percent) and the lowest ratio in Indonesia (11.9 percent). While all countries covered, with the exception of Nauru, have a lower tax-to-GDP ratio than the OECD average (34.3 percent), 10 of the countries’ ratios are higher than the Latin America and the Caribbean average (23.1 percent). Additionally, 14 countries have higher tax-to-GDP ratios than the African average (17.2 percent).
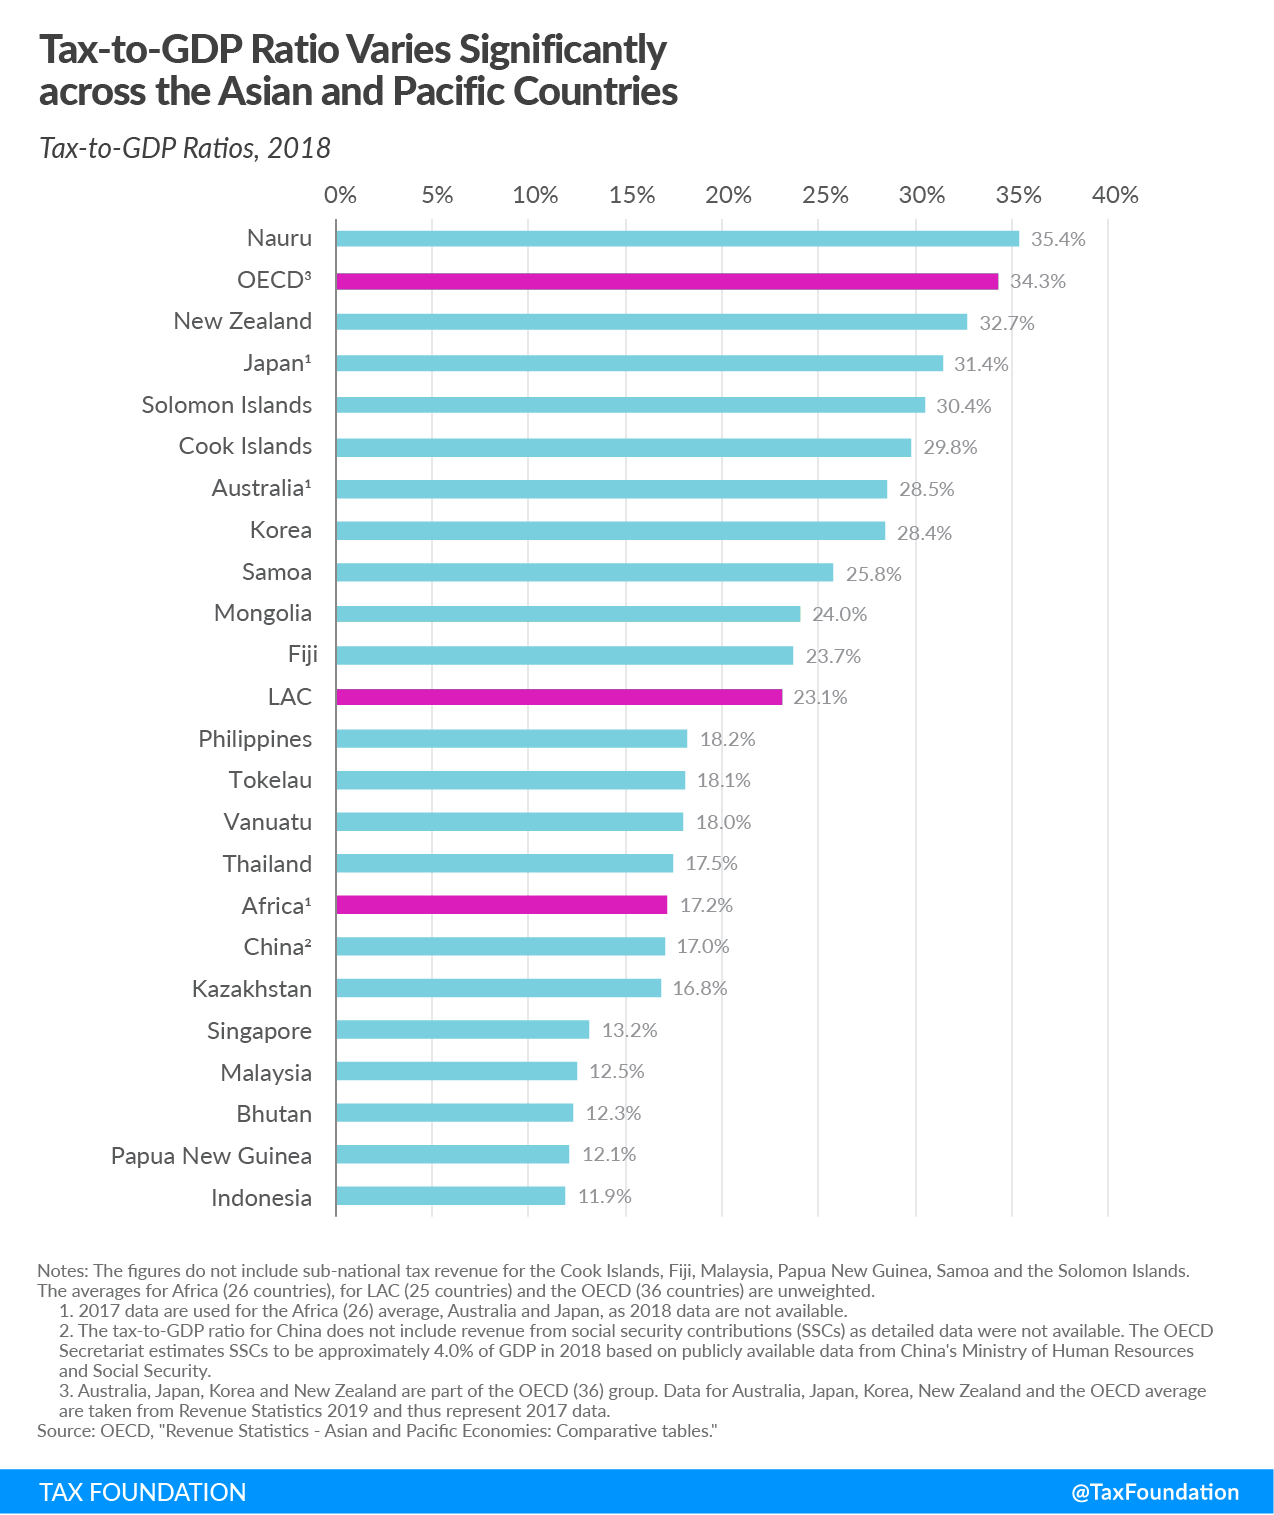
Between 2017 and 2018, 14 of the 21 countries experienced increases in their tax-to-GDP ratios. Nauru, Tokelau, and Mongolia saw the largest increases in their ratios, at 6.4 percentage-points, 3.8 percentage-points, and 2.5 percentage-points, respectively. Only five countries had lower ratios in 2018 relative to 2017, and most of the reductions were less than 1 percentage-point. Bhutan experienced the most significant decrease, 1.4 percentage-points.
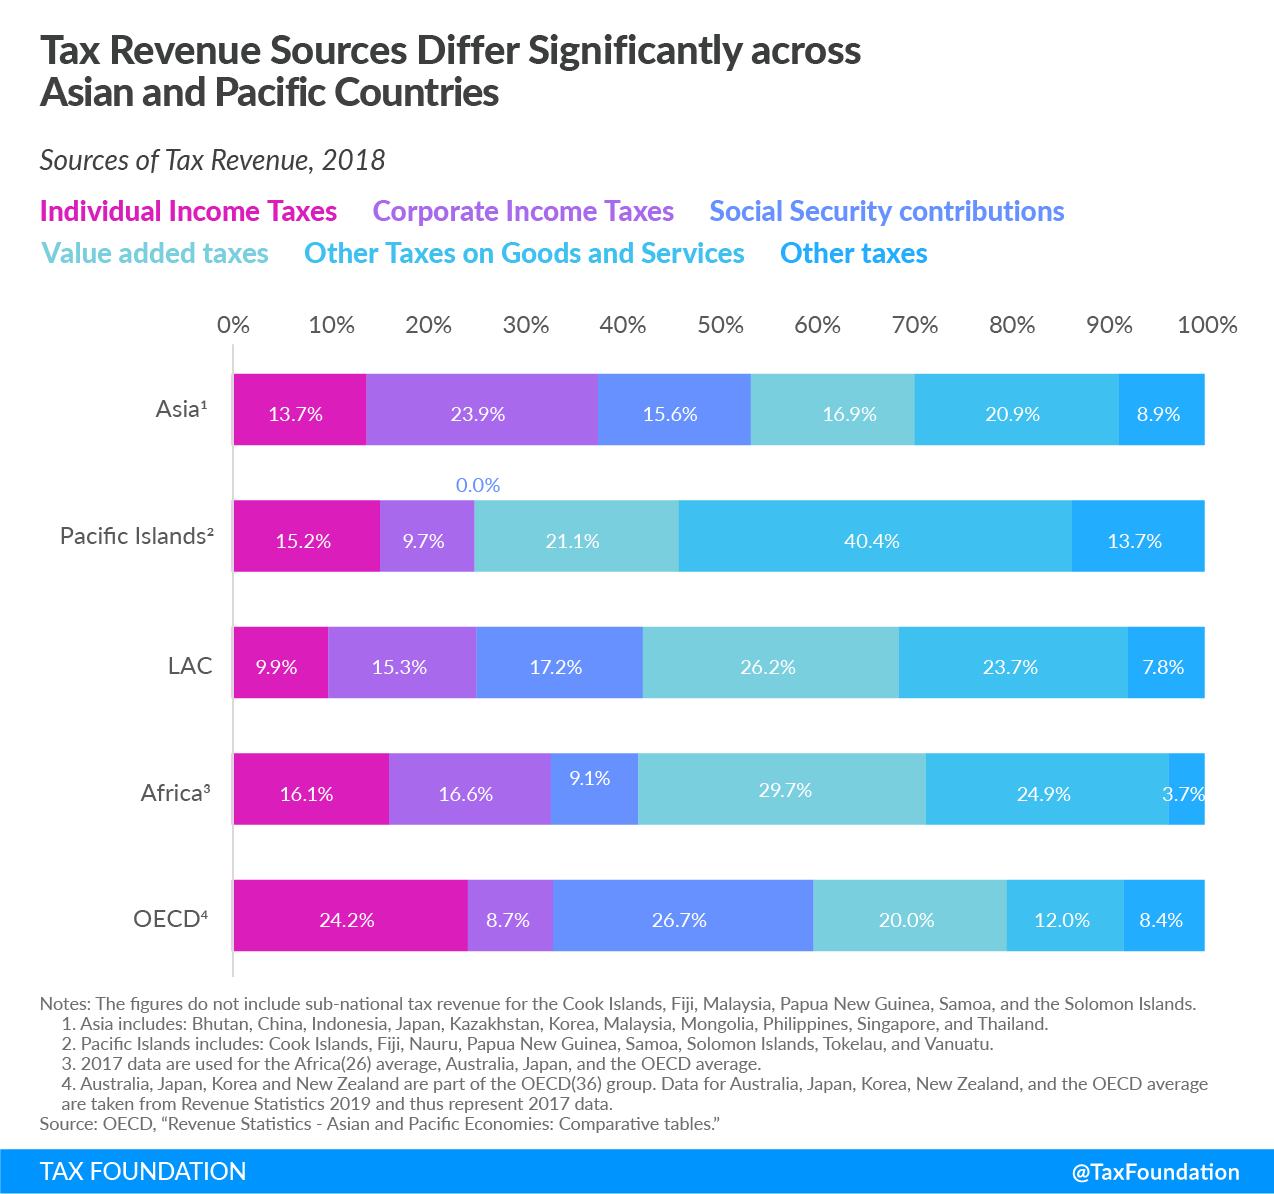
Sources of Tax Revenue
Taxes on goods and services (including value-added taxes and other taxes on goods and services) make up a significant share of total tax revenue in most countries covered. Almost 62 percent of the Pacific Islands’ tax revenue comes from taxes on goods and services, compared to between 32 and 55 percent in the OECD, Asia, Latin America and the Caribbean, and Africa.
While OECD countries on average raise a large share of their tax revenue from income taxes and social security contributions, these two types of taxes play a less significant role in the Pacific Islands, Africa, Asia, and Latin America and the Caribbean.
Corporate income taxA corporate income tax (CIT) is levied by federal and state governments on business profits. Many companies are not subject to the CIT because they are taxed as pass-through businesses, with income reportable under the individual income tax. es raise almost 24 percent of total tax revenue in Asia, compared to less than 10 percent in the OECD and between 10 and 17 percent in the Pacific Islands, Latin America and the Caribbean, and Africa.
Uncertainty Ahead
Because of the COVID-19 pandemic and the associated economic crisis, countries in the Asia-Pacific region will see a differentiated impact on their capacity of mobilizing domestic revenue depending on the structure of their economy. According to the OECD report, those economies that rely mostly on natural resources, tourism, and trade taxes are especially vulnerable.
Regarding potential policy measures for the post-pandemic economic recovery, the report signals environmentally-related taxes as a possible source of raising more revenue in the near future.
Environmental taxes play a limited role across Asian and Pacific economies, although not in all. In 2018, revenue from environmental taxation ranged from 0.05 percent of GDP in Papua New Guinea to 8 percent of GDP in the Solomon Islands, while the OECD average is around 2.3 percent of GDP.
| Individual Income Taxes | Corporate Income Taxes | Social Security contributions | Value-added taxes | Other Taxes on Goods and Services | Other taxes | Total Tax-to-GDP Ratio | |
|---|---|---|---|---|---|---|---|
| Bhutan | 0.9% | 5.5% | 0.0% | 0.0% | 5.9% | 0.1% | 12.3% |
| China | 1.5% | 4.5% | 0.0% | 7.3% | 2.3% | 1.4% | 17.0% |
| Indonesia | 1.1% | 4.0% | 0.4% | 3.5% | 1.5% | 1.4% | 11.9% |
| Japan | 5.9% | 3.7% | 12.5% | 4.1% | 2.5% | 2.6% | 31.4% |
| Kazakhstan | 1.4% | 5.1% | 0.4% | 3.3% | 5.2% | 1.5% | 16.8% |
| Korea | 5.2% | 4.5% | 7.2% | 4.3% | 3.1% | 4.0% | 28.4% |
| Malaysia | 2.3% | 6.0% | 0.3% | 1.4% | 1.8% | 0.8% | 12.5% |
| Mongolia | 2.5% | 3.9% | 4.8% | 6.8% | 5.4% | 0.5% | 24.0% |
| Philippines | 2.2% | 4.0% | 2.5% | 2.1% | 5.8% | 1.6% | 18.2% |
| Singapore | 2.3% | 3.5% | 0.0% | 2.2% | 1.7% | 3.5% | 13.2% |
| Thailand | 1.7% | 4.2% | 1.0% | 3.9% | 6.0% | 0.6% | 17.5% |
| Asia1 | 2.5% | 4.4% | 2.9% | 3.2% | 3.9% | 1.7% | 18.6% |
| Cook Islands | 7.0% | 4.5% | 0.0% | 13.3% | 5.0% | 0.0% | 29.8% |
| Fiji | 1.9% | 4.7% | 0.0% | 6.8% | 9.4% | 0.8% | 23.7% |
| Nauru | 0.0% | 0.0% | 0.0% | 0.0% | 10.5% | 24.8% | 35.4% |
| Papua New Guinea | 3.8% | 3.7% | 0.0% | 2.0% | 2.6% | 0.1% | 12.1% |
| Samoa | 3.1% | 2.9% | 0.0% | 10.3% | 9.5% | 0.0% | 25.8% |
| Solomon Islands | 5.1% | 2.9% | 0.0% | 0.0% | 22.3% | 0.2% | 30.4% |
| Tokelau | 8.6% | 0.0% | 0.0% | 0.0% | 9.5% | 0.0% | 18.1% |
| Vanuatu | 0.0% | 0.0% | 0.0% | 8.3% | 9.2% | 0.6% | 18.0% |
| Pacific Islands | 3.7% | 2.3% | 0.0% | 5.1% | 9.8% | 3.3% | 24.2% |
| New Zealand | 12.1% | 5.1% | 0.0% | 9.8% | 2.7% | 3.0% | 32.7% |
| Australia | 11.5% | 5.3% | 0.0% | 3.5% | 4.0% | 4.3% | 28.5% |
| Average of all countries covered | 3.7% | 3.5% | 1.4% | 4.1% | 5.9% | 2.4% | 21.0% |
| LAC | 2.3% | 3.5% | 4.0% | 6.0% | 5.5% | 1.8% | 23.1% |
| Africa2 | 2.8% | 2.9% | 1.6% | 5.1% | 4.3% | 0.6% | 17.2% |
| OECD3 | 8.3% | 3.0% | 9.1% | 6.8% | 4.1% | 2.9% | 34.3% |
| Notes: The figures do not include sub-national tax revenue for the Cook Islands, Fiji, Malaysia, Papua New Guinea, Samoa, and the Solomon Islands.
1. Asia average includes: Bhutan, China, Indonesia, Japan, Kazakhstan, Korea, Malaysia, Mongolia, Philippines, Singapore, and Thailand. China is not included as its data does not include revenue from social security contributions. 2. 2017 data are used for the Africa (26) average, Australia, Japan, and the OECD average. 3. Australia, Japan, Korea, and New Zealand are part of the OECD (36) group. Data for Australia, Japan, Korea, New Zealand, and the OECD average are taken from Revenue Statistics 2019 and thus represent 2017 data. Source: OECD, “Revenue Statistics – Asian and Pacific Economies: Comparative tables.” |
|||||||
Stay informed on the tax policies impacting you.
Subscribe to get insights from our trusted experts delivered straight to your inbox.
Subscribe