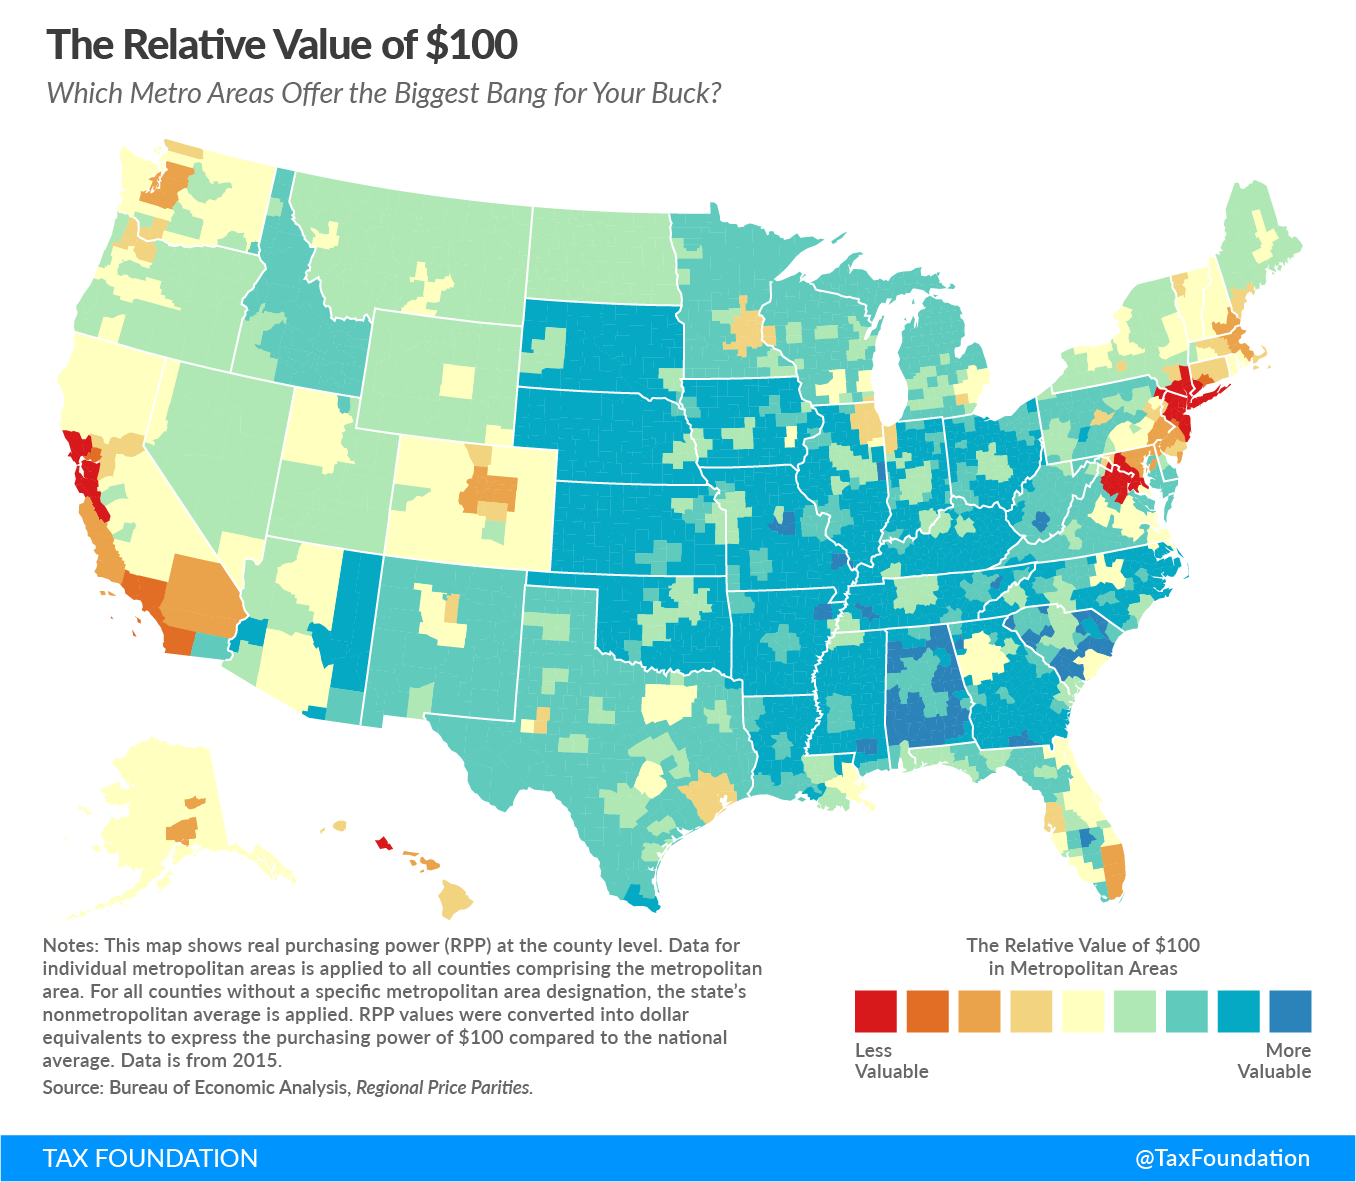
Two weeks ago, we published a map showing how far $100 in purchasing power would go in different states.
This week’s map further explores purchasing power differences at the metropolitan level. Using data from the Bureau of Economic Analysis, we can examine how purchasing power varies between cities, like Los Angeles and San Francisco, and between urban and rural areas, like Houston and West Texas. To illustrate these differences, we compare the local purchasing power of $100 to the purchasing power of $100 in an average U.S. metropolitan area.[1]
There are large regional differences in price level. In general, the places where $100 buys the least are concentrated around large cities in the Northeast and California. Conversely, $100 stretches the most in the nonmetropolitan areas of the Midwest and the Southeast.
The twenty most expensive metropolitan in the United States, where the real value of $100 is the lowest, are presented in the following table.
| Metropolitan Area | Real Value of $100 |
|---|---|
| Honolulu, HI | $80.32 |
| San Jose-Sunnyvale-Santa Clara, CA | $80.58 |
| Santa Cruz-Watsonville, CA | $81.97 |
| New York-Newark-Jersey City, NY-NJ-PA | $82.03 |
| San Francisco-Oakland-Hayward, CA | $82.03 |
| Bridgeport-Stamford-Norwalk, CT | $83.26 |
| Napa, CA | $83.26 |
| Washington-Arlington-Alexandria, DC-VA-MD-WV | $83.96 |
| Santa Rosa, CA | $84.39 |
| Los Angeles-Long Beach-Anaheim, CA | $85.03 |
| San Diego-Carlsbad, CA | $85.76 |
| Oxnard-Thousand Oaks-Ventura, CA | $86.13 |
| Vallejo-Fairfield, CA | $86.28 |
| New Haven-Milford, CT | $89.21 |
| Trenton, NJ | $89.29 |
| Boston-Cambridge-Newton, MA-NH | $90.66 |
| Boulder, CO | $90.82 |
| Anchorage, AK | $91.41 |
| Santa Maria-Santa Barbara, CA | $91.41 |
| Seattle-Tacoma-Bellevue, WA | $91.41 |
Metropolitan areas are characterized by a relatively high population density. In these areas, many residents seek to occupy a limited amount of available land, driving property prices up. This is a principal reason why metropolitan areas, particularly cities, are almost universally more expensive than rural areas.
However, some large cities do have relatively high purchasing power. Cincinnati ($112.11), St. Louis ($110.38), and Charlotte ($106.95) are home to major companies, including Procter & Gamble (Ohio), Anheuser-Busch (Missouri), and Bank of America (North Carolina), and have metropolitan populations exceeding 1 million residents.
Moreover, some metropolitan areas may be less expensive than the nonmetropolitan portions of their state, though they tend to be smaller and more rural than most cities. Notably, Beckley ($125.47), with a population of roughly 17,000, stretches $100 much further than nonmetropolitan West Virginia ($114.68). In fact, of the top ten areas with the greatest purchasing power, eight are metropolitan areas. The nonmetropolitan portions of Alabama and South Carolina rank as ninth and tenth, respectively.
| Metropolitan Area | Real Value of $100 |
|---|---|
| Beckley, WV | $125.47 |
| Rome, GA | $124.69 |
| Valdosta, GA | $123.30 |
| Danville, IL | $123.15 |
| Morristown, TN | $123.00 |
| Jonesboro, AR | $122.10 |
| Sebring, FL | $122.10 |
| Jackson, TN | $121.80 |
| Non-metropolitan Alabama | $121.80 |
| Non-metropolitan South Carolina | $121.65 |
We are interested in this issue because it has important implications for economic policy; some areas are effectively richer or poorer than their nominal incomes suggest. Many policies are based on income, like progressive taxes and means-tested federal benefits. If real incomes vary from place to place due to purchasing power, this matters for those policies.
Stay informed on the tax policies impacting you.
Subscribe to get insights from our trusted experts delivered straight to your inbox.
Subscribe[1] Some “average” U.S. metropolitan areas are Dallas, Salt Lake City, Utah, and Naples, Florida. In each of these locations the real value of $100 is precisely $100.
Share this article