Facts & Figures 2024: How Does Your State Compare?
Facts & Figures serves as a one-stop state tax data resource that compares all 50 states on over 40 measures of tax rates, collections, burdens, and more.
2 min readHow does Pennsylvania’s tax code compare? Pennsylvania has a flat 3.07 percent individual income tax rate. There are also jurisdictions that collect local income taxes. Pennsylvania has an 8.49 percent corporate income tax rate. Pennsylvania has a 6.00 percent state sales tax rate and an average combined state and local sales tax rate of 6.34 percent. Pennsylvania also has a 1.26 percent effective property tax rate on owner-occupied housing value.
Pennsylvania has an inheritance tax. Pennsylvania has a 58.7 cents per gallon gas tax rate and a $2.60 cigarette excise tax rate. The State of Pennsylvania collects $6,264 in state and local tax collections per capita. Pennsylvania has $9,894 in state and local debt per capita and has a 68 percent funded ratio of public pension plans. Overall, Pennsylvania’s tax system ranks 31st on our 2024 State Business Tax Climate Index.
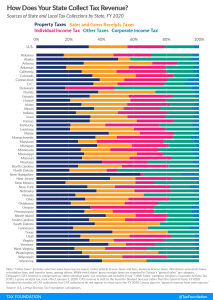
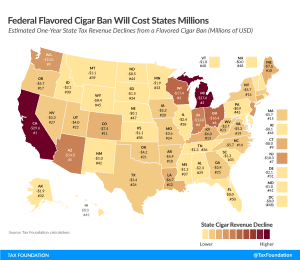
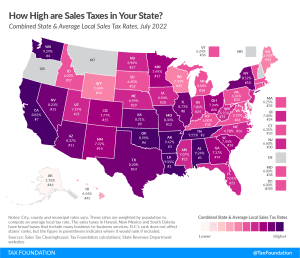
Each state’s tax code is a multifaceted system with many moving parts, and Pennsylvania is no exception. The first step towards understanding Pennsylvania’s tax code is knowing the basics. How does Pennsylvania collect tax revenue? Click the tabs below to learn more! You can also explore our state tax maps, which are compiled from our annual publication, Facts & Figures 2024: How Does Your State Compare?
Subscribe to get insights from our trusted experts delivered straight to your inbox.
SubscribeFacts & Figures serves as a one-stop state tax data resource that compares all 50 states on over 40 measures of tax rates, collections, burdens, and more.
2 min readIn recognition of the fact that there are better and worse ways to raise revenue, our Index focuses on how state tax revenue is raised, not how much. The rankings, therefore, reflect how well states structure their tax systems.
111 min readTax burdens rose across the country as pandemic-era economic changes caused taxable income, activities, and property values to rise faster than net national product. Tax burdens in 2020, 2021, and 2022 are all higher than in any other year since 1978.
24 min readIndividual income taxes are a major source of state government revenue, accounting for more than a third of state tax collections. How do income taxes compare in your state?
8 min readGraduated corporate rates are inequitable—that is, the size of a corporation bears no necessary relation to the income levels of the owners.
7 min readRetail sales taxes are an essential part of most states’ revenue toolkits, responsible for 32 percent of state tax collections and 13 percent of local tax collections (24 percent of combined collections).
9 min readGross receipts taxes impose costs on consumers, workers, and shareholders alike. Shifting from these economically damaging taxes can thus be a part of states’ plans for improving their tax codes in an increasingly competitive tax landscape.
4 min readIndividual income taxes are a major source of state government revenue, accounting for more than a third of state tax collections:
9 min readWhile many factors influence business location and investment decisions, sales taxes are something within policymakers’ control that can have immediate impacts.
11 min readAt the end of 2022, prices were 14.6 percent higher than they were two years prior. That’s the fastest inflation rate over any two calendar years since the stagflation era of the late 1970s. State policymakers are understandably interested in bringing any tools at their disposal to bear on the problem. And many of them are reaching for tax policy solutions.
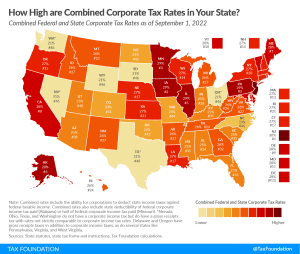
7 min readNew Jersey levies the highest top statutory corporate tax rate at 11.5 percent, followed by Minnesota (9.8 percent) and Illinois (9.50 percent). Alaska and Pennsylvania levy top statutory corporate tax rates of 9.40 percent and 8.99 percent, respectively.
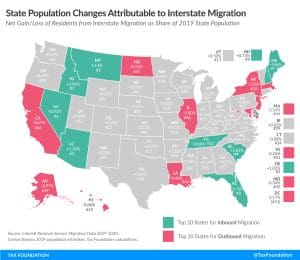
6 min readThe pandemic has accelerated changes to the way we live and work, making it far easier for people to move—and they have. As states work to maintain their competitive advantage, they should pay attention to where people are moving, and try to understand why.
5 min readMost of the 2023 state tax changes represent net tax reductions, the result of an unprecedented wave of rate reductions and other tax cuts in the past two years as states respond to burgeoning revenues, greater tax competition in an era of enhanced mobility, and the impact of high inflation on residents.
20 min readWhile the wireless market has become increasingly competitive in recent years, resulting in steady declines in the average price for wireless services, the price reduction for consumers has been partially offset by higher taxes.
41 min readThe logic that has prevailed for local sales taxes should apply equally to other taxes that localities impose on multijurisdictional businesses, including local tourism taxes. The evidence is clear that central administration of local taxes reduces compliance costs without sacrificing local revenue.
15 min readPeople respond to incentives. As tax rates increase or products are banned from sale, consumers and producers search for ways around these penalties and restrictions.
19 min read