Facts & Figures 2026: How Does Your State Compare?
Facts & Figures serves as a one-stop state tax data resource that compares all 50 states on over 40 measures of tax rates, collections, burdens, and more.
2 min read
Providing journalists, taxpayers, and policymakers with the latest data on taxes and spending is a cornerstone of the Tax Foundation’s educational mission.
As a nonpartisan, educational organization, the Tax Foundation has earned a reputation for independence and credibility. Our state tax policy team regularly provides accessible, data-driven insights on state tax rates, collections, burdens and more, from sources such as the U.S. Census Bureau, Internal Revenue Service (IRS), and others.

Get facts about taxes in your state and around the US

Facts & Figures serves as a one-stop state tax data resource that compares all 50 states on over 40 measures of tax rates, collections, burdens, and more.
2 min read
Individual income taxes are a major source of state government revenue, accounting for more than a third of state tax collections. How do income taxes compare in your state?
9 min read
Retail sales taxes are an essential part of most states’ revenue toolkits, responsible for nearly a quarter of combined state and local tax collections.
18 min read
Forty-four states levy a corporate income tax, with top rates ranging from a 2 percent flat rate in North Carolina to an 11.5 percent top marginal rate in New Jersey. Four states—Georgia, Nebraska, North Carolina, and Pennsylvania—reduced their corporate income tax rates effective January 1, 2026.
5 min read
Property taxes are the primary tool for financing local governments. While no taxpayers in high-tax jurisdictions will be celebrating their yearly payments, property taxes are largely rooted in the benefit principle of taxation: the people paying the property tax bills are most often the ones benefiting from the services.
9 min read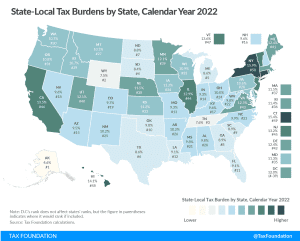
Tax burdens rose across the country as pandemic-era economic changes caused taxable income, activities, and property values to rise faster than net national product. Tax burdens in 2020, 2021, and 2022 are all higher than in any other year since 1978.
24 min read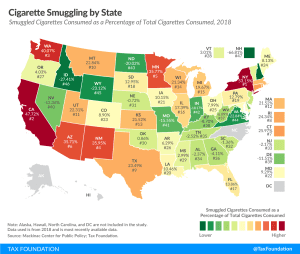
Excessive tax rates on cigarettes in some states induce substantial black and gray market movement of tobacco products into high-tax states from low-tax states or foreign sources. New York has the highest inbound smuggling activity, with an estimated 53.2 percent of cigarettes consumed in the state deriving from smuggled sources.
13 min read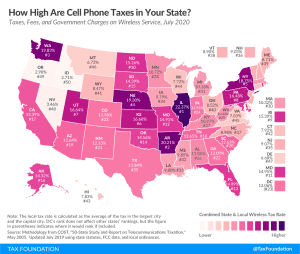
A typical American household with four phones on a “family share” wireless plan can expect to pay about $270 per year (or 22 percent of their cell phone bill) in taxes, fees, and surcharges.
36 min read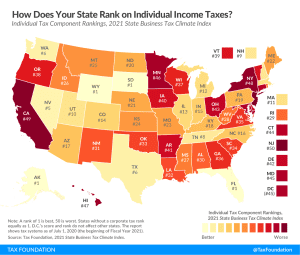
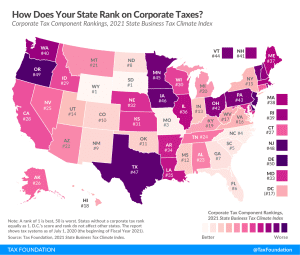
The corporate tax component of our Index measures each state’s principal tax on business activities. Most states levy a corporate income tax on a company’s profits (receipts minus most business expenses, including compensation and the cost of goods sold), while some states levy gross receipts taxes, which allow few or no deductions for a company’s expenses.
2 min read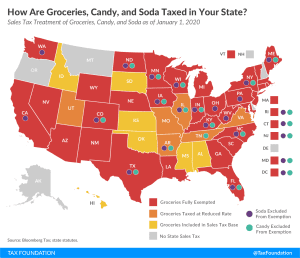
Even in 2020, jack-o’-lanterns and fake skeletons have popped up in neighborhoods as they do every October, although Halloween may look and play out differently this time around.
4 min read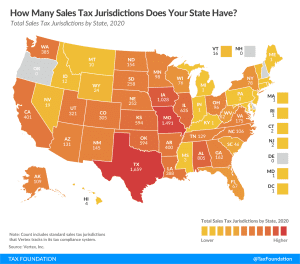
Following the Wayfair decision, states’ move to tax online sales has increased the importance of simplicity in sales tax systems, as sellers now have to deal with differing regulations in multiple states. There are over 11,000 standard sales tax jurisdictions in the United States in 2020
2 min read