Underlying every fiscal policy discussion in Washington is the question of progressivity: how much should tax and spending policy redistribute from high-income households to low-income households?
This debate is often more rhetorical than substantive, but a recent study by the Congressional Budget Office (CBO) fills this void by presenting data showing that the current fiscal system—both taxes and direct federal benefits—is very progressive and very redistributive.
The CBO study estimates the impact of federal fiscal policy on household incomes in 2019 (the most recent data). It does this by contrasting how much households benefited from social insurance programs (e.g., Social Security and Medicare) and means-tested transfer programs (e.g., Medicaid, SNAP, and Supplemental Security Income) with how much they paid in total federal taxes—including individual income taxes, payroll taxes, corporate income taxes, estate taxes, and various excise taxes.
These policies lift the incomes of many households (who receive more in federal benefits than they pay in total federal taxes) while reducing the income of others (who pay more in federal taxes than they receive in direct federal benefits). CBO’s data allows us to measure the impact of these policies on the average household within various income groups and then aggregate the results to measure how these policies redistribute income between groups of households.
To be sure, households do benefit from other federal programs such as national defense, highway spending, and public education, but CBO does not include the benefits of such programs in this exercise. The study is solely focused on fiscal policy that directly impacts household incomes.
Direct Federal Benefits Lift Average Incomes in First Three Quintiles
Table 1 illustrates how federal benefit programs and taxes can either raise market incomes or reduce them. For example, in 2019, households in the lowest quintile paid almost no federal income taxes but received nearly $22,000 in transfer benefits. As a result, these policies more than doubled their household incomes, an increase of 126 percent.
The story is very similar for households in the second and middle quintiles, although not as extreme. After netting their federal taxes paid, direct federal benefit policies raised the incomes of households in the second quintile by 39 percent and the incomes of households in the middle quintile by 11 percent.
| 2019 | Number of Households (millions) | Average Market Income Per Household | Total Benefits Received: Social Insurance and Means-Tested | Total Federal Taxes Per Household | Average Income After Transfers and Taxes |
Net Income Gain (+) or Loss (-) Per Household | Percentage Change in Household Income |
|---|---|---|---|---|---|---|---|
| Lowest Quintile | 26.1 | $17,200 | $21,800 | $100 | $38,900 | $21,700 | 126% |
| Second Quintile | 25.5 | $39,600 | $20,000 | $4,600 | $54,900 | $15,300 | 39% |
| Middle Quintile | 25.6 | $67,500 | $18,000 | $10,600 | $74,800 | $7,300 | 11% |
| Fourth Quintile | 25.4 | $108,700 | $16,300 | $20,600 | $104,400 | -$4,300 | -4% |
| Highest Quintile | 25.3 | $318,900 | $14,200 | $81,100 | $252,100 | -$66,800 | -21% |
| 81st to 90th Decile | 12.7 | $166,600 | $14,700 | $36,000 | $145,300 | -$21,300 | -13% |
| 91st to 95th Decile | 6.4 | $236,700 | $13,700 | $55,000 | $195,300 | -$41,400 | -17% |
| 96th to 99th Decile | 5.0 | $403,600 | $13,800 | $101,800 | $315,500 | -$88,100 | -22% |
| Top 1% | 1.2 | $1,983,700 | $15,100 | $600,300 | $1,398,500 | -$585,200 | -30% |
Federal Taxes Reduce Average Incomes in the Top Two Quintiles
The story changes completely for average households in the top two quintiles. On average, they paid more in taxes in 2019 than they received in direct federal benefits. Households in the fourth quintile, for example, saw their incomes fall by 4 percent, while households in the highest quintile saw their incomes fall by 21 percent.
At the very top of the income scale, the story is even more dramatic. Households in the top 1 percent paid an average of roughly $600,000 in federal taxes and received about $15,000 in federal benefits. As a result, federal taxA tax is a mandatory payment or charge collected by local, state, and national governments from individuals or businesses to cover the costs of general government services, goods, and activities. and spending policies reduced the incomes of households in the top 1 percent by nearly one-third (30 percent).
It is interesting to note that federal benefit programs are distributed relatively evenly across the income scale, while federal taxes skew very heavily to higher-income earners.
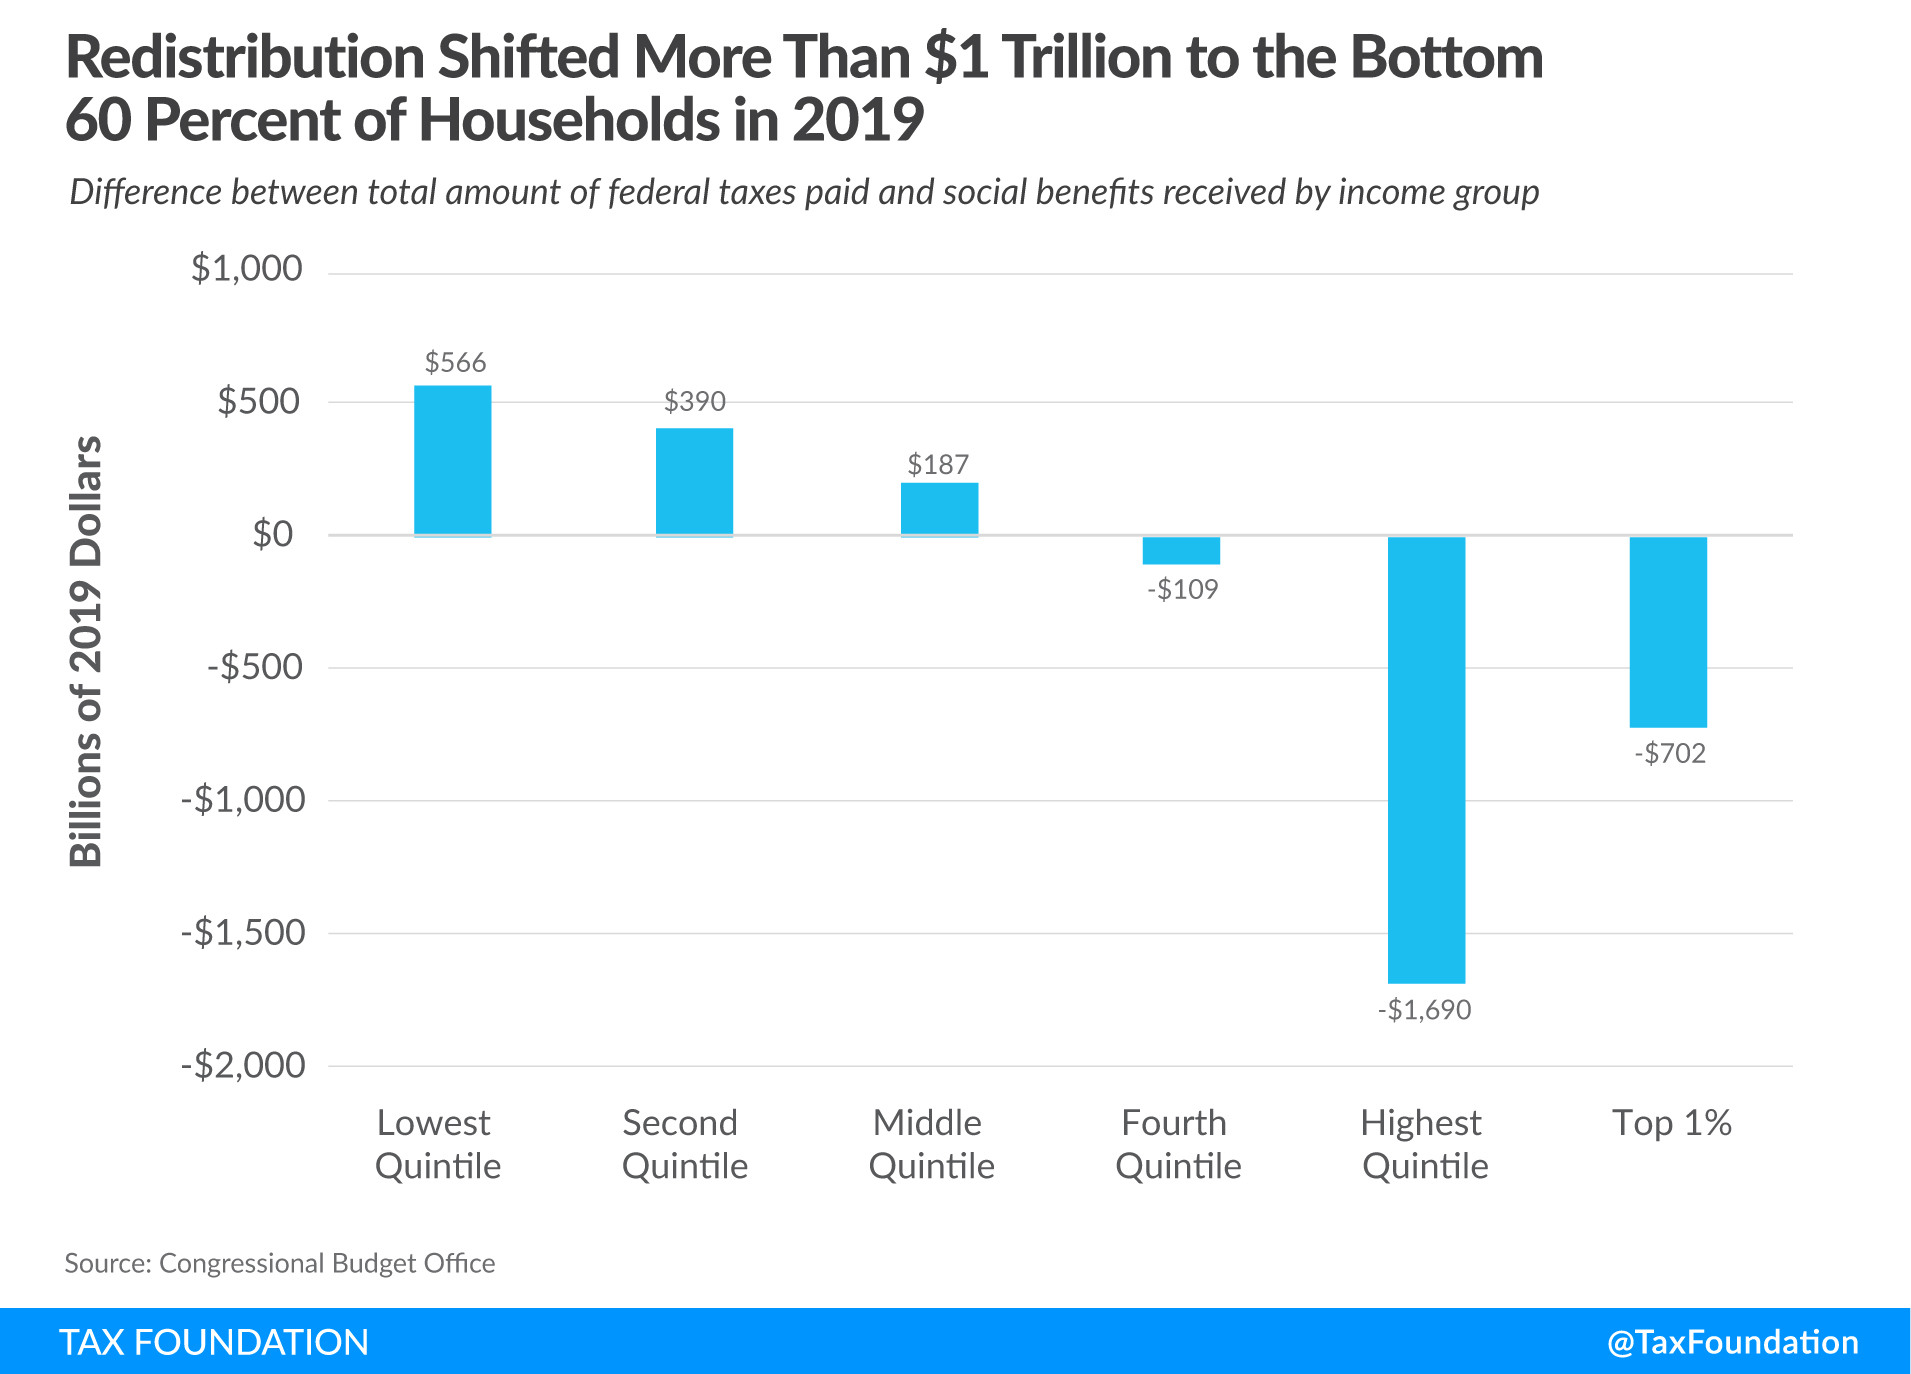
Individual Results Add Up to Considerable Redistribution
Figure 1 shows the aggregate amount of income gained or lost due to tax and federal benefit policies for the five quintiles plus the top 1 percent of households. We can see that federal fiscal policy increased the overall income for households in the lowest quintile by $566 billion in 2019. Households in the second quintile gained $390 billion in income while households in the middle quintile gained $187 billion in income.
Combined, the first three quintiles gained more than $1.1 trillion in income thanks to federal benefit policies, even after netting out their federal taxes paid.
On the other end of the income scale, we can see that progressive fiscal policy reduced the incomes of households in the fourth quintile by $109 billion in 2019. However, this is a fraction of the nearly $1.7 trillion that households in the highest quintile saw their incomes fall due to federal fiscal policy. Of this amount, some $702 billion came from households in the top 1 percent alone.
Overall, federal fiscal policy lowered the incomes of the top 40 percent of American households by roughly $1.8 trillion in 2019. Of this, more than $1.1 trillion was redistributed to lift the incomes of households in the bottom 60 percent of the population, while the remaining $656 billion went to pay for other federal spending.
The Fiscal System Has Historically Favored Low-Income Households
Figure 2 paints an interesting picture of the increasing progressivity of the federal tax and benefit system since 1979. CBO adjusted the data series to 2019 dollars to allow for an apples-to-apples comparison over the decades.
Unsurprisingly, since 1979, households in the lowest quintile and the second quintile have received more in federal benefits than they paid in taxes. And tax policy was a large factor in this trend, especially since the mid-1990s, as Table 7 of CBO’s supplemental data to the report shows.
Successive expansions of the Earned Income Tax Credit and the creation of the Child Tax CreditA tax credit is a provision that reduces a taxpayer’s final tax bill, dollar-for-dollar. A tax credit differs from deductions and exemptions, which reduce taxable income rather than the taxpayer’s tax bill directly. dramatically reduced the income tax liabilities for low-income households. Indeed, the doubling of the Child Tax Credit to $1,000 from $500 in the 2001 tax bill, combined with making the credit partially refundable, fully eliminated the income tax liability for households in the second quintile and gave them a large tax subsidy.
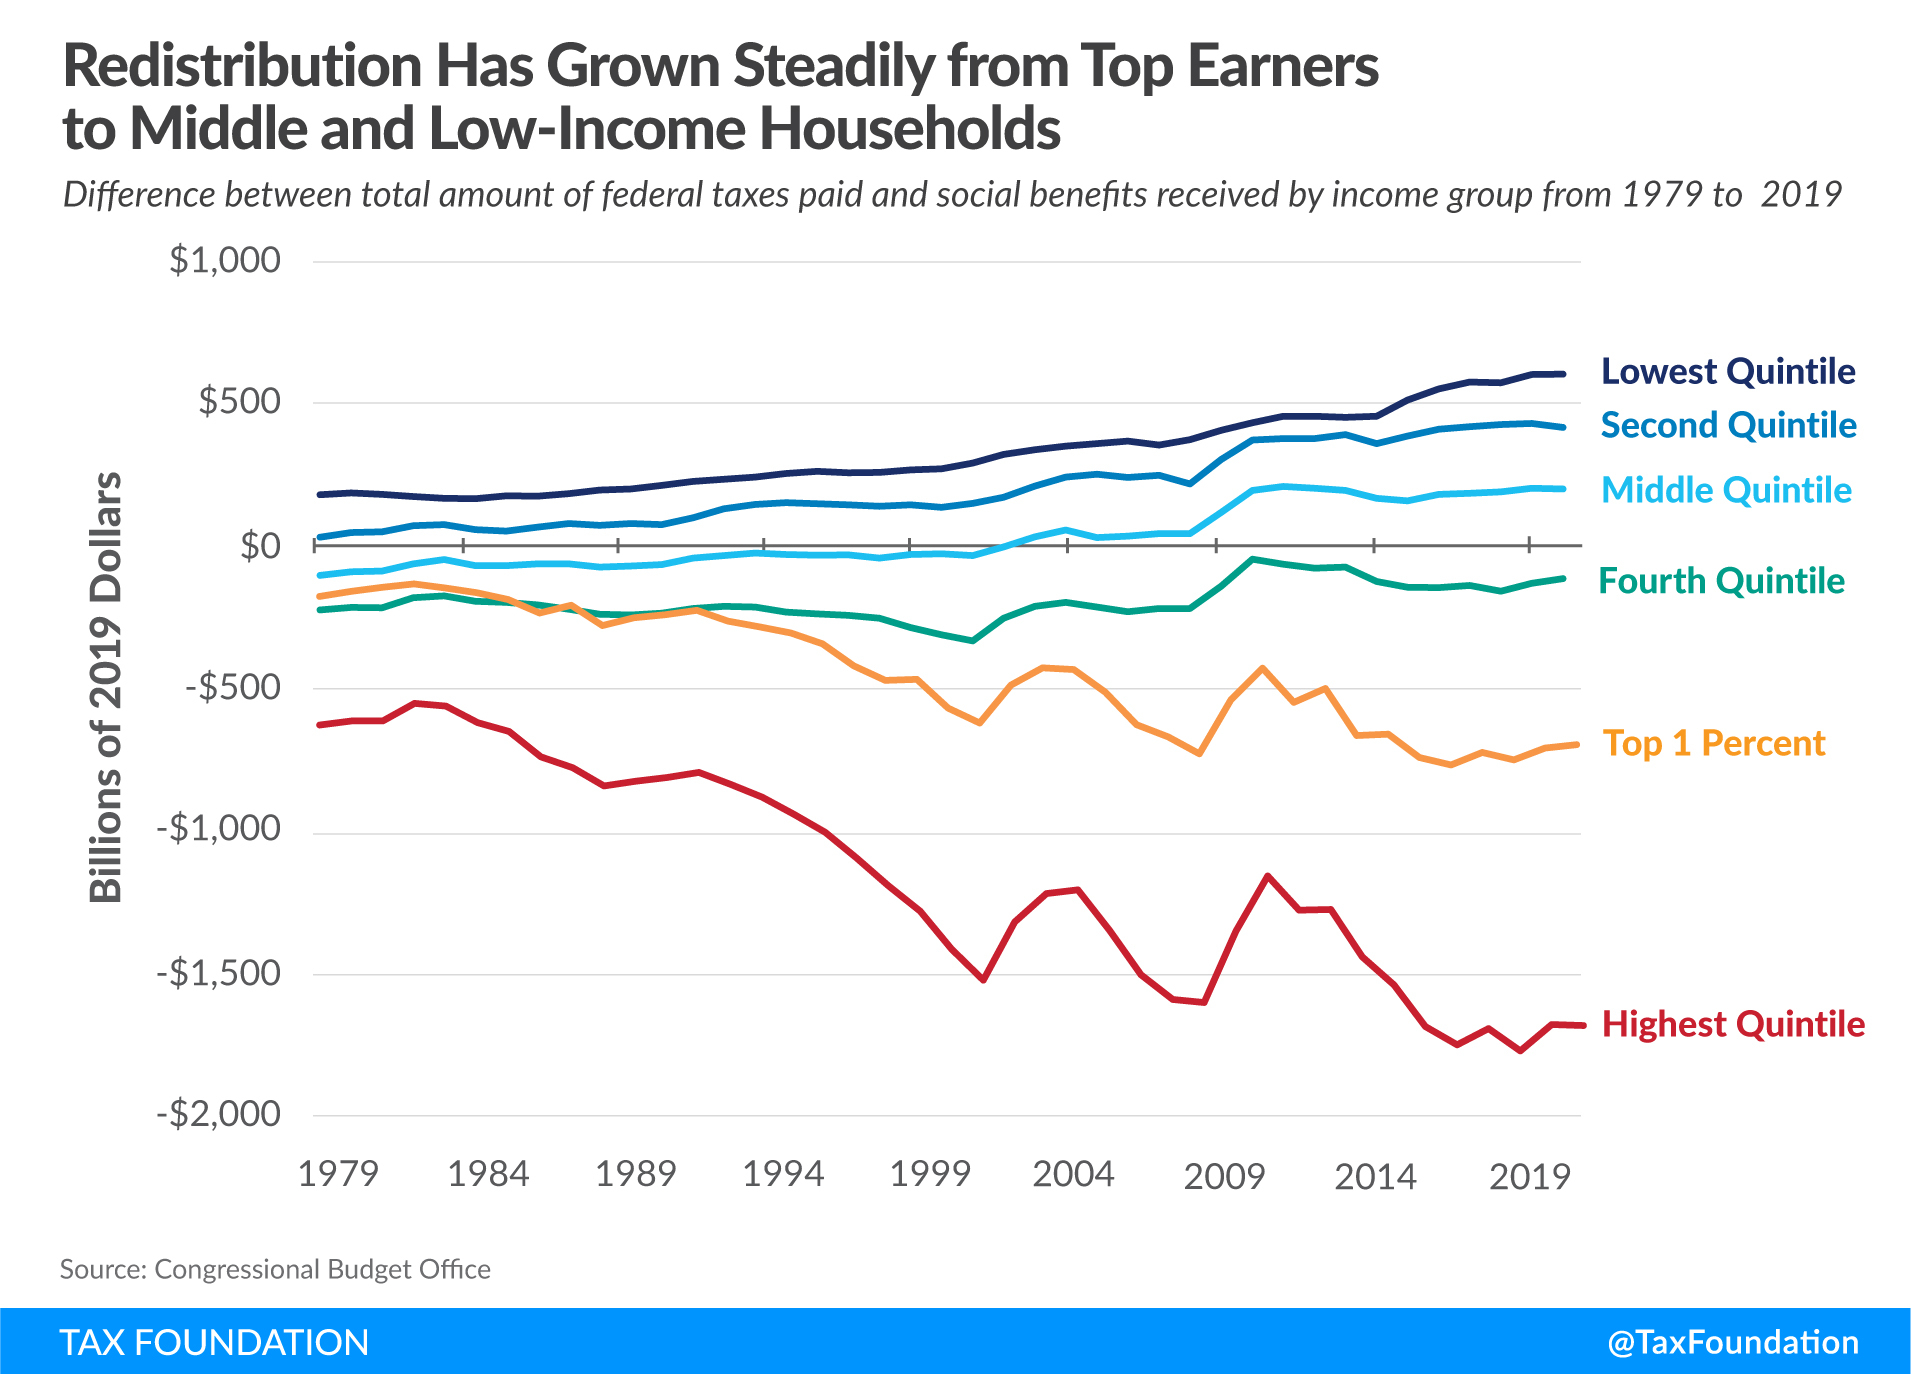
Middle-Income Households Are Also Net Beneficiaries
However, the more significant story is the middle quintile’s changing fortunes. These households also benefited substantially from the expansion of tax credits, and we can see that beginning in 2002—following the doubling of the Child Tax Credit—they became net beneficiaries from federal fiscal policy rather than net contributors. Thus, the gap between the amount of federal benefits the middle quintile received and the federal taxes they paid grew over the succeeding 15 years.
We should also note that the gap has been closing in recent years for the fourth quintile as well. However, this gap is shrinking largely because these households are receiving increasing amounts of social insurance and means-tested benefits. This is yet another indication that the burden of the fiscal system is resting more and more on households in the highest quintile.
Fiscal Burden on Highest Quintile Continues to Grow
The most obvious trend on this chart is the downward slope representing the increased fiscal burden on households in the highest quintile and, more recently, those in the top 1 percent. In 1979, the fiscal system lowered the aggregate income of households in the highest quintile by $634 billion in constant 2019 dollars. By 2000, the amount of their reduced earnings had more than doubled to $1.5 trillion, growing to $1.7 trillion by 2019.
The top 1 percent of households have also seen their contributions to the fiscal system climb dramatically over the past four decades. In 1979, the fiscal system reduced their aggregate incomes by $182 billion in 2019 dollars. By 2000, that amount had more than tripled to $626 billion, growing to $702 billion by 2012.
CBO’s findings provide some needed perspective for the upcoming tax and spending debates in 2023. Some may argue the system is too progressive while others may say it is not progressive enough. But CBO’s data clearly shows that the fiscal system is doing what a progressive fiscal system is intended to do—raise the incomes of the poor and middle-class, while reducing the incomes of upper-income households. It’s up to voters and lawmakers to decide if this amount of redistribution is too much or too little.
Stay informed on the tax policies impacting you.
Subscribe to our free newsletter to get the latest tax data, news and analysis.
Subscribe