


Comparing Europe’s Tax Systems: Individual Taxes
2 min readBy:Our recently published 2022 International Tax Competitiveness Index (ITCI) measures and compares how well OECD countries promote sustainable economic growth and investment through competitive and neutral taxA tax is a mandatory payment or charge collected by local, state, and national governments from individuals or businesses to cover the costs of general government services, goods, and activities. systems. This week, we examine how European OECD countries rank on individual taxes, continuing our series on the ITCI’s component rankings.
The ITCI’s individual tax component scores OECD countries on their top marginal individual income tax rates and thresholds, how complex the income tax is, and the tax rates levied on income from capital gains and dividends.
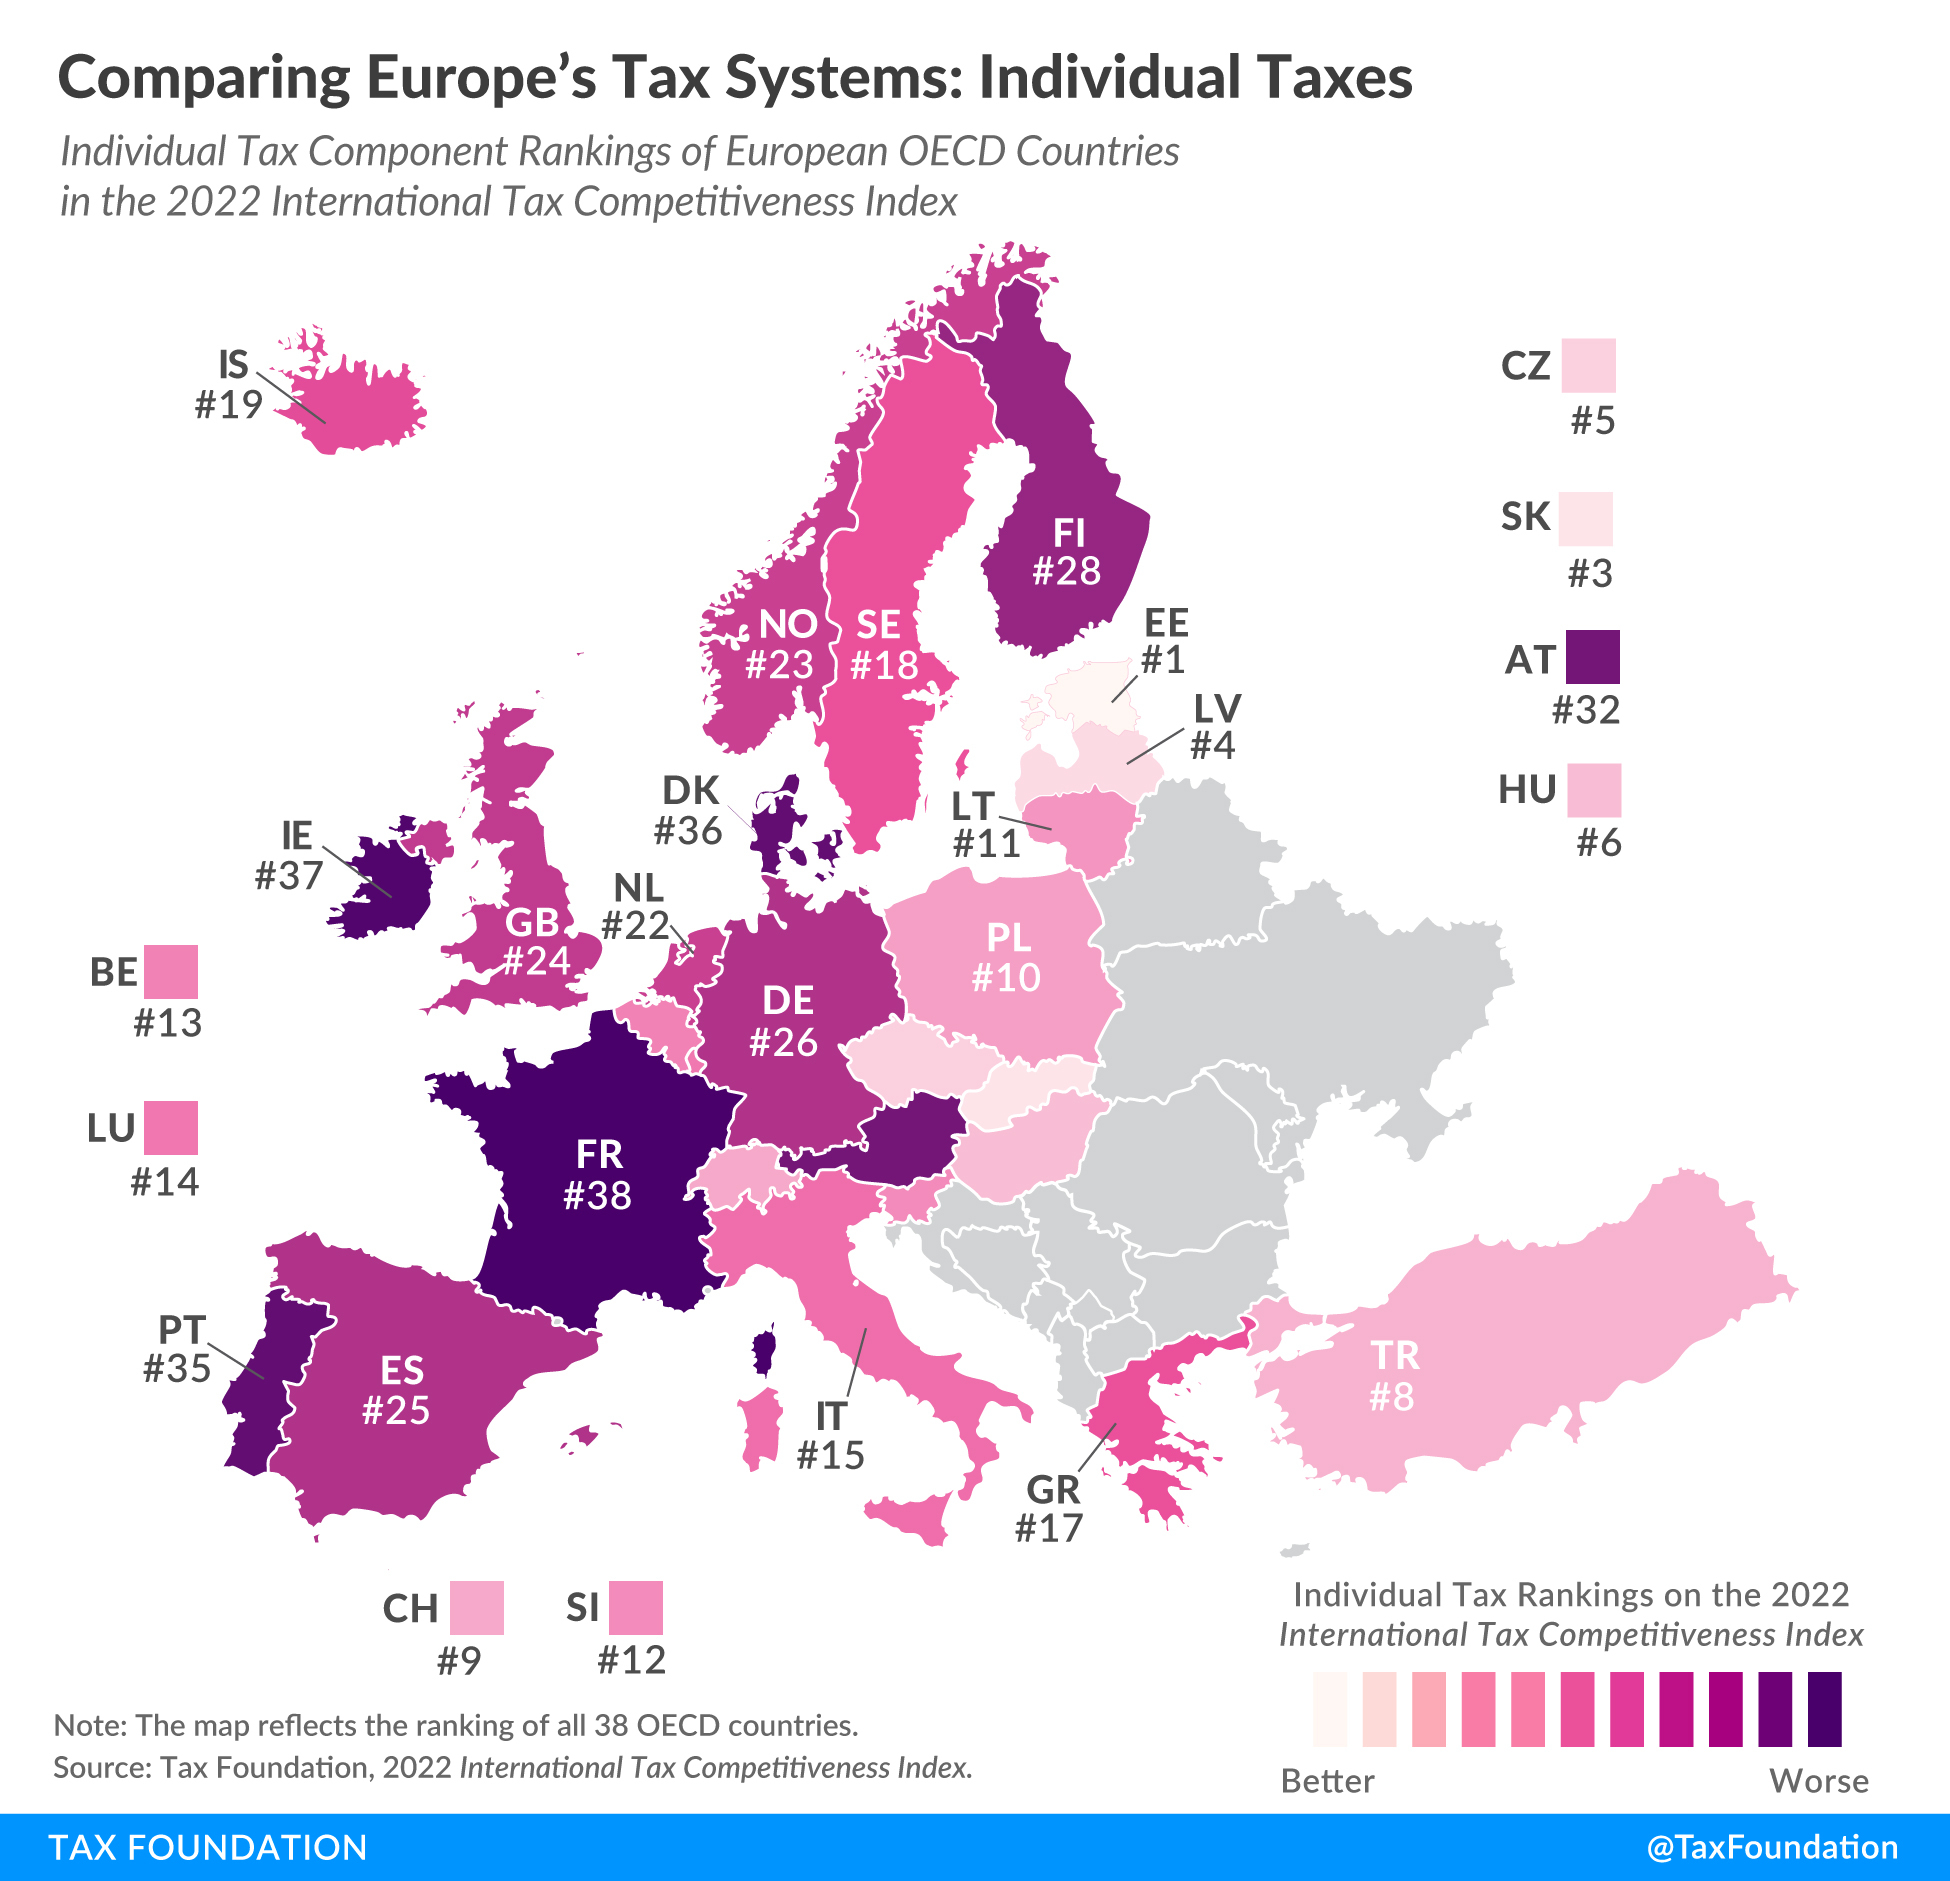
Estonia has the most competitive individual tax system in the OECD. The Baltic country levies a top marginal income tax rate of 20 percent on wage income, the second lowest rate in the OECD. Estonia applies the top rate at 0.33 times the average national income, making it a relatively flat income tax.
Estonia’s labor tax payments are largely automated, resulting in one of the easiest income tax systems to comply with in the OECD. Estonian policymakers prioritize simplicity which is consistently evident throughout the tax code.
Due to Estonia’s cash-flow tax on business profits, there is no separate levy on dividend income, setting the dividends tax rate to zero percent. Capital gains are taxed at a rate of 20 percent, close to the OECD average of 19 percent and aligned with its corporate tax.
In contrast, the French individual income taxAn individual income tax (or personal income tax) is levied on the wages, salaries, investments, or other forms of income an individual or household earns. The U.S. imposes a progressive income tax where rates increase with income. The Federal Income Tax was established in 1913 with the ratification of the 16th Amendment. Though barely 100 years old, individual income taxes are the largest source system is the least competitive of all OECD countries. France’s top marginal tax rate of 45.9 percent is applied at 14.7 times the average national income. Additionally, a 9.7 surtax is applied to those at the upper end of the income distribution. Capital gains and dividends are both taxed at comparably high top rates of 34 percent.
Click here to see an interactive version of OECD countries’ individual tax rankings, then click on your country for more information about the strengths and weaknesses of its tax system.
To see whether your country’s individual tax rank has improved in recent years, check out the table below. To learn more about how we determined these rankings, read our methodology here.
| Country | 2020 Rank | 2021 Rank | 2022 Rank | Change from 2021 to 2022 |
|---|---|---|---|---|
| Australia (AU) | 19 | 19 | 20 | -1 |
| Austria (AT) | 34 | 30 | 32 | -2 |
| Belgium (BE) | 13 | 13 | 13 | 0 |
| Canada (CA) | 28 | 32 | 31 | 1 |
| Chile (CL) | 26 | 29 | 34 | -5 |
| Colombia (CO) | 3 | 10 | 2 | 8 |
| Costa Rica (CR) | 33 | 35 | 33 | 2 |
| Czech Republic (CZ) | 1 | 1 | 5 | -4 |
| Denmark (DK) | 36 | 37 | 36 | 1 |
| Estonia (EE) | 4 | 3 | 1 | 2 |
| Finland (FI) | 30 | 31 | 28 | 3 |
| France (FR) | 38 | 36 | 38 | -2 |
| Germany (DE) | 27 | 28 | 26 | 2 |
| Greece (GR) | 29 | 27 | 17 | 10 |
| Hungary (HU) | 7 | 6 | 6 | 0 |
| Iceland (IS) | 22 | 26 | 19 | 7 |
| Ireland (IE) | 37 | 38 | 37 | 1 |
| Israel (IL) | 32 | 33 | 30 | 3 |
| Italy (IT) | 17 | 18 | 15 | 3 |
| Japan (JP) | 18 | 17 | 16 | 1 |
| Korea (KR) | 16 | 15 | 27 | -12 |
| Latvia (LV) | 6 | 4 | 4 | 0 |
| Lithuania (LT) | 11 | 11 | 11 | 0 |
| Luxembourg (LU) | 15 | 14 | 14 | 0 |
| Mexico (MX) | 31 | 20 | 29 | -9 |
| Netherlands (NL) | 21 | 24 | 22 | 2 |
| New Zealand (NZ) | 5 | 5 | 7 | -2 |
| Norway (NO) | 20 | 22 | 23 | -1 |
| Poland (PL) | 10 | 9 | 10 | -1 |
| Portugal (PT) | 35 | 34 | 35 | -1 |
| Slovak Republic (SK) | 2 | 2 | 3 | -1 |
| Slovenia (SI) | 12 | 12 | 12 | 0 |
| Spain (ES) | 14 | 16 | 25 | -9 |
| Sweden (SE) | 25 | 23 | 18 | 5 |
| Switzerland (CH) | 9 | 8 | 9 | -1 |
| Turkey (TR) | 8 | 7 | 8 | -1 |
| United Kingdom (GB) | 23 | 25 | 24 | 1 |
| United States (US) | 24 | 21 | 21 | 0 |
Note: This is part of a map series in which we examine each of the five components of our 2022 International Tax Competitiveness Index.
Taxes make more sense with us in your inbox.
Subscribe to our newsletter for tax insights that cut through the noise—and make sense of it.
Sign UpAbout the Author

Expert
Sean Bray
Vice President of Global Tax Policy at Tax Foundation and Policy Director of Tax Foundation Europe
Sean Bray is Vice President of Global Tax Policy at Tax Foundation and Policy Director of Tax Foundation Europe, where he researches international tax issues with a focus on tax policy in Europe. Prior to joining the Tax Foundation, Sean Bray worked in the United States Senate on tech, telecom, and trade policy.