Local taxA tax is a mandatory payment or charge collected by local, state, and national governments from individuals or businesses to cover the costs of general government services, goods, and activities. policies often depend on or are determined by state policymakers. When it comes to comprehensive tax reform, however, incorrectly designed local tax policies could offset any improvements brought about by state tax policies. Indiana is one of the states where state-local interactions are crucial for the efficient design of the individual income taxAn individual income tax (or personal income tax) is levied on the wages, salaries, investments, or other forms of income an individual or household earns. The U.S. imposes a progressive income tax where rates increase with income. The Federal Income Tax was established in 1913 with the ratification of the 16th Amendment. Though barely 100 years old, individual income taxes are the largest source of tax revenue in the U.S. system.
Recently, the state has implemented several important tax changes, including a reduction of the state individual income tax rate from 3.15 percent to 2.9 percent by 2027. In January 2023, Indiana established the State and Local Tax Review Task Force to evaluate a range of potential tax reforms, including further cuts to the state individual income tax.
While policymakers’ attention has been almost exclusively focused on state income taxes, Indiana is one of 16 states where local income taxes are authorized and one of six states where they constitute a significant source of local tax revenues. What’s more important, and often ignored, is that Indiana counties have significantly increased their income tax rates over the last decade to provide property taxA property tax is primarily levied on immovable property like land and buildings, as well as on tangible personal property that is movable, like vehicles and equipment. Property taxes are the single largest source of state and local revenue in the U.S. and help fund schools, roads, police, and other services. relief, diversify their revenue structure, and finance various public projects.
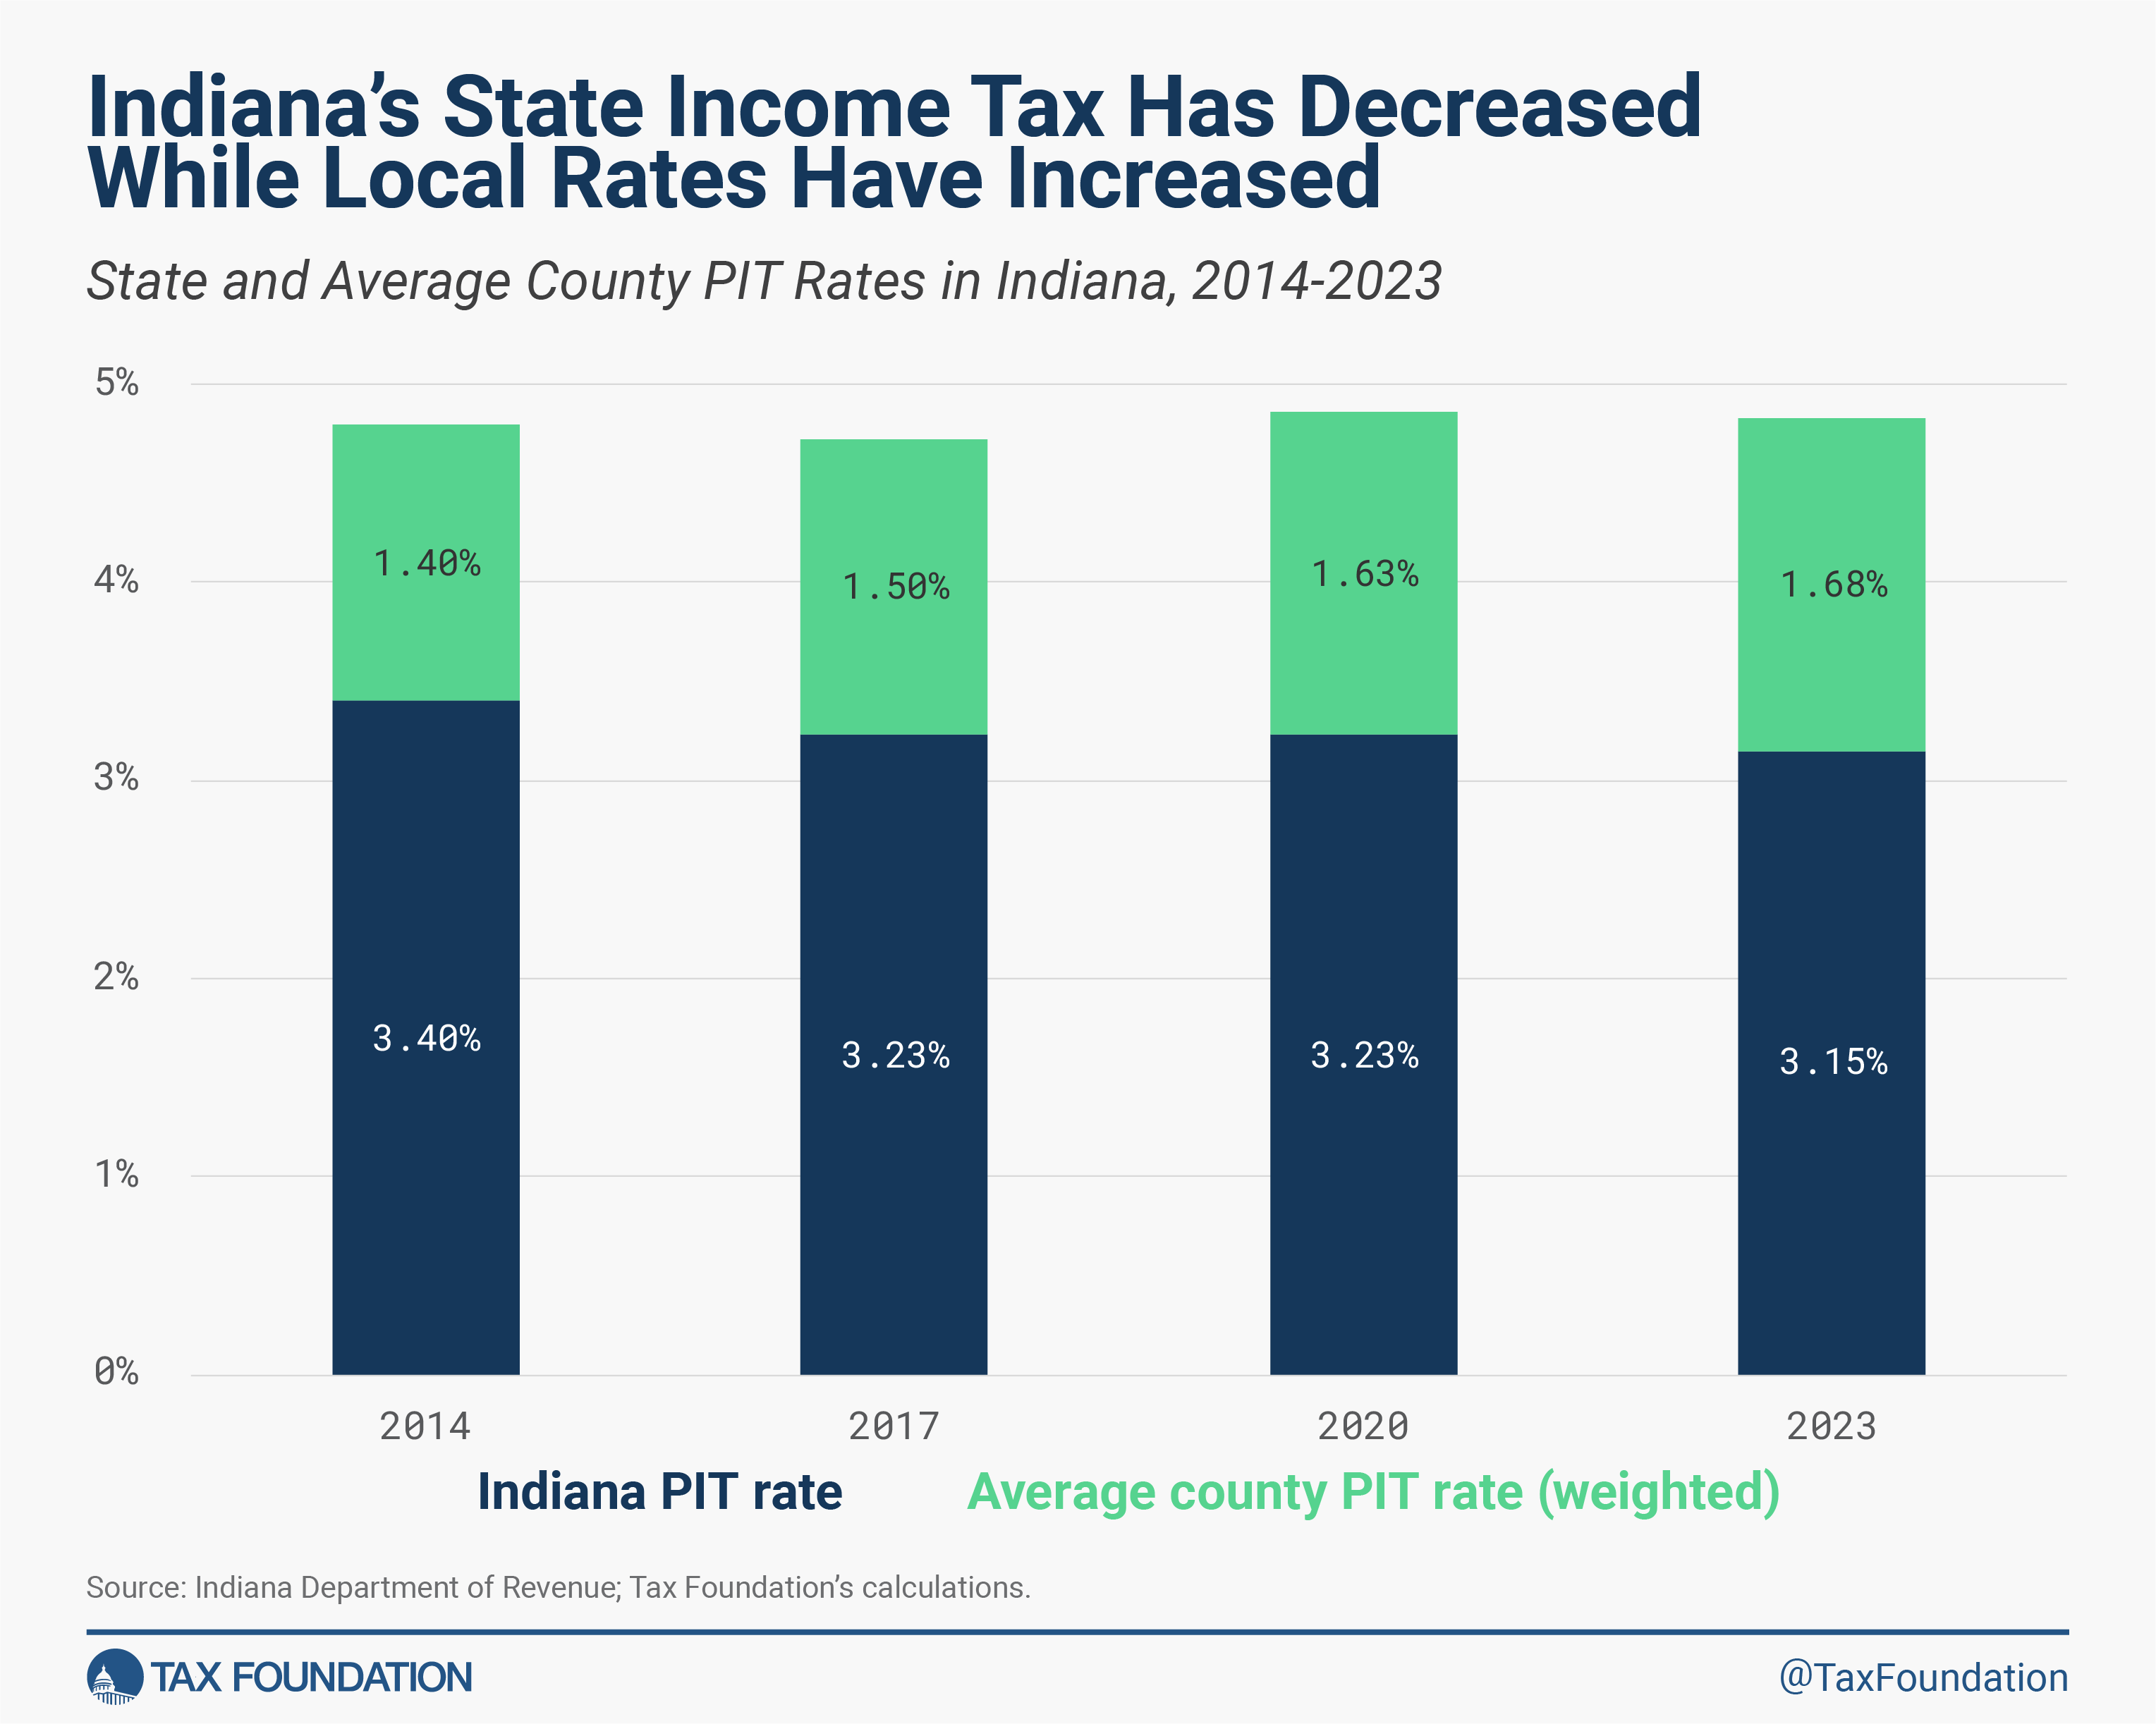
Figure 1 shows that while the state individual income tax rate decreased from 3.4 percent to 3.15 percent from 2014 to 2023, the average county rate weighted by total county income increased from 1.40 percent to 1.68 percent over the same period. Consequently, the combined state and local rate stayed almost constant at approximately 4.80 percent. While state policymakers have succeeded in reducing the state individual income tax rate, the overall income tax burden for residents of most counties has not changed or even slightly increased.
The rise in the average county rate was driven by a structural change in the distribution of local rates across most Indiana counties. As illustrated in Table 1, in 2015, 23 counties had a personal income tax (PIT) rate between 0 and 1 percent, but only 10 of them remained at or below 1 percent by 2023. At the same time, there were only 15 counties with a PIT rate of about 2 percent in 2015, and this number more than doubled by 2023.
Table 1. Number of Counties by PIT Rate Level in 2015 and 2023
| Rate Level | 2015 | 2023 |
|---|---|---|
| 0% - 1.0% | 23 | 10 |
| 1% - 1.5% | 34 | 22 |
| 1.5% - 2.0% | 20 | 27 |
| 2.0% - 2.5% | 10 | 20 |
| >2.5% | 5 | 13 |
| Median Level | 1.40% | 1.75% |
In Indiana, unlike some other states where local income tax rates are uniform, county rates exhibit significant variation. As of 2023, the highest county income tax rate (3 percent in Pulaski County) is six times higher than the lowest county PIT rate (0.5 percent in Porter County). As shown in Table 2, the top five counties have rates above 2.85 percent, while rates in the bottom five counties do not exceed 0.9 percent.
Table 2. Indiana Counties with Highest and Lowest PIT Rates, 2023
| Highest Rates | Lowest Rates | ||
|---|---|---|---|
| County | Rate | County | Rate |
| Randolph | 3.00% | Porter | 0.50% |
| Cass | 2.95% | Pike | 0.75% |
| Wabash | 2.90% | Spencer | 0.80% |
| Jasper | 2.86% | Gibson | 0.90% |
| Pulaski | 2.85% | Jefferson | 0.90% |
Out of the 92 counties, only 22 experienced no rate change from 2015 to 2023, and a mere 4 counties lowered the rate. The remaining 64 counties saw an increase in their income tax rates, sometimes quite significantly. Most notably, Randolph, Sullivan, Vermillion, Jennings, and Owen counties increased their rates by more than 1.2 percentage points.
Table 3. Individual PIT Rate Changes in Indiana Counties, 2015-2023
| Largest Increases | Decreases or No Change | ||
|---|---|---|---|
| County | Rate change | County | Rate change |
| Randolph | +1.5% | Pulaski | -0.28% |
| Sullivan | +1.4% | Daviess | -0.25% |
| Vermillion | +1.3% | Wayne | -0.25% |
| Jennings | +1.25% | Jasper | -0.1% |
| Owen | +1.2% | 22 counties | No change |
While such diversity in local income tax rates reflects the essence of American federalism and the ability of local governments to determine their revenue structure and expenditure priorities, the existing system creates substantial risks for virtually any state income tax reform.
The statutory local income tax rate is currently capped at a relatively high 3.75 percent, which includes the property tax relief rate of up to 1.25 percent and the expenditure rate of up to 2.5 percent (2.75 for Marion County). Notably, this cap does not encompass the special purpose rate that the General Assembly may authorize for a specific project in a particular county. This implies that an average county can still theoretically increase its PIT rate by 2 percentage points, either amplifying the overall income tax burden in the state or offsetting any further state income tax rate reductions.
Without imposing a stricter limit on local income tax rates or structurally reforming the local income tax system, any state-level reform is likely to fall short of its goals. Lowering the cap can be done in several ways, most of which would not affect current rates in the overwhelming majority of counties. For instance, reducing the maximum property tax relief rate in half to 0.6 percent and reducing the maximum expenditure rate to 2.15 percent would not affect more than 90 percent of counties (as only nine counties currently have the property tax relief rate of 0.6 percent or above and only eight counties currently have the expenditure rate of 2.15 percent or above). In total, this would reduce the current local PIT rate cap from 3.75 percent to 2.75 percent. Additionally, the special purpose rate benefits only a very small group of counties (19 counties in 2023), so eliminating it could improve transparency and uniformity of the state and local income tax system.
Local income taxes, when not unified (as is the case in Indiana), generally violate the principle of neutrality. Consider a simple example: when two neighboring counties have markedly different (or diverging) tax rates, some residents may find it beneficial in the long run to relocate from a high-tax county to a low-tax county. Migration data from the IRS supports the hypothesis that county-level migration patterns in Indiana align with a more general state-level trend: in recent years, more people have moved from high-tax to low-tax communities.
Table 4. County-to-County Migration Patterns in Indiana by PIT Rate Change Level, 2015-2021
| Rate Change | Net Inflow/Outflow | |
|---|---|---|
| Average Additional Filers per 100,000 Residents | Average Migration AGI Gains (Inflation-Adjusted) | |
| Cuts or No Change | +144 | +$4.1 million |
| 0.0% - 0.5% | +221 | -$1.7 million |
| 0.5% - 1.0% | -111 | -$2.7 million |
| More than 1.0% | -83 | -$0.5 million |
Table 4 presents evidence that Indiana counties with decreasing, constant, or mildly increasing (by up to 0.5 percentage points) local income tax rates had a positive average net inflow of taxpayers from other localities in Indiana from 2015 to 2021. Conversely, counties that increased their local income tax rates by more than 0.5 percentage points experienced a negative net inflow of taxpayers to other localities in Indiana. The same pattern holds for adjusted gross incomeFor individuals, gross income is the total pre-tax earnings from wages, tips, investments, interest, and other forms of income and is also referred to as “gross pay.” For businesses, gross income is total revenue minus cost of goods sold and is also known as “gross profit” or “gross margin.” (AGI). Only counties with decreasing or constant local income tax rates experienced a positive net inflow of AGI (of about $4.1 million), while all other counties lost AGI, which means that residents were willing to relocate within Indiana in response to increasing local income tax rates.
Given that Indiana’s combined state and local income tax rates were below the national median from 2015 to 2021, and the state attracted new, higher-income residents from other states, all groups of counties exhibited a positive average net inflow of AGI when both intra- and interstate migration patterns are considered. However, counties with significantly increasing local income tax rates saw the smallest gain in AGI.
While local income taxes can be compatible with state tax reform, additional measures are necessary to prevent counties from acting countercyclically and entirely offsetting any state income tax rate reductions in the future. If the goal of income tax reform in Indiana is to merely redistribute revenues from the state to counties, then the state has been relatively successful over the past decade. If, however, reducing the income tax burden is the ultimate goal, then state lawmakers need to consider redesigning the current income tax system to ensure that gains made at the state level are not offset by higher local rates.
Stay informed on the tax policies impacting you.
Subscribe to get insights from our trusted experts delivered straight to your inbox.
Subscribe