In February, the OECD presented its preliminary impact assessment on the Pillar 1 and Pillar 2 proposals. The impact assessment includes estimated revenue and investment effects presented at a country group level (low-, middle- and high-income countries and investment hubs). The OECD estimates global corporate income tax revenues to increase by 4 percent if both pillars get implemented, equaling $100 billion annually.
Revenue Estimates of Pillar 1
For Pillar 1, the estimates are limited to Amount A, which allocates a fixed share of residual profits to market jurisdictions. The results presented assume a residual profit threshold of either 10 percent or 20 percent and a 20 percent reallocation of residual profits to market jurisdictions (excluding the commodities and financial sector).
The results show a slight increase in global corporate tax revenues for both the 10 and 20 percent residual profit thresholds, ranging between 0.1 and 0.7 percent in gains relative to current levels.

Interestingly, all income groups—low-, middle-, and high-income countries—are estimated to see small increases in their corporate revenues, with low- and middle-income countries expecting a higher relative increase than high-income countries. However, as pointed out during the presentation of the results, these country group estimates represent GDP-weighted averages, meaning that there can be substantial variations within each country group.
Less surprisingly, investment hubs—jurisdictions with high inward Foreign Direct Investment (FDI) relative to GDP and often low taxA tax is a mandatory payment or charge collected by local, state, and national governments from individuals or businesses to cover the costs of general government services, goods, and activities. rates—are estimated to face considerable revenue losses. In the case of a 10 percent (20 percent) residual profit threshold, the estimated revenue loss ranges between 0.2 and 5.0 percent (0.1 and 1.6 percent) relative to current revenue levels.
More than half of all the reallocated profits is estimated to stem from 100 multinational business groups.
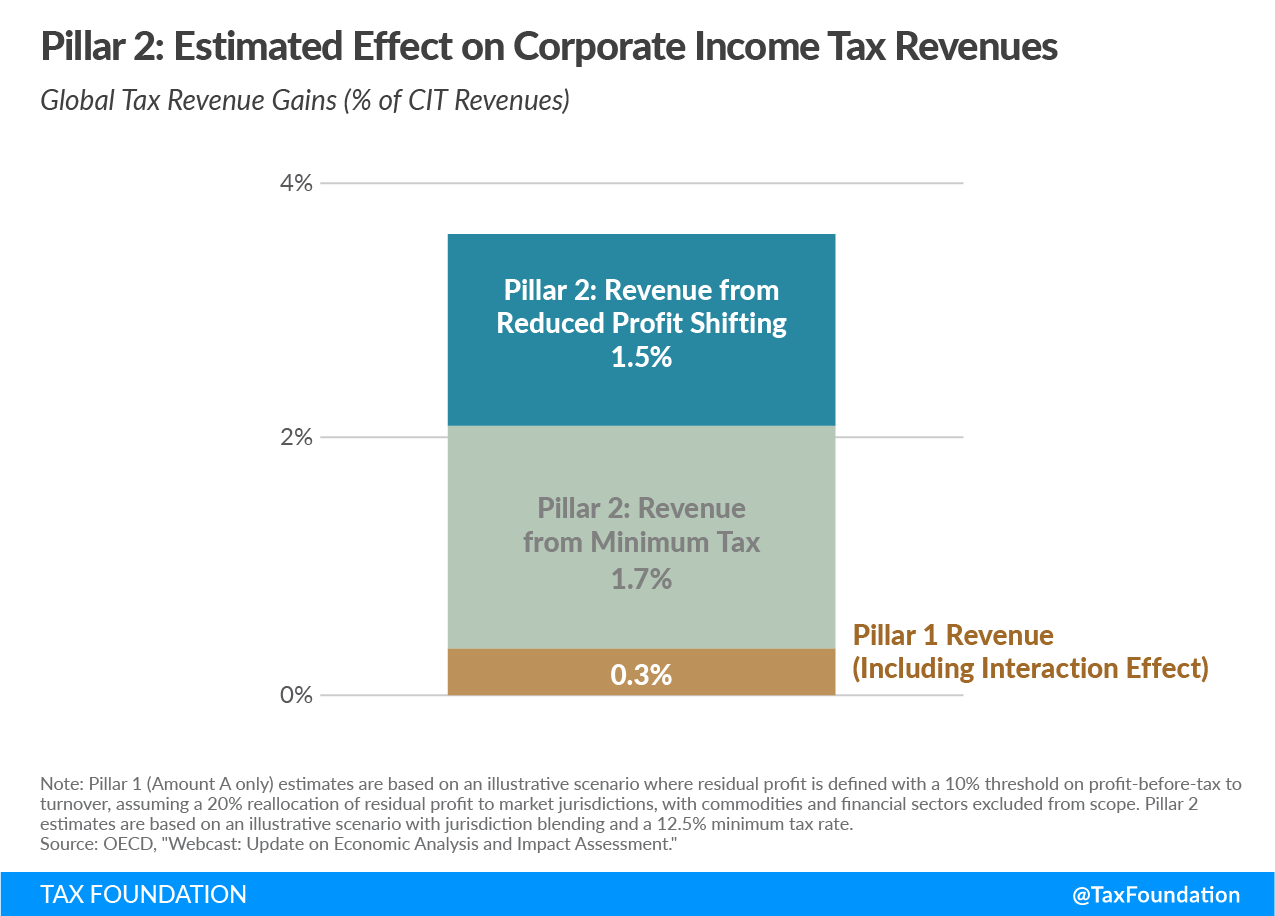
Revenue Estimates of Pillar 2
Pillar 2, which would implement a global minimum tax on corporate profits, is estimated to raise significantly more tax revenue than Pillar 1. The analysis assumes a 12.5 percent minimum rate and blending at the jurisdictional (rather than global or entity) level.
Taking into account the Pillar 1 revenue impacts and changes in profit-shifting behaviors, global corporate tax revenues are expected to increase by approximately 3.6 percent. The minimum tax itself is estimated to account for about half of that increase.
More than one-third of the additional revenue is estimated to come from reduced profit shifting. This is because the minimum tax would reduce incentives for profit shiftingProfit shifting is when multinational companies reduce their tax burden by moving the location of their profits from high-tax countries to low-tax jurisdictions and tax havens. as the tax rate differentials across jurisdictions decrease. The remainder shares results from the effects of Pillar 1.
Combined Revenue Estimates of Pillar 1 and Pillar 2
The relative increase in tax revenues resulting from both Pillar 1 and Pillar 2 is similar in low-, middle-, and high-income countries. However, the revenue sources differ substantially across these country groups.
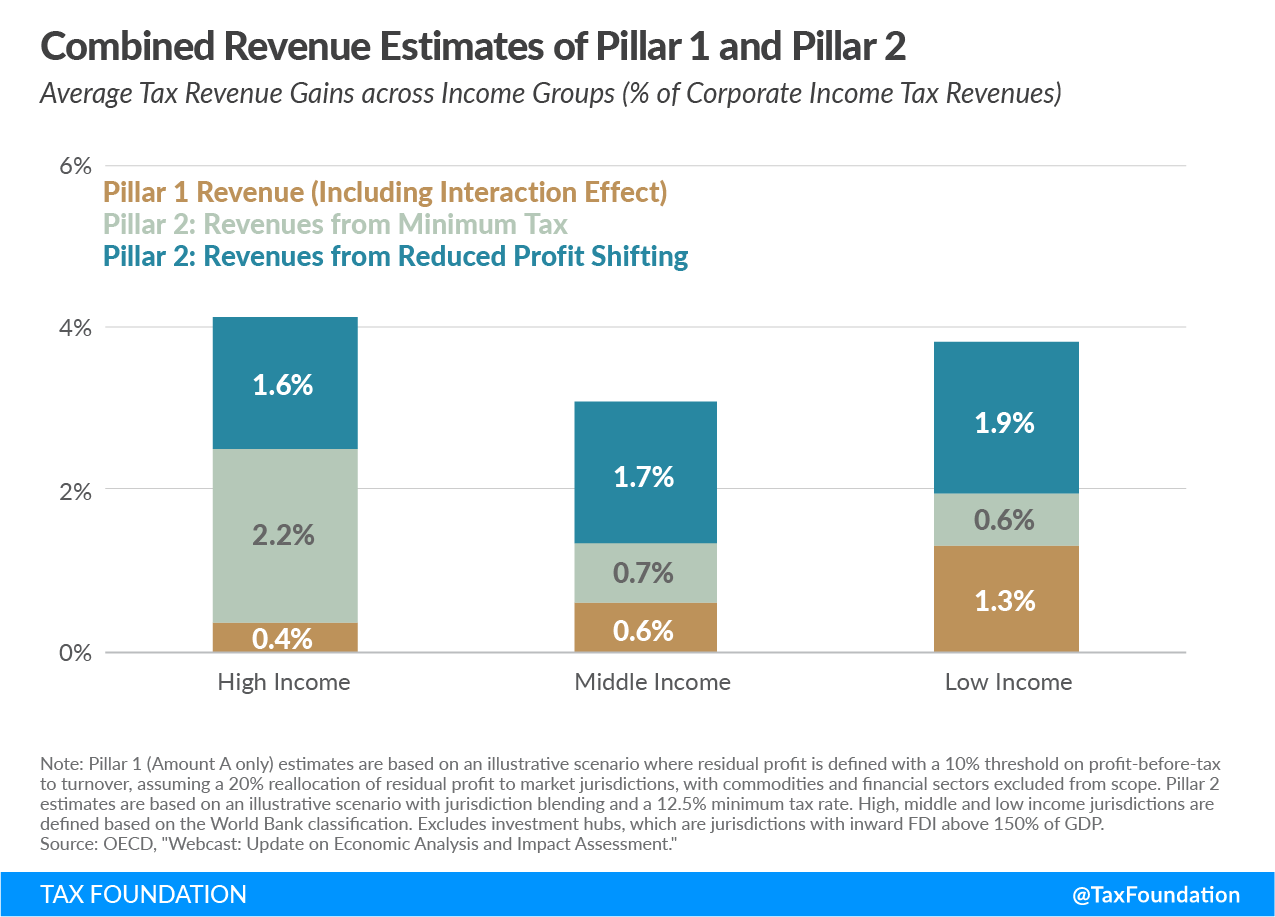
Low-income countries’ corporate tax revenues are estimated to increase by an average of almost 4 percent relative to current levels. About half of these revenues would come from reduced profit shifting, and about one-third from reallocated profits through Pillar 1. The remaining small share of revenue comes from the minimum tax.
High-income countries’ revenue gains are of similar magnitude, at just above 4 percent. However, the composition of these gains differs substantially from low-income countries. High-income countries will benefit much more from the minimum tax, which makes up more than half of all the additional tax revenues. More than one-third will come from reduced profit shifting, with Pillar 1 accounting for only a small share of the additional revenues.
Investment Effects
The OECD measured the changes in effective average tax rates to estimate the effect of Pillar 1 and Pillar 2 on investment decisions. Effective average tax rates capture not only statutory tax rates but also provisions impacting the tax base.
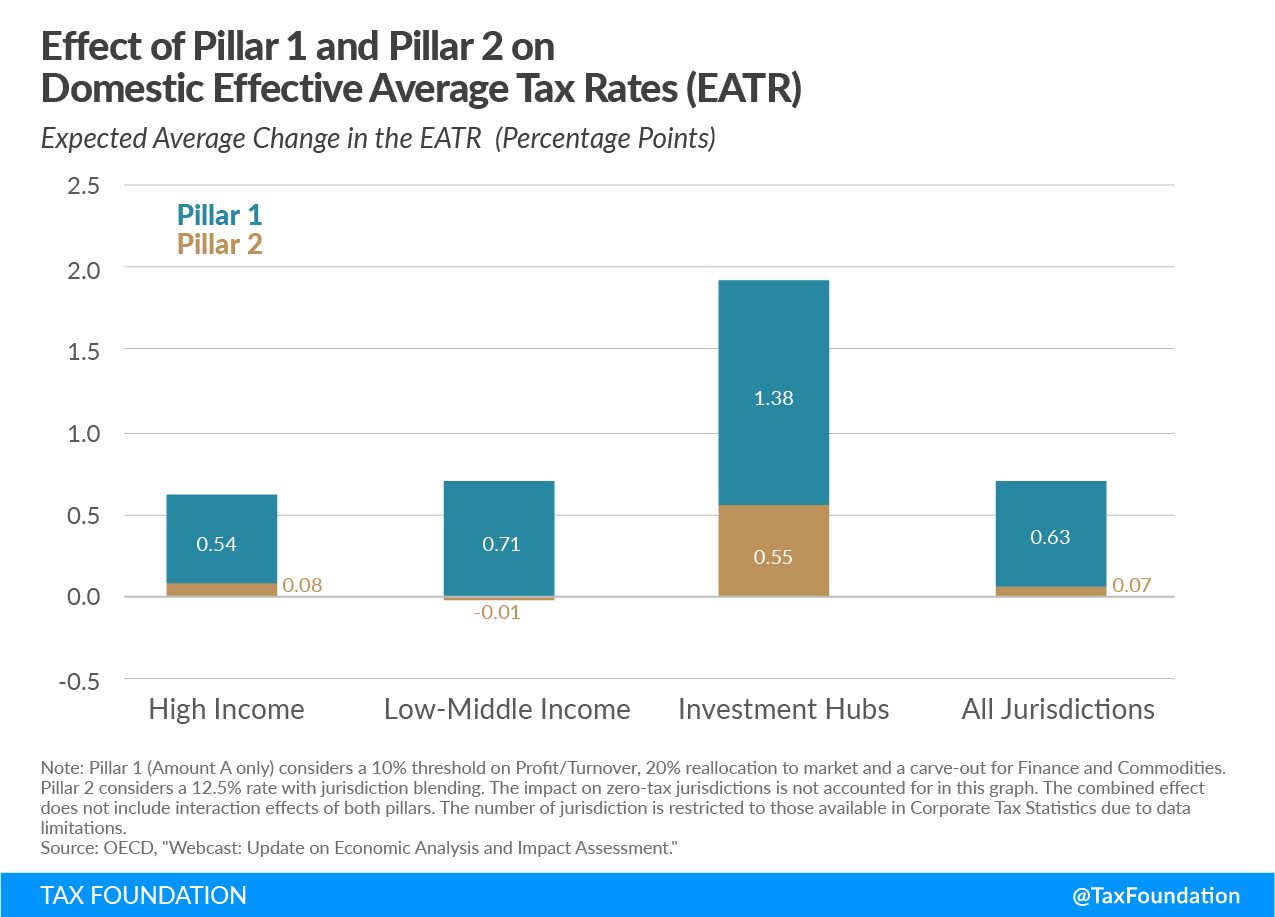
The OECD’s estimates show that, as a result of Pillar 1 and Pillar 2, effective average tax rates would increase by approximately 0.7 percentage points across all jurisdictions. Only about 0.1 percentage point would be due to Pillar 1, with Pillar 2 accounting for the remaining share.
The average increase of effective average tax rates in low-middle income and in high-income countries is similar to the global average. Only investment hubs would face much higher increases, estimated at approximately 2 percentage points.
The Data and its Limitations
The dataset covers more than 200 jurisdictions and more than 27,000 multinational enterprise groups. The data sources include aggregated country-by-country reporting data, firm-level data, the OECD Activities of Multinational Enterprises database, and macro data used for extrapolation.
One important caveat of the analysis is that the estimates are based on 2016 data, which is the most recent data available for such a broad scope of countries. However, since 2016, several anti-tax avoidance provisions, such as the European Union’s Anti-Tax Avoidance Directive (ATAD) and the U.S. Global Intangible Low-Taxed Income (GILTI) regime, have been implemented.
These provisions have likely had a significant impact on profit-shifting behaviors, effects that are not captured in the 2016 data. Thus, while the OECD’s analysis provides valuable insights into the potential revenue and economic effects of Pillar 1 and Pillar 2, it is important to keep this data limitation in mind.
The results are also limited by the assumptions that the OECD necessarily had to make given the current state of negotiations. As countries move closer to deciding the specific thresholds and rates for Pillar 1 and Pillar 2, the OECD will refine its results.
Share this article