Facts and Figures 2019: How Does Your State Compare?
Our updated 2019 edition of Facts & Figures serves as a one-stop state tax data resource that compares all 50 states on over 40 measures of tax rates, collections, burdens, and more.
1 min read
Our updated 2019 edition of Facts & Figures serves as a one-stop state tax data resource that compares all 50 states on over 40 measures of tax rates, collections, burdens, and more.
1 min read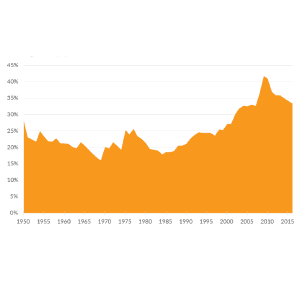
From 1986 to 2016, the top 1 percent’s share of income taxes rose from 25.8 percent to 37.3 percent, while the bottom 90 percent’s share fell from 45.3 percent to 30.5 percent.
4 min read
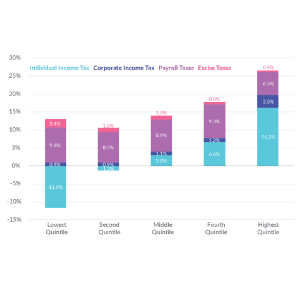
Federal tax rates vary by income group and tax source. The federal tax system redistributes income from high- and low-income taxpayers.
3 min read
While some tax preferences like the earned income tax credit (EITC) and child tax credit benefit lower- and middle-income households, others, like itemized deductions, benefit high-income households.
4 min read

In the 1950s, when the top marginal income tax rate reached 92 percent, the top 1 percent of taxpayers paid an effective rate of only 16.9 percent. As top marginal rates have fallen, the tax burden on the rich has risen.
5 min read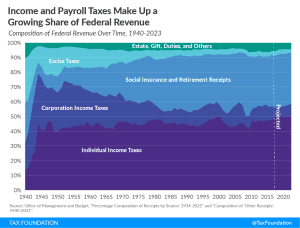
The federal income tax and federal payroll tax make up a growing share of federal revenue. Individual income taxes have become a central pillar of the federal revenue system, now comprising nearly half of all revenue.
2 min read