

Key Findings
- Across Europe, there is an ongoing campaign for higher taxes on high-income individuals, sustained through public and political advocacy.
- High marginal taxA tax is a mandatory payment or charge collected by local, state, and national governments from individuals or businesses to cover the costs of general government services, goods, and activities. rates deter investment and innovation crucial for economic growth and job creation.
- Implementation of this type of tax increase carries challenges such as capital flight, tax evasion, and enforcement complexity, making them inefficient tools for income redistribution.
- Differences in marginal tax rates affect where high-income individuals live and invest, highlighting the potential need to keep decentralized tax policies in the EU.
- The Tax Foundation’s new High-Income Tax Competitiveness Index shows that countries with less distortive tax systems attract more investment and perform better economically.
- Effective high-income tax implementation is complex. Instead, well-designed tax systems that promote economic growth and social development allow for enhanced activity, which leads to more government revenue that can then be used for redistributive purposes.
- High tax rates reduce economic competitiveness and harm the entire population. To tackle inequality, governments should focus more on targeted spending and less on inefficient taxation proposals.
Introduction: Assessing the Ongoing Campaign for More Taxes on High-Income Earners
The recent push to increase taxes on the wealthy has gained significant traction across Europe. This trend has been motivated by groups and individuals who argue that wealth and income inequality are rising and hope to design fairer tax systems that can lead to more equitable social outcomes. The European Commission launched a Tax Observatory in 2021 to study potential practices of “tax abuse.” Recent contributions related to tax evasion emphasize the need to adopt more effective taxation systems to close existing loopholes that allow for tax evasion and avoidance.[1]
Notably, some high-profile economists and policymakers have proposed significant increases to the top marginal tax rates on personal income, suggesting rates as high as 70-80 percent for the highest earners and drawing attention to the link between economic efficiency and equity in tax systems.[2]
A notable development in the wealth taxation discourse is advocacy from the very individuals who would be most affected by such taxes. For example, a group of over 250 millionaires publicly urged for higher taxes on the rich, promoting a campaign titled “Proud to Pay More.” Their argument is based on the moral stance that addressing economic inequality is both a responsibility and a necessity for the health of society, thus assuming that higher taxes would bring down said disparities. This movement reflects a shift in public discourse, as those who could be disadvantaged by said policy changes publicly support them on behalf of the “greater good.”[3]
The momentum of these proposals is further propelled by calls from the EU’s tax experts for a minimum wealth taxA wealth tax is imposed on an individual’s net wealth, or the market value of their total owned assets minus liabilities. A wealth tax can be narrowly or widely defined, and depending on the definition of wealth, the base for a wealth tax can vary. rate of 2 percent on the ultra-wealthy. This initiative builds on previous initiatives, such as the 15 percent minimum tax for multinationals that is slowly being implemented. This suggests a slow but continued drive toward higher taxes on the rich.[4]
In terms of public perception, it is clear that many see progressive taxation as a tool to combat rising inequality and finance social spending. Furthermore, economic arguments for such taxes are also being discussed; for instance, some have argued that progressive taxes could raise substantial revenues without harming economic growth, provided they are designed to minimize avoidance and do not excessively penalize productive investment.
However, evidence shows that the implementation of such tax policies comes with economic consequences. For example, there are many technical hurdles that come with assessing wealth, risks of responses such as capital flight, and the potential for legal challenges against such revenue measures. Moreover, the degree of international coordination required to prevent tax evasion adds an additional layer of complexity.[5]
Overall, the economic narrative that pushes for higher taxes on the rich in Europe is characterized by a complex interplay of ethical justifications, economic arguments that mostly focus on reducing inequality, and some practical considerations. The evolving landscape suggests that future tax reforms in Europe are likely to consider greater progressivity, so the effect of said reforms must be properly assessed.
The importance of conducting a thorough analysis of taxes on the wealthy in Europe is underscored by the complexity of the topic as well as the potential economic and social consequences that such fiscal measures may carry. Firstly, an in-depth examination is crucial to evaluate the actual effectiveness of these taxes in terms of revenue collection and their expected impact on reducing inequality. This is pivotal because, although the intention behind these taxes is to promote greater levels of economic equity, the fact remains that there are several real-world examples that show how such reforms have often led to unintended negative consequences, exacerbating other economic issues.
Secondly, a detailed analysis helps identify potential response effects such as tax evasion and avoidance, which tend to increase with higher tax rates. High-income individuals often have more resources and capabilities to shift their assets to lower-tax jurisdictions or to utilize complex legal mechanisms that allow them to reduce their tax burden. This ultimately questions the potential revenue raised by said taxes and also highlights to what extent such drive for higher progressivity can erode the existing tax baseThe tax base is the total amount of income, property, assets, consumption, transactions, or other economic activity subject to taxation by a tax authority. A narrow tax base is non-neutral and inefficient. A broad tax base reduces tax administration costs and allows more revenue to be raised at lower rates. and lead to significant losses of government revenues that are ultimately vital for financing essential public services.
Moreover, high taxes on capital and high incomes can have negative impacts on key economic variables such as investment and innovation. High-net-worth individuals and businesses often invest in high-risk, high-reward projects such as new companies and startups or new technologies. An overly burdensome tax regime could deter these investments, which, in the long term, would negatively affect economic growth and job creation. Therefore, it is crucial to balance the need for revenues with maintaining an environment conducive to growth, investment, innovation, and business development.
Finally, the implementation of taxes on the wealthy requires consideration of the broader economic and fiscal context across Europe, where tax systems vary significantly across countries. Competitive tax policy takes these differences into account and avoids harmonization attempts that can create distortions in the EU single market. For instance, insufficient or inappropriate fiscal coordination can lead to imbalances among Member States and ultimately undermine the objectives of cohesion and solidarity of the European Union.
Despite the argued potential benefits, tax harmonization across the EU often attracts significant criticism, primarily because it tends to involve increasing taxes, which can have a detrimental effect on economic efficiency and performance. Critics argue that harmonization may lead to a “race to the top” in tax rates, as countries converge on higher levels of taxation, thereby stifling economic dynamism and reducing incentives for investment. Moreover, such policies could infringe on national sovereignty, as countries lose the ability to set tax policies that reflect their specific economic conditions and priorities, which poses broader political questions. In essence, while harmonization aims to create fiscal unity, it ultimately risks imposing a one-size-fits-all approach that is likely not suitable for all Member States within the very diverse economic landscape of the European Union.
A careful and comprehensive study of these issues is essential to devise tax policies that are not effective and sustainable.
The structure of this report is organized into four distinct sections that aim to comprehensively address the taxation of high incomes. The first section introduces the challenge of taxing high incomes and provides a thorough literature review on the effects of such measures. This review encompasses both the theoretical underpinnings and empirical studies that illustrate the impact of high-income taxes on economic behavior and income distribution. The second section presents an overview of high-income taxes across Europe, detailing variations in tax rates and structures among different countries. In the third section, the effects of high-income taxes are quantified, employing quantitative methods to analyze the data collected from various European nations to ascertain the actual outcomes of the proposed tax changes. The fourth and final section concludes the paper by summarizing the findings and offering insights into the implications of high-income taxes for policymakers and stakeholders in the realm of public finance.
What Research Tells Us about the Effect of Taxes on High Incomes
The idea of applying low taxes to higher incomes comes from supply-side economic theory. More specifically, it acknowledges that top earners are very sensitive to tax changes and reminds us that they represent a large fraction of countries’ savings and entrepreneurship. Therefore, raising their taxes may disincentivize entrepreneurial activity and distort investment decisions that are essential to economic growth. This can also discourage investments and entrepreneurial activities that ultimately benefit the entire population and lead to higher tax revenues as a result of sustained economic growth.
Santo Milasi and Robert J. Waldmann, using a panel data sample of OECD countries, have found that the maximum growth-maximizing tax rates need to be analyzed carefully, as the levels of taxation that could potentially be applied may lead to migration effects as well as asset rotation strategies that would ultimately lead to much lower effective tax rates.[6] Therefore, it would be more appropriate to apply the type of reforms that broaden the tax base and limit the incentives for tax avoidance.
The issue of the mobility and sensitivity of top earners has been extensively studied in the literature. For example, Akcigit et al. (2016) analyze the effect of top income taxes on the international migration of inventors.[7] The authors use a panel of international inventor data from U.S. and European patent offices and track their international location patterns since the 1970s all the way up to the mid-2010s.
The authors find a negative correlation between higher tax rates and the proportion of high-quality foreign investors located in a country as well as the proportion of high-quality domestic inventors who remain in their country. They then compare how inventors in the top 1 percent of the income distribution react to changes in tax policy, in terms of their citations relative to other groups of inventors. They find an elasticity with respect to the net tax rate of 0.02. This means that if the net tax rate increases by 1 percent, the evidence in this study suggests that 0.02 percent of the inventors in the top 1 percent of the income distribution will react. This elasticity is higher for foreign inventors, at 1.04. That is, with tax rate increases of 1 percent, 1.04 percent of foreign inventors leave the country.
In other words, to increase the number of inventors in the top 1 percent by 1 percent, marginal rates would have to be reduced by 10 percentage points for domestic inventors and by 26 percentage points for foreign inventors. These elasticities are similar to those found by Kleven et al. (2013) in a study of football players and their transfer history.[8]
Although the proportion of inventors who relocate due to high tax rates may seem small, the associated cost can be significant. Inventors are key drivers of economic growth, and their migration in response to tax policies can represent a substantial cost to tax progressivity. Additionally, inventors generate significant spillover effects on their geographically close peers, making it even more crucial to attract and retain them domestically. Therefore, losing even a small number of inventors can lead to a notable decrease in the tax base and negatively impact economic growth.
These results suggest that it is necessary to think of high-income taxpayers as a very unique group when calibrating optimal taxation models, mainly by considering the positive spillovers they generate on the rest of their geographically close peers. For this reason, increasing tax rates on high incomes can have a negative impact on entrepreneurship and ultimately hinder economic growth.
Mathilde Muñoz addresses how income taxes affect the migration decisions of rich taxpayers in Europe.[9] The study focuses on whether high taxes prompt these citizens to relocate to countries with more favorable tax regimes, analyzing patterns of migration within EU Member States. Unlike previous research that focuses on specific sectors (such as inventors or football players), Muñoz’s work analyzes a broader and more representative group of the population—the top percent of earners across 21 European countries—filling a significant gap in the empirical evidence on tax-induced international migration.
Muñoz’s results reveal that the location decisions of high-income taxpayers are indeed significantly influenced by income tax rates. The elasticity of the number of high earners with respect to the net tax rate varies between 0.1 and 0.3—and exceeds 1.0 for foreign taxpayers. This means that if the net tax rate increases by 1 percent, the evidence in this study suggests that 0.1 to 0.3 percent of high earners will react by relocating or adjusting their taxable incomeTaxable income is the amount of income subject to tax, after deductions and exemptions. For both individuals and corporations, taxable income differs from—and is less than—gross income. , and in the case of foreign taxpayers, the figure rises to 1 percent. Migration elasticities differ widely across Member States, suggesting varied incentives to adopt nationally competitive tax policies within Europe.
Muñoz concludes that migration responses to tax reforms are a critical factor for European economic policymaking. Although the magnitude of the impact of tax-induced migration on the total tax base is small, there are notable heterogeneities in taxpayers’ sensitivity to taxes, which can lead to negative effects when tax rates are increased without considering said differences. The study underscores the need to avoid those policies that may result in significant competitive disadvantages for the countries that adopt them.
There is also specific evidence for European country samples that address how tax schemes influence the migration and wage decisions of high earners. These studies provide detailed insights from national contexts such as Spain, the United Kingdom, and the Nordic countries, highlighting the different responses depending on local tax policies and the economic structure of each region.
Kleven et al. (2014) explore the impact of the preferential tax schemes for foreigners in Denmark, which allows high-income new immigrants to be taxed at a preferential flat rate for up to three years.[10] The study finds that this scheme doubled the number of highly paid foreigners in Denmark compared to slightly lower-paid foreigners ineligible for the scheme. This suggests a very large elasticity of migration with respect to the net tax rate between 1.5 and 2. This implies that a 1 percent increase in the net tax rate would lead 1.5 to 2 percent of high-income immigrants to either relocate or decide against moving to Denmark.
Advani et al. (2023) analyze the impact of tax reform on the migration of the super-rich in the UK, particularly the effects of changing the tax treatment of offshore investments for non-domiciled residents (“non-doms”).[11] Prior to the 2017 reform, offshore investment returns of non-doms were not subject to tax. The reform reduced the effective net tax rate for those who had been in the UK for at least 15 of the last 20 years, leading to a modest increase in the migration rate. However, significant increases in reported income and taxes paid were found, which shows how taxpayers do not always adjust to avoid this type of tax increase.
Similarly, Agrawal and Foremny (2018) examine migration in response to changes in top marginal tax rates as a result of a Spanish tax reform that enabled autonomous communities to set their own tax rates.[12] Using individual-level Social Security data, the authors find that a 1 percent increase in a region’s net tax rate relative to other regions increases the probability of individuals moving to that territory by 1.7 percentage points. They also estimate an elasticity of 0.85 in the number of high-income taxpayers with respect to net tax rates, that is, a 1 percent increase in marginal tax rates produces a 0.85 percent movement of taxpayers to other regions, suggesting a notable response to regional tax differentials.
The review of the literature on high-income taxes highlights several critical issues related to raising tax rates for top earners. First, there is considerable consensus that high marginal rates are likely to deter investment and innovation, especially because high-income individuals tend to be more mobile taxpayers and thus tend to be more sensitive to changes in tax policy. Research indicates that higher tax rates can lead to a flight of talent and capital to jurisdictions with more favorable tax regimes, lowering the tax base in the original country and potentially affecting its prospects for long-term economic growth. However, this does not suggest a need for global wealth tax harmonization. Increasing marginal tax rates can lead to inefficiencies and costs in the form of slower growth, and they do not necessarily solve redistribution problems.[13]
In fact, evidence suggests that public spending is more efficient in achieving greater redistribution.[14] Moreover, different countries have unique economic conditions and policy priorities, making localized tax policies more effective for addressing their specific challenges and goals.
Also, in addition to all the previous points, the literature suggests that, while increases in high-income taxes could generate additional revenue in the short run, they can also incentivize tax avoidance and evasion, complicating the administration and efficiency of these tax systems. The elasticity of taxpayer behavior with respect to changes in tax rates is shown to be significant, suggesting that rate increases could not only increase migration for those impacted but also lead to asset rotation strategies that aim to minimize the effective impact of tax increases.
Finally, the literature reviewed highlights the importance of considering the broader implications of economic efficiency when designing tax policies. Striking a balance between maximizing tax revenues and maintaining an environment that fosters economic growth and boosts competitiveness is no easy task. In this case, evidence suggests that increased revenues may not materialize as anticipated, while a decline in economic activity appears highly probable. Although progressive taxes on high incomes are seen as tools to combat inequality, policymakers must acknowledge their poor track record and negative impact on investment and economic innovation.
High Income Taxes across the EU
This section provides a general overview of taxes on high incomes, updating and extending previous estimates by Fritzon and Lundberg (2019).[15] To estimate the tax burden of upper-income taxpayers, income tax rates will be combined with Social Security contributions as well as consumption taxes. This approach is slightly different from the papers cited in our literature review, but we consider it to be an important step toward providing an overview of the full tax burden borne by higher-income individuals.
In addition, we incorporate other relevant metrics that ultimately influence the amount of taxes paid by higher-income earners. More specifically, in addition to looking at marginal tax rates and overall tax burden, we aim to answer the following questions:
- On what taxable base is the top marginal income tax rate applied?
- What percentage of the population is taxed at the top marginal income tax rate?
- How progressive is the tax system? That is, what is the difference between the tax burden on average incomes and the tax burden on high incomes?
Whenever possible, the most current data (up to 2024) is used. Not all countries have final information available up to the current year. This is the case for the implicit consumption taxA consumption tax is typically levied on the purchase of goods or services and is paid directly or indirectly by the consumer in the form of retail sales taxes, excise taxes, tariffs, value-added taxes (VAT), or an income tax where all savings is tax-deductible. rates, estimated by the European Commission, for which the most recent estimates come from 2022. The source of our data comes from various public and private institutions, to improve the robustness of the calculations provided.[16]
In some cases, such as Croatia or Spain, regional governments have regulatory capacity to set income tax rates. For these cases, we provide the top statutory rate that would apply if a regional government does not modify the default marginal rate set by the central government. This implies that we may be underestimating the marginal rate in some regions, which should be taken into account when making any inference and public policy recommendations about those nations and their tax policies.
For the estimation of social contributions, we follow the Fritzon and Lundberg methodology. Therefore, those countries that set a cap to create a ceiling limiting the total amounts paid should be understood as having deferred income that decreases at the margin of marginal taxation. In contrast, nations that do not cap contributions paid by high incomes are seen as countries creating pure taxes.
For the marginal rates of consumption, we use the average effective rates. This is simpler and a good approximation of the marginal rates borne by taxpayers at the top levels of income because effective rates on consumption do not vary by household income level, as López et al. (2024) show.[17]
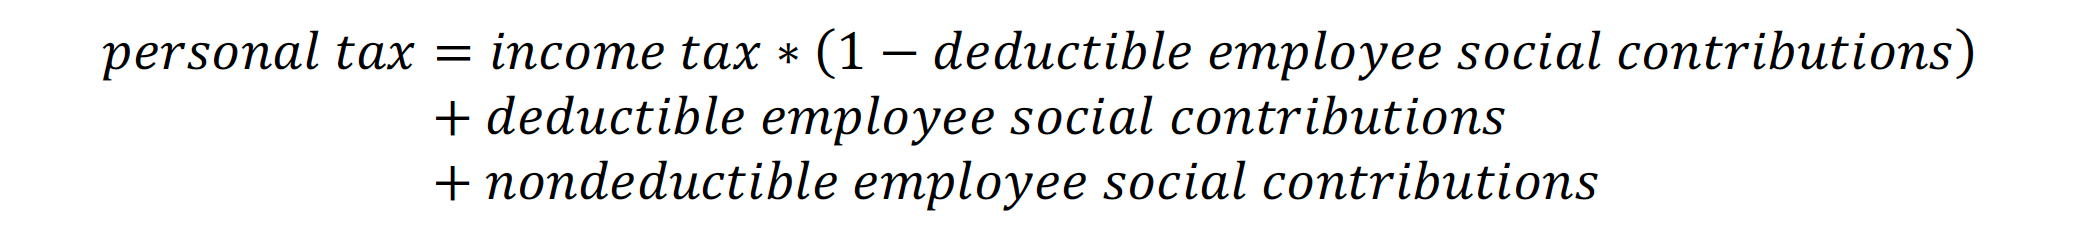
Thus, to estimate the effective marginal tax rateThe marginal tax rate is the amount of additional tax paid for every additional dollar earned as income. The average tax rate is the total tax paid divided by total income earned. A 10 percent marginal tax rate means that 10 cents of every next dollar earned would be taken as tax. (EMTR) for top income earners, we replicate the formula developed by Fritzon and Lundberg:
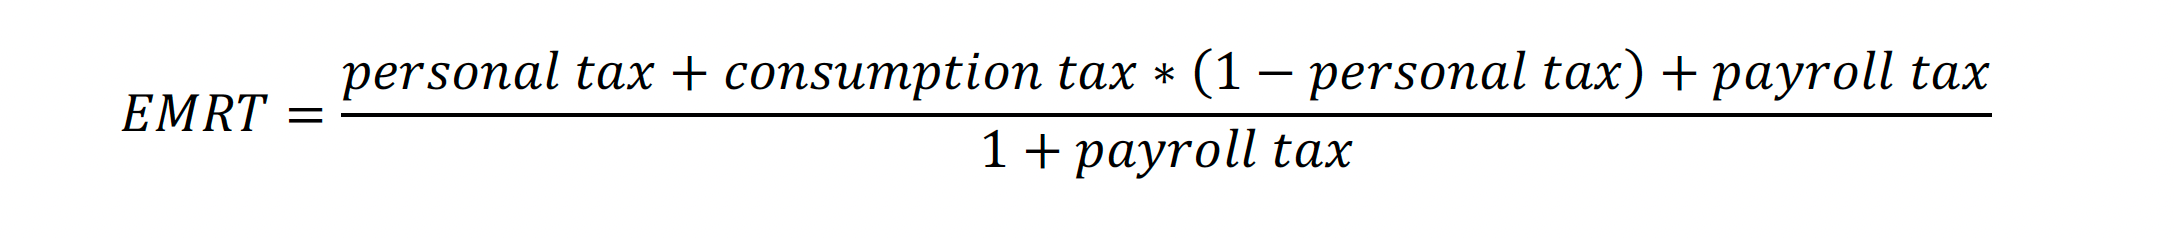
And personal tax is computed as follows:
Marginal Rates on Top Income Earners
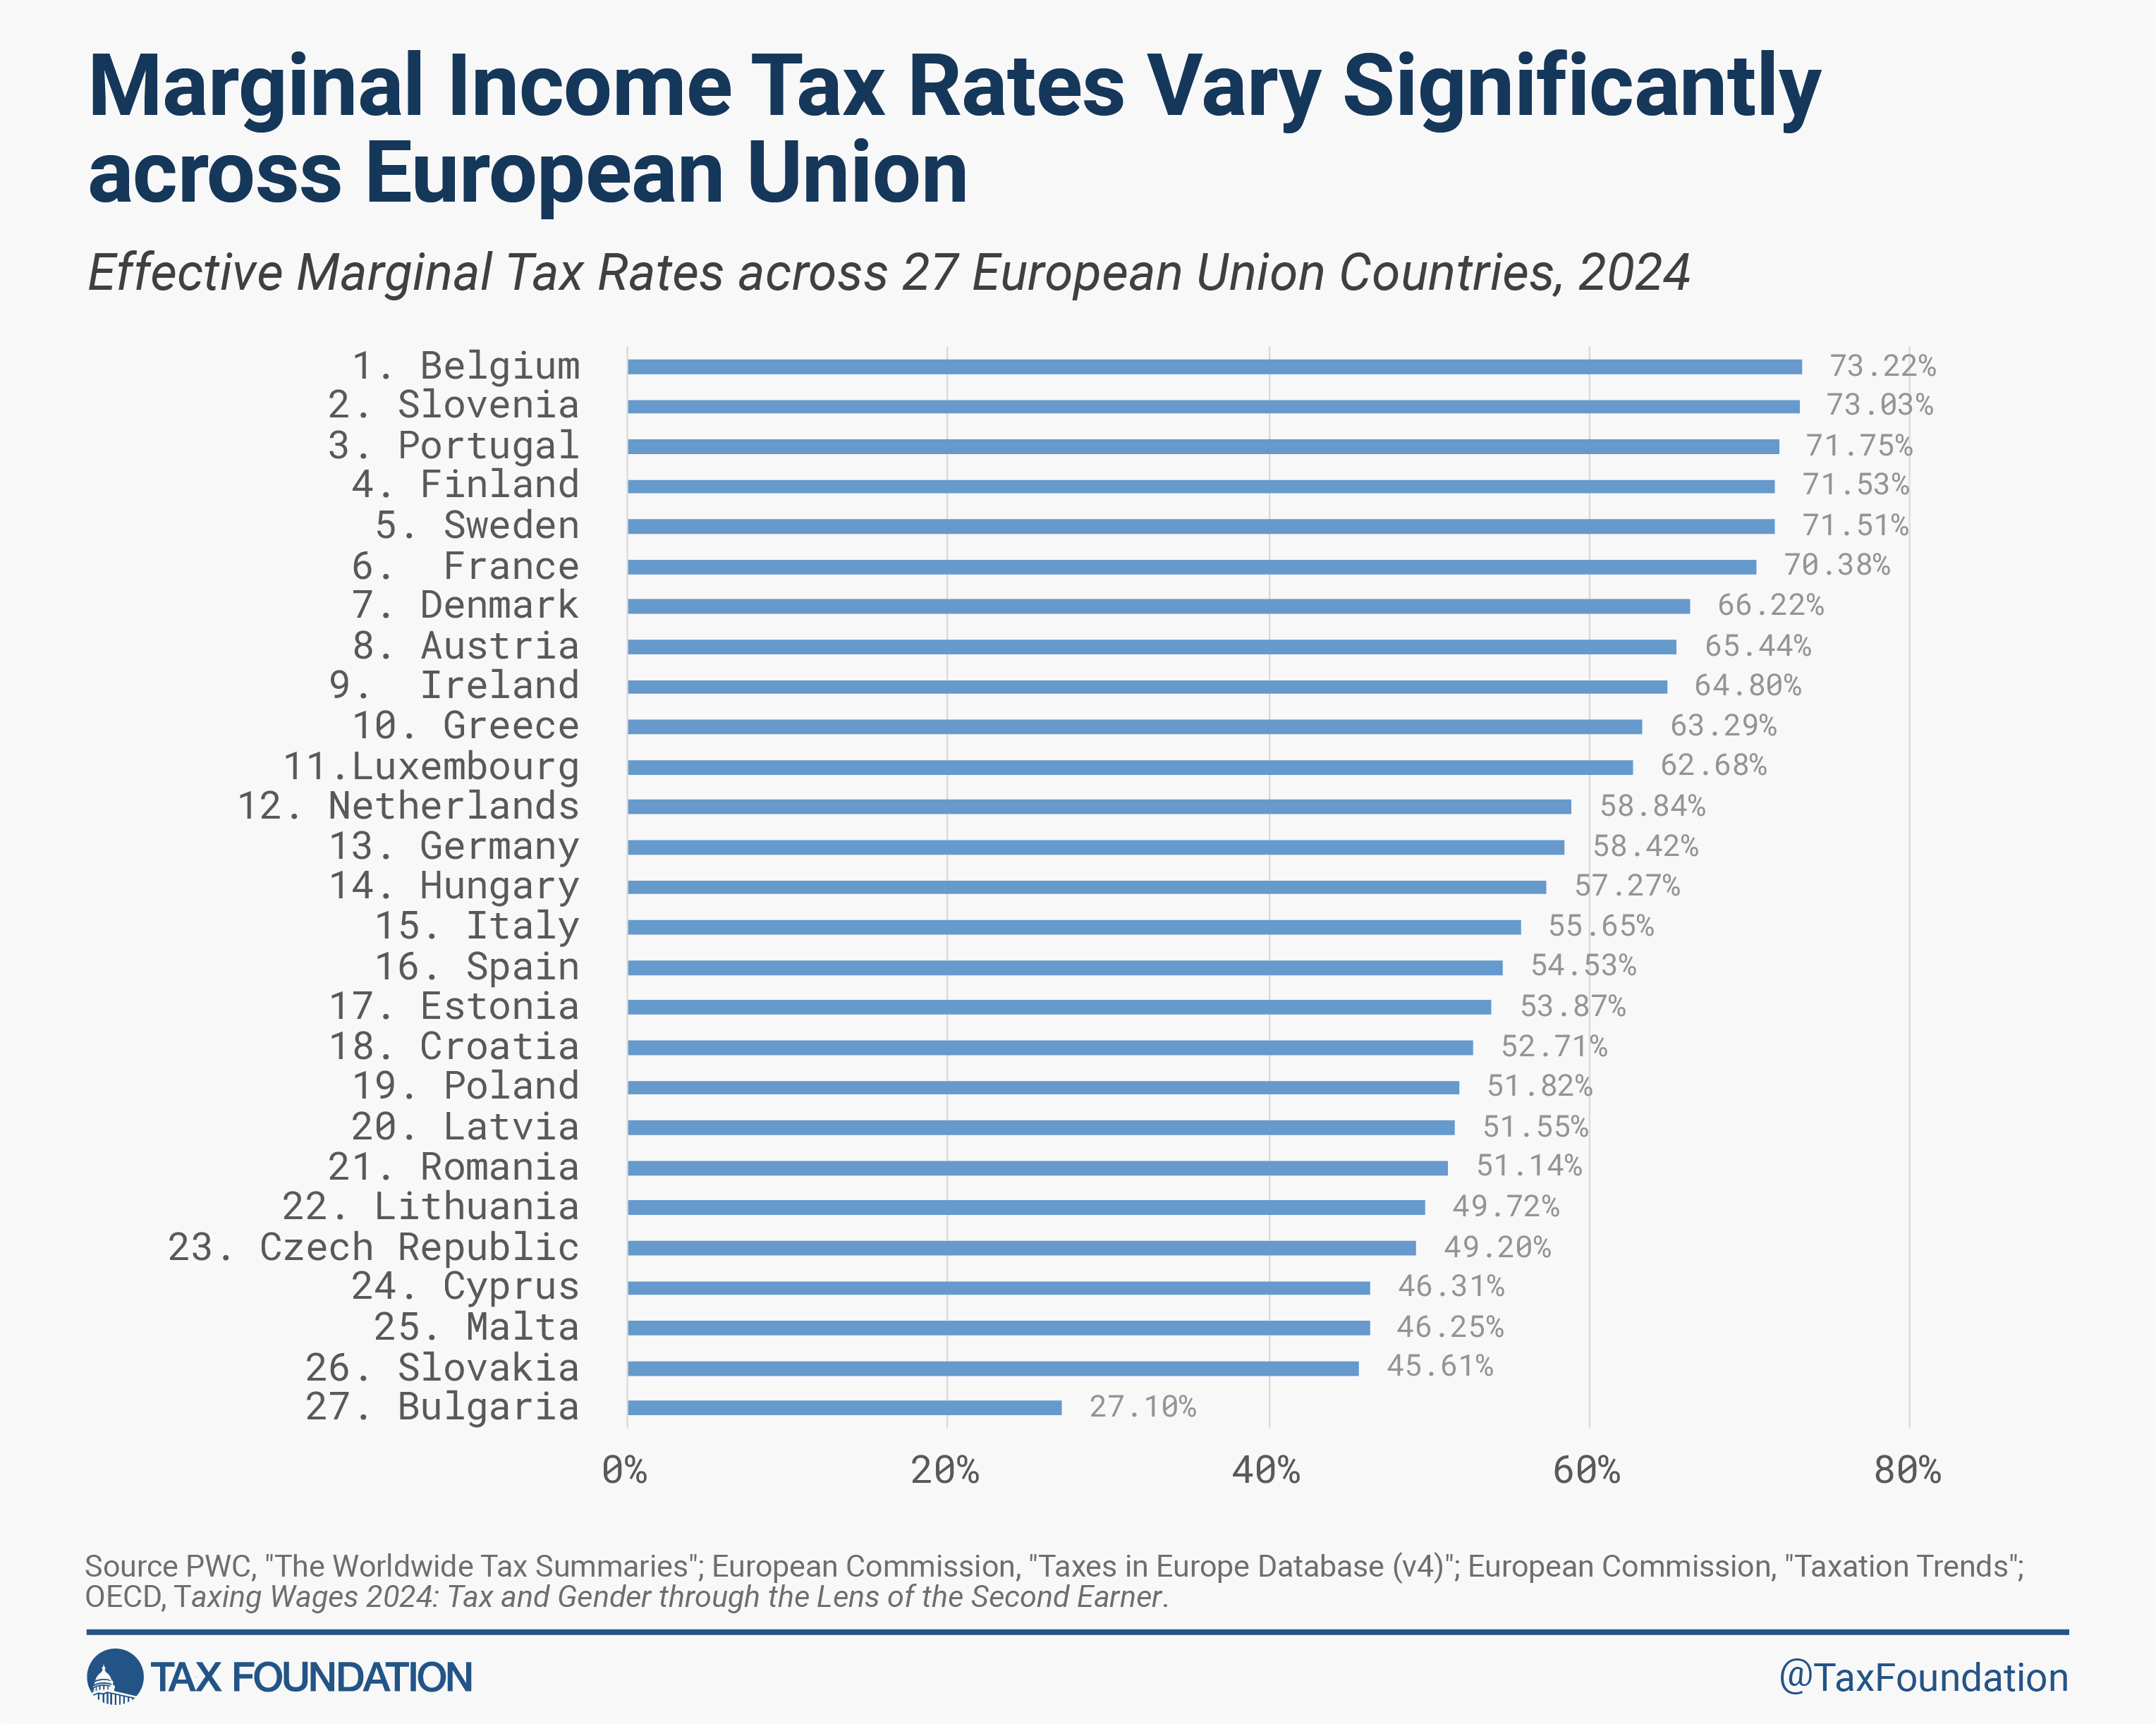
Both Table 1 and Figure 1 show the final data for the 27 countries of the European Union, in addition to the information on income taxes, employee social contributions, and payroll and consumption taxes that have been used for our final estimation of the results.[18] The first thing that stands out is the notable differences that can be found between countries.
For instance, Belgium (73.22 percent) and Bulgaria (27.10 percent) have a 46.12 percentage point gap, while the average EMTR for all Member States is 57.92 percent. This disparity shows the existence of very diverse fiscal policies within the EU, as individual nations tailor their tax structures to balance their need for revenues with the specific situations and characteristics of their local economies.
Effective marginal tax rates combine various tax components, including income tax, employee social contributions, payroll taxes, and consumption taxes. Our holistic approach provides a more accurate depiction of the tax burden on high-income earners than just looking at the top statutory tax rates. For instance, countries like Belgium and Slovenia, which appear at the higher end of the tax spectrum, implement a combination of high income and consumption taxes as well as substantial payroll and social contributions. This reflects a policy orientation toward very high progressive taxation.
Conversely, nations such as Bulgaria and Romania exhibit much lower effective rates, suggesting a different fiscal strategy that likely reflects the need to prioritize economic growth and competitiveness through lower taxation. This can attract foreign investment and high-skilled labor, although it also limits the government’s potential to fund public services extensively by focusing taxation on top earners.
The information, reflected in Table 1 and Figure 1, is pivotal for understanding the impact of tax policies on economic behavior, investment decisions, and social equity within Europe. It highlights the ongoing debate between ensuring economic dynamism and addressing income inequality through taxation, a balance that each country strikes in its unique context within the broader European framework.
Table 1. European Union Top-Bracket Tax Rates, in Percentages (2024)
| Country | Income Tax | Employee Social Contributions | Payroll Tax | Consumption Tax | Effective Marginal Tax Rate | ||
|---|---|---|---|---|---|---|---|
| Central and Regional/Local | Surtaxes | Deductible | Nondeductible | ||||
| Austria | 55 | 6.9 | 17.9 | 65.44 | |||
| Belgium | 52.9 | 13.1 | 27 | 16.9 | 73.22 | ||
| Bulgaria | 10 | 19 | 27.10 | ||||
| Croatia | 30 | 16.5 | 21.3 | 52.71 | |||
| Cyprus | 35 | 17.4 | 46.31 | ||||
| Czech Republic | 23 | 13.5 | 20 | 49.20 | |||
| Denmark | 52.07 | 8 | 23.4 | 66.22 | |||
| Estonia | 20 | 1.6 | 33.8 | 21.6 | 53.87 | ||
| Finland | 51.4 | 10.3 | 21.1 | 20.9 | 71.53 | ||
| France | 45 | 4 | 7.3 | 2.9 | 23 | 17.9 | 70.38 |
| Germany | 45 | 5.5 | 16 | 58.42 | |||
| Greece | 44 | 10 | 20.2 | 63.29 | |||
| Hungary | 15 | 18.5 | 20 | 22.9 | 57.27 | ||
| Ireland | 40 | 8 | 4 | 11 | 18.6 | 64.80 | |
| Italy | 47.2 | 16 | 55.65 | ||||
| Latvia | 23 | 8.09 | 14.5 | 19.5 | 51.55 | ||
| Lithuania | 32 | 6.98 | 17.6 | 49.72 | |||
| Luxembourg | 42 | 9 | 1.4 | 21.6 | 62.68 | ||
| Malta | 35 | 17.3 | 46.25 | ||||
| Netherlands | 49.5 | 18.5 | 58.84 | ||||
| Poland | 32 | 4 | 2.45 | 1.2 | 4.22 | 18 | 51.82 |
| Portugal | 48 | 5 | 11 | 23.8 | 16.4 | 71.75 | |
| Romania | 10 | 35 | 2.25 | 14.6 | 51.14 | ||
| Slovakia | 25 | 4 | 10.8 | 16.3 | 45.61 | ||
| Slovenia | 50 | 22.1 | 16.1 | 19.6 | 73.03 | ||
| Spain | 47 | 14.2 | 54.53 | ||||
| Sweden | 52 | 31.42 | 22 | 71.51 | |||
Fiscal Attractiveness for High-Income Earners, beyond Effective Marginal Tax Rates
It is important to understand the threshold at which the top marginal rate applies because it directly determines the income level at which the highest tax burden is incurred. This threshold influences the location and investment decisions of individuals and corporations seeking to optimize their tax liabilities. If the threshold is high, then high-income individuals can earn a significant amount before being subject to top marginal tax rates, potentially making a country more attractive to wealthy residents and stimulating economic activity and growth. Conversely, a lower threshold can lead to the more rapid application of high tax rates, discouraging the accumulation and retention of wealth and talent within a country and lowering its overall tax competitiveness.
Consider a simple example. Suppose Country A has a marginal tax rate of 50 percent that applies to all income over €100,000. In contrast, Country B applies the same 50 percent tax rate but only on income over €200,000. In this scenario, a high-income individual earning €250,000 would pay different amounts in taxes in each country due to the different thresholds:
- In Country A, the individual would pay 50 percent on €150,000 (the amount over €100,000), resulting in €75,000 in taxes.
- In Country B, the individual would pay 50 percent on €50,000 (the amount over €200,000), resulting in €25,000 in taxes.
Thus, Country B may be seen as more fiscally attractive to high-income earners because of its higher threshold at which the top marginal rate applies, allowing them to retain more of their income before hitting the top tax bracketA tax bracket is the range of incomes taxed at given rates, which typically differ depending on filing status. In a progressive individual or corporate income tax system, rates rise as income increases. There are seven federal individual income tax brackets; the federal corporate income tax system is flat. .
Now consider Country A with a top personal income tax rate of 20 percent, applied to all income over €10,000. This structure simplifies the tax system significantly because it essentially treats a vast majority of earners the same way, applying what is effectively a flat taxAn income tax is referred to as a “flat tax” when all taxable income is subject to the same tax rate, regardless of income level or assets. rate beyond a very low income threshold. This might ease administration and understanding of the tax code for taxpayers and the government alike.
On the other hand, Country B with a top rate that applies only to income over €1 million targets a much smaller, wealthier portion of the population. This requires a much higher top tax rate to raise the same amount of revenue as the flat rate system, given that fewer people fall into this category. This type of progressive system is aimed at equity, asking more from those who can afford to pay more, but it complicates the tax code and can lead to potential avoidance strategies by those affected.
Using the Tax Foundation’s International Tax Competitiveness Index (ITCI) as our reference, Country A, with its simpler tax system that applies a relatively low top tax rate of 20 percent starting from an income of €10,000, would score better in the rankings. This system, by applying a flat tax rate from a low threshold, simplifies the administration and understanding of the tax code significantly. Despite its broad application, this setup requires fewer high rates on high incomes to achieve the same level of revenue, effectively reducing the tax burden on higher earners and enhancing overall fiscal competitiveness. This simplicity could be viewed favorably on the ITCI because it efficiently raises revenue without excessively burdening any specific income group, aligning well with the principles of tax competitiveness that favor simplicity and broad-based levying.
Both tax systems exhibit distinct advantages and drawbacks. In Country B, where the top tax rate is applied only to incomes over €1 million, the system can be particularly attractive to high-income earners who earn around the high threshold as only a small portion of their income is taxed at the highest rate. This progressive structure, which lessens the tax burden on most of the population while targeting the wealthy, can be seen as promoting fairness and equity.
However, the downside of such a system lies in its complexity. Implementing multiple tax brackets introduces administrative challenges and complicates compliance, potentially leading to inefficiencies and encouraging tax avoidance strategies. This complexity can be a significant drawback for nations looking to streamline their tax systems and enhance the ease of doing business.
Given these considerations, an ideal tax system might involve a reduced tax rate combined with a broad tax base, approximating a flat tax. This approach minimizes the tax burden on high-income earners without overly complicating the tax code, promoting simplicity and efficiency in revenue collection. Such a system balances the need for fairness with the practical benefits of a straightforward tax structure, aiming to attract investment and stimulate economic activity while ensuring a fair contribution from all taxpayers.
In this section, in addition to presenting the income level at which the top marginal tax rate is applied, a comparison will be made between the tax wedgeA tax wedge is the difference between total labor costs to the employer and the corresponding net take-home pay of the employee. It is also an economic term that refers to the economic inefficiency resulting from taxes. on average income and that on high incomes. Marginal and average tax wedges are crucial indicators for understanding the tax burden on labor. The average tax wedge refers to the total percentage of taxes and social security contributions on employment taken from the average labor income of a worker, including both the taxes paid by the employee and those that are the responsibility of the employer. On the other hand, the marginal tax wedge describes the percentage of additional taxes and social security contributions applied to the last euro earned; that is, the additional tax paid on a marginal increase in income.
Analyzing the ratio between the marginal tax wedge and the average tax wedge is crucial as it reveals the progressivity of a tax system, indicating how additional income is taxed relative to average earnings. This comprehensive analysis provides a detailed view of how tax burdens are distributed across different income groups and highlights the fiscal pressure faced by average versus high-income earners in varying tax regimes.
These statistics serve as crucial benchmarks for understanding the competitiveness and simplicity of a tax system for high-income earners. By examining both the threshold for top tax rates and the comparative tax burden on different income levels, stakeholders can better assess the efficiency and equity of tax policies. This information is instrumental in evaluating whether a tax system is designed in a way that is attractive to high earners, potentially influencing their decisions to work, invest, and reside in a particular jurisdiction.
To produce the data on the income level from which the marginal tax rate is applied, several steps are necessary. First, the average full-time adjusted salary per employee is estimated from Eurostat. The formula to obtain the data is as follows:
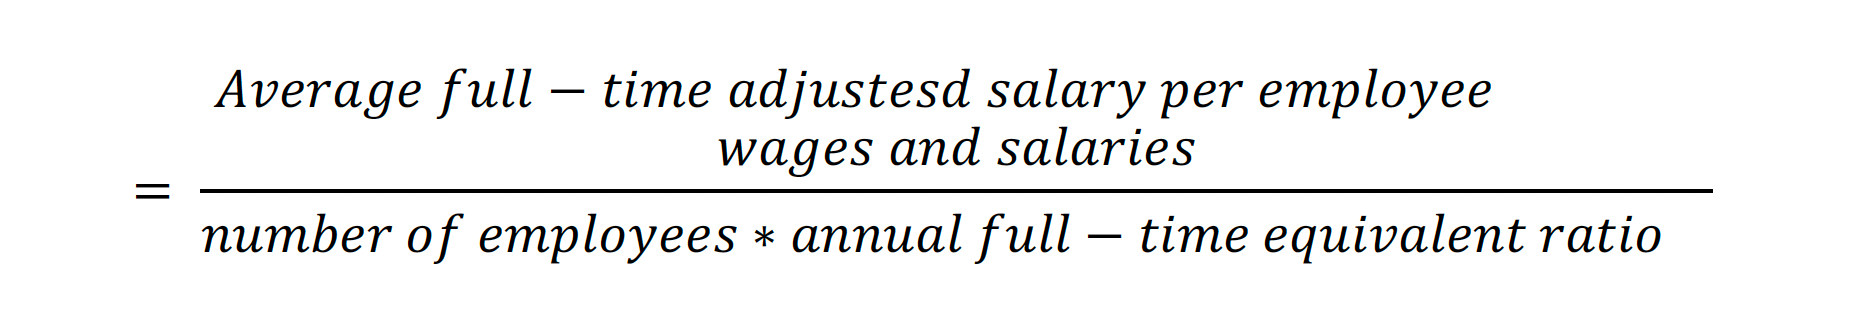
Then, through the sources consulted in the previous section, we obtain the income level from which the marginal rate is applicable.[20] Finally, we divide the average full salary adjusted with the level of the threshold to obtain the ratio of the top income tax rate threshold.
On the other hand, to measure the ratio of the marginal rate over the average tax wedge, we follow the strategy used by Mengden (2023).[21] From the OECD, we obtain the ratio of the marginal and average total tax wedges for four income levels for single persons without dependents. That is, we average the marginal total tax wedges at 67 percent, 100 percent, 144 percent, and 167 percent of median income divided by the average of the mean total median tax wedges for these same median income levels.[22]
In Europe, tax systems generally show a uniform appeal to individuals with high incomes, with certain exceptions. Only in countries such as Austria, France, and Spain are there a defined high-income threshold that is significantly higher than the average full salary, where the highest marginal tax rates start to apply. This places high-income earners at a relative disadvantage compared to those in the middle-income bracket. In contrast, nations like Bulgaria and Estonia utilize a flat tax system, where the same tax rate applies to all income levels, simplifying the tax structure and potentially offering a more equitable burden across different income scales. Meanwhile, countries like Denmark and Ireland, though not employing a flat tax, feature a small difference between the upper limit for high incomes and middle incomes. This results in a tax regime where the highest rates impact a broader portion of the population, thereby simplifying the system and potentially benefiting those with higher incomes by creating a relatively uniform tax impact across different income levels.
In the context of the 27 European Union countries, the ratio between the marginal tax wedge and the average tax wedge is a useful metric for comparing the progressivity of the tax system. An average ratio of 1.24 indicates that, on average, the tax on the last euro earned is 24 percent higher than the average tax on total wages. This can be interpreted as a sign of progressivity in the tax system, where higher incomes face higher marginal tax rates.
In terms of equity, a ratio closer to 1 is generally preferable. This means that the difference between what is paid on average and what is paid on the marginal income is smaller. When this ratio is close to 1, it suggests that the tax treatment is more uniform across different income levels, without disproportionately penalizing either low or high incomes. This is considered more equitable because it does not encourage tax evasion or aggressive tax planning and can contribute to a perception of greater fairness in society.
Although there are not many differences between countries in this measure, the slight variations may reflect significant differences in how each country structures its fiscal treatment towards higher incomes compared to middle and low incomes. The lower variability among countries suggests a certain convergence in fiscal policies within the European Union, which could indicate soft efforts to coordinate certain aspects of tax systems.
Table 2. Alternative Indicators to Measure Tax Attractiveness for High-Income Individuals
| Country | Top Income Tax Rate Threshold, as a Percentage of Average Wage | Ratio of Marginal to Average Tax Wedge |
|---|---|---|
| Austria | 19.67 | 1.14 |
| Belgium | 0.81 | 1.27 |
| Bulgaria | 0.00 | 1.00 |
| Croatia | 2.83 | 1.50 |
| Cyprus | 2.59 | 1.75 |
| Czech Republic | 3.06 | 1.12 |
| Denmark | 1.13 | 1.35 |
| Estonia | 0.26 | 1.11 |
| Finland | 1.80 | 1.31 |
| France | 11.92 | 1.25 |
| Germany | 6.00 | 1.11 |
| Greece | 2.40 | 1.27 |
| Hungary | 0.00 | 1.00 |
| Ireland | 0.71 | 1.42 |
| Italy | 1.59 | 1.29 |
| Latvia | 3.85 | 1.13 |
| Lithuania | 4.70 | 1.16 |
| Luxembourg | 2.93 | 1.37 |
| Malta | 2.08 | 1.40 |
| Netherlands | 1.43 | 1.43 |
| Poland | 1.79 | 1.13 |
| Portugal | 3.96 | 1.23 |
| Romania | 0.00 | 1.00 |
| Slovakia | 2.39 | 1.12 |
| Slovenia | 2.44 | 1.15 |
| Spain | 9.91 | 1.22 |
| Sweden | 1.14 | 1.27 |
The Implications of Progressivity and Taxes on High Incomes
Following up on Mengden’s publication, this section of the report presents a High-Income Tax Competitiveness Index (HTCI). The aim of this exercise is to provide a synthetic indicator showing the many distortions that can be found in the tax systems of EU Member States regarding their treatment of higher-income citizens. We take into account the distorting effect of said policies on aspects such as economic performance and entrepreneurial activity. This ranking utilizes three key indicators: marginal tax rates, tax wedge, and income threshold at which the highest marginal rate is applied.
The debate on fiscal equity and economic efficiency in Europe underscores the need for more sophisticated analytical tools that help us assess and compare tax burdens across different jurisdictions. Fiscal policies targeting high incomes are particularly contentious, as they often fail to balance the desire to raise additional revenue with the risk of discouraging investments and entrepreneurial activities that ultimately benefit everyone and also lead to higher tax collection as a result of continued growth. In this sense, the HTCI is proposed as a comprehensive measurement tool that helps describe how tax laws affect those at the upper end of the income scale.
The selected indicators are not arbitrary, but very critical components of the discussion on taxation and its effects. The marginal tax rate directly reflects the maximum tax burden imposed on the highest incomes, the tax wedge provides a measure of the total cost of taxation on labor (specifically the proportion of the tax wedge for high incomes relative to average incomes), and the income threshold for applying the highest marginal rate tells us how progressive the tax systems truly are, significantly impacting the residency and investment decisions of high-income individuals.
Moreover, this index seeks to fill a gap in the literature and the policy tools available, providing a comparative and empirical basis that can be used by policymakers, researchers, and analysts to assess the effectiveness of current fiscal policies and propose necessary adjustments. By incorporating these three indicators, the index offers a more comprehensive perspective on how high taxes can negatively impact competitiveness without necessarily achieving fiscal equity goals.
This effort to quantify and analyze is not only of academic interest; it also has significant practical implications. As European countries look for ways to strengthen their economies while maintaining fair and equitable tax systems, tools like the High-Income Tax Competitiveness Index will be crucial in balancing the goals of economic efficiency with ideals of redistribution.
To construct a comprehensive index that evaluates fiscal competitiveness in terms of high-income earners across European countries, a standardized and methodical approach was employed. The methodology included several key steps. This process aimed to quantify the distortive effects of tax systems on economic performance and entrepreneurial activity.[23]
The results revealed that Bulgaria led the index with a perfect score of 10 across all variables. This performance is closely followed by Romania and Hungary, with final scores of approximately 8.59 and 8.23, respectively, highlighting their relatively competitive fiscal environments for high-income earners. Slovakia and Estonia also showed strong performances, rounding out the top five with scores indicating lesser fiscal distortions compared to other European nations. These insights are instrumental for policymakers and economic analysts looking to understand and potentially reform the fiscal landscapes of their respective countries.
Table 3. High-Income Tax Competitiveness Index
| Country | Final Score | Final Rank | Effective Marginal Tax Rate | Top Income Tax Rate Threshold | Ratio of Marginal to Average Tax Wedge |
|---|---|---|---|---|---|
| Bulgaria | 10.00 | 1 | 27.10 | 0 | 1 |
| Romania | 8.59 | 2 | 51.14 | 0 | 1 |
| Hungary | 8.23 | 3 | 57.27 | 0 | 1 |
| Slovakia | 8.14 | 4 | 45.61 | 2.39 | 1.12 |
| Estonia | 7.99 | 5 | 53.87 | 0.26 | 1.11 |
| Czech Republic | 7.84 | 6 | 49.20 | 3.06 | 1.12 |
| Poland | 7.83 | 7 | 51.82 | 1.79 | 1.13 |
| Latvia | 7.56 | 8 | 51.55 | 3.85 | 1.13 |
| Lithuania | 7.43 | 9 | 49.72 | 4.7 | 1.16 |
| Malta | 7.13 | 10 | 46.25 | 2.08 | 1.4 |
| Italy | 7.05 | 11 | 55.65 | 1.59 | 1.29 |
| Germany | 6.93 | 12 | 58.42 | 6 | 1.11 |
| Greece | 6.56 | 13 | 63.29 | 2.4 | 1.27 |
| Slovenia | 6.42 | 14 | 73.03 | 2.44 | 1.15 |
| Netherlands | 6.37 | 15 | 58.84 | 1.43 | 1.43 |
| Denmark | 6.27 | 16 | 66.22 | 1.13 | 1.35 |
| Sweden | 6.25 | 17 | 71.51 | 1.14 | 1.27 |
| Croatia | 6.28 | 18 | 52.71 | 2.83 | 1.5 |
| Belgium | 6.20 | 19 | 73.22 | 0.81 | 1.27 |
| Ireland | 6.16 | 20 | 64.80 | 0.71 | 1.42 |
| Spain | 6.21 | 21 | 54.53 | 9.91 | 1.22 |
| Luxembourg | 6.16 | 22 | 62.68 | 2.93 | 1.37 |
| Finland | 6.02 | 23 | 71.53 | 1.8 | 1.31 |
| Portugal | 5.99 | 24 | 71.75 | 3.96 | 1.23 |
| Cyprus | 5.78 | 25 | 46.31 | 2.59 | 1.75 |
| France | 4.89 | 26 | 70.38 | 11.92 | 1.25 |
| Austria | 4.50 | 27 | 65.44 | 19.67 | 1.14 |
Does Higher Taxation Mean Less Inequality?
The argument that high tax rates are essential for reducing economic inequality rests on the principle of progressive taxation, where those with higher incomes are taxed at higher rates. This approach aims to redistribute wealth more evenly across society, theoretically leading to a reduction in the gap between the rich and the poor.
Advocates for higher tax rates believe that this can lead to a fairer society, where the wealth generated by the economy is shared more broadly. This discourse also suggests how higher taxes on the rich can benefit the rest with more revenue for investing in social services such as health care, education, and infrastructure.
The logic behind progressive taxation is based on the ability or capacity to pay. It argues that those with higher incomes can afford to contribute a larger percentage of their earnings without significantly compromising their living standards.
Also, high tax rates are increasingly seen as a tool to prevent the excessive accumulation of wealth among the elite, which is believed by some authors to lead to economic distortions and a concentration of power. By capping the growth of large fortunes, higher taxes are thought to prevent the wealthy from enjoying too much influence over political and economic systems. This is often justified as necessary to protect democracy and maintain an even playing field on the economic front.
But as a redistributive tool, the data reveal high taxes fall short. Despite the theoretical advantages of high tax rates, empirical evidence suggests that the actual impact on inequality reduction can be very limited.[24] High tax rates do not automatically equate to effective wealth redistribution or decreased inequality. This is because the effectiveness of tax policies in inequality reduction largely depends on how the tax revenue is utilized as well as the overall efficiency of the tax system, where we factor compliance levels or the administrative capacity to collect taxes.
High tax rates can sometimes lead to decreased economic incentives for investment and work, particularly when taxpayers feel that the tax burden is not equitably shared or that revenues are not properly or effectively used. This can result in lower economic growth, which ultimately harms the tax base needed for raising the resources that finance redistributive policies. Additionally, high tax rates directly encourage tax avoidance and evasion strategies, particularly among the wealthy, who have the means to find loopholes and can also move their wealth to lower-tax jurisdictions.
Furthermore, the notion that simply raising tax rates on the wealthy can lead to greater equality does not take into account the complexity of tax systems as well as the incentives said policies have on the economic behavior of the wealthiest taxpayers. For instance, if the tax structure is not adequately designed to avoid any type of loopholes, nominal rate increases might not lead to actual rate increases paid by high earners.[25] The effectiveness of taxes in reducing inequality also critically depends on the government’s ability to target spending toward programs that effectively promote equality.
Finally, it is essential to consider the economic context in which tax policies are implemented. High tax rates in one territory might not yield the same results in another, due to differences in economic conditions, asymmetries in the distribution of income, varying cultural attitudes toward taxation and public spending, etc. This highlights the importance of tailoring tax policies to specific national and regional contexts, rather than relying on high tax rates as a one-size-fits-all solution.
For this reason, it is entirely relevant to raise the question of whether a progressive system that taxes high incomes more heavily is the best way to correct inequalities. If the response is negative, it invalidates one of the main arguments for maintaining high marginal rates. In other words, it would be better to maintain a simple and competitive tax system with broad tax bases that do not generate disincentives to work, save, or invest.
This is precisely the question posed by Doerrenberg and Peichl in a sample of OECD countries, for which authors analyze economic results for the period between 1981 and 2005.[26] This research measures inequality-reducing efforts based on the different effects of its three main variables: government spending, social expenditure, and tax progressivity. Yet the question is not so simple to answer, since inequality can also influence governments’ tax and spending policies. This is the classic endogeneity problem. In any case, after taking all these circumstances into account, the results of this paper indicate that the effects of changes in tax progressivity are small and insignificant. In other words, the indirect distortionary effects dominate the direct effects of taxing higher incomes. In short, if the goal is to reduce inequality, governments should rely more on spending than on taxation.[27]
Although the present report focuses on income taxes, wealth taxes also play a role in countries’ efforts to mitigate inequality and levy taxes on the wealthiest individuals. Yet these levies also exhibit a limited capacity to effectively reduce economic inequalities.
Wealth taxation, including the existing Swiss model as well as different proposals that have being discussed in the United States (for instance, under Senator Elizabeth Warren’s tax plan) can create new sources of government revenue but ultimately have a minimal impact on wealth inequality statistics. Despite substantial projected revenues—from $189.3 billion in the case of the Swiss tax to $303.4 billion under Warren’s tax proposal—the changes in wealth inequality, as measured by the Gini coefficient, are negligible. For example, the maximum reduction in the Gini coefficient was only 0.0005 points. This minimal impact suggests that, while wealth taxes can generate new government resources, their effectiveness as a tool for reducing wealth inequality is tremendously limited.
While wealth taxes are a mechanism aimed at addressing inequality, the results discussed by Wolff (2019) indicate that their ability to do so effectively is limited, especially when compared to other measures that do have a more direct and significant impact on the distribution of wealth and incomes.[28] Therefore, policymakers should consider these findings when designing tax changes that explicitly target inequality reduction as a goal, because the actual redistributive impact that is often associated with wealth taxes will surely not meet expectations.
The exploration into the implications of high taxation on inequality reveals that, while the intent behind progressive taxation is to foster a more equitable society by redistributing wealth from the highest earners to the rest of the population, the effectiveness of such policies in actually reducing economic disparities remains very questionable. Although higher tax rates on the wealthy are designed to increase government revenue that can be invested in public goods and services, there are several challenges that ultimately diminish the impact of these policies, rendering them ineffective.
Among said challenges, we find that the administrative costs and complexities as well as the potential for increased tax avoidance among high earners significantly undermine the efficacy of higher taxation mechanisms. Individuals with higher incomes often have access to sophisticated financial advice and thus explore national and international options that enable them to minimize their tax liabilities, which can in turn lead to less effectiveness in the tax system as well as a reduced tax base.
Furthermore, high tax rates discourage investment and entrepreneurship, two elements that are critical for economic growth and job creation. The migration of wealth and talent in response to unfavorable tax conditions can therefore result in a decrease in potential revenue, thus limiting the capacity of tax policies to achieve any intended redistributive effects.
Moreover, the success of high taxation in curbing inequality also depends critically on the specific design of the tax system and how revenues are utilized. Effective redistribution requires not just collecting higher taxes, but also ensuring that the raised funds are properly and effectively directed toward government programs that do enhance equality, which is certainly not necessarily the case in many of today’s bloated social spending programs. Lack of strategic allocation and inefficiencies in government spending explain why even substantial revenues from high taxes do not necessarily lead to significant changes in social outcomes.
While progressive taxA progressive tax is one where the average tax burden increases with income. High-income families pay a disproportionate share of the tax burden, while low- and middle-income taxpayers shoulder a relatively small tax burden. policies are theoretically justified by the principles of equity and fiscal responsibility, their practical implementation must be meticulously designed to avoid economic distortions and to maximize their potential benefits. Ensuring the efficiency of tax collection, closing loopholes, and strategically directing tax revenues toward impactful social programs are essential steps in leveraging high taxation to genuinely reduce inequality.
Additionally, it is crucial to consider the macroeconomic effects of taxes on high incomes. The evidence shows that their elasticity is greater than 1, meaning that reductions in marginal rates can lead to increases in real GDP and decreases in unemployment.[29] Thus, a well-rounded fiscal strategy that combines rigorous tax policy design with a clear focus on economic stability and growth is essential for achieving equitable wealth distribution without compromising economic vitality.
Fiscal policies aimed at raising more revenues from high-income individuals often struggle to reach the goal of generating significant revenues, due to the adaptive strategies undertaken by those hit by said increases in taxation. These changes in economic behavior have negative effects on investment and entrepreneurship, which hurts the overall performance of the economy and ultimately hinders overall tax collections.
Very high taxes can undermine competitiveness and fail to achieve a significant impact on social indicators. Ultimately, if the objective is to curb inequality, governments must focus more on strategic spending that is targeted to meet this goal, rather than relying primarily on ineffective forms of taxation.
Moving Forward: Key Insights for the Debate on High Taxes
The popularity of imposing higher taxes on the wealthy seems to be growing. Initiatives across Europe, coming from advocacy groups and even some wealthy individuals themselves, reflect the push toward a cultural shift. These movements argue that progressive taxation is essential for addressing wealth inequality and adequately funding social programs that benefit all layers of society. This perspective is gaining traction, fueled by arguments that the current economic model benefits a few while a significant portion of the population sees little improvement in its standard of living.
This report highlights the significant drawbacks of such measures and their very limited potential for reducing economic disparities. Responses such as tax optimization strategies, tax evasion, or capital flight significantly undermine the potential revenue impact of higher taxes. These obstacles highlight the complex interplay between tax policy and economic behavior, suggesting that simply raising tax rates on the wealthy might not yield the intended social benefits.
Also, the potential negative impact of high marginal tax rates on investment and innovation is notable. High-income individuals and corporations are often the primary drivers of high-risk, high-reward investments that stimulate economic growth and innovation. Excessive taxation can deter these investments, leading to slower economic growth and reduced job creation. Therefore, it is crucial to strike a balance between encouraging economic dynamism and sustaining long-term growth.
The diversity in marginal tax rates across the EU presents an even more complicated scenario, with substantial variation impacting the decisions of high-income individuals regarding where to reside and invest. This diversity complicates any efforts toward fiscal harmonization, which fail to take into account each country’s unique economic landscape and the need for different approaches to taxation that come with heterogeneous economic structures.
The High-Income Tax Competitiveness Index introduced in this report offers a nuanced perspective on how tax policies influence economic performance and the attractiveness of countries to high-income earners. Nations with less distortive tax systems appear more attractive for these taxpayers. This ranking serves as a crucial tool for policymakers, helping them understand the broader impacts of tax policy and guiding their decision plans toward tax systems that are more conducive to economic growth and well-being.
According to the findings of the HTCI, Bulgaria, Romania, and Hungary rank as the top performers, showcasing their competitive tax environments that potentially offer favorable conditions for high-income earners. These countries demonstrate fewer tax distortions, which may encourage economic activity and attract investment. Conversely, countries like Belgium, France, and Austria appear at the bottom of the ranking, reflecting higher levels of tax distortion that deter economic dynamism and high-income residency due to more burdensome tax structures.
The theoretical goal of tax harmonization within the European Union is to mitigate economic inequalities and prevent the erosion of tax bases across different jurisdictions. However, uniformly higher tax burdens are likely to result, stifling economic initiative and reducing overall competitiveness. This highlights the complex reality of tax policies across Europe, which is ultimately the result of very diverse economic landscapes. Policymakers must carefully navigate these challenges to craft tax systems that do not sacrifice economic vitality.
The findings from this report suggest the necessity for a reevaluation of tax priorities and ongoing strategies in relation to high earners. Effective tax policies must consider the broader implications for economic incentives and growth. Policymakers are therefore encouraged to design tax systems that strike a proper balance between social goals and the realities of a market economy. In doing so, they can cultivate an environment that supports robust economic activity that leads to higher levels of progress and well-being.
Methodology
The steps followed for estimating the High-Income Tax Competitiveness Index are described below:
- The initial step involved standardizing each variable by computing z-scores. This statistical method measures the number of standard deviations a data point is from the mean of the dataset, normalizing the data across disparate scales and units. This normalization is crucial as it allows for an unbiased comparison between different tax-related metrics such as effective marginal tax rates, the income thresholds at which top marginal rates apply, and the ratio of the marginal to average tax wedge.
- Once the z-scores were calculated, they were inverted. This inversion was necessary because, in the context of fiscal competitiveness, a lower score (or a more negative z-score) is preferable, indicating a less distortive tax system. For the purpose of our index, negative z-scores were considered better, thus they were multiplied by -1 to align with the index’s scoring logic where higher scores indicate superior performance.
- Following the inversion, the scores were adjusted to eliminate any negative values. This adjustment involved identifying the lowest z-score, which was then negated and increased by one. This positive shift ensured that all scores were non-negative, with the lowest score set as the baseline at one. Subsequently, these scores were scaled relative to the best-performing country, to range from 0 to 10 points, further refining the competitiveness measure and ensuring its accessibility to broader audiences.
- The final score for each country was computed as the simple average of the three scaled scores. This averaging method consolidates the individual metrics into a single, comprehensive index value that reflects the overall fiscal competitiveness in relation to high incomes. Additionally, a ranking was derived from these final scores, providing a clear ordinal representation of where each country stands in comparison to others in the dataset.
Appendix
Appendix Table 1. High-Income Tax Competitiveness Index Scores
| Country | Final Score | Score Effective Marginal Tax Rate | Score Top Income Tax Rate Threshold | Score Ratio of Marginal to Average Tax Wedge |
|---|---|---|---|---|
| Bulgaria | 10.00 | 10.00 | 10.00 | 10.00 |
| Romania | 8.59 | 5.77 | 10.00 | 10.00 |
| Hungary | 8.23 | 4.69 | 10.00 | 10.00 |
| Slovakia | 8.14 | 6.74 | 9.00 | 8.69 |
| Estonia | 7.99 | 5.29 | 9.89 | 8.80 |
| Czech Republic | 7.84 | 6.11 | 8.72 | 8.69 |
| Poland | 7.83 | 5.65 | 9.25 | 8.58 |
| Latvia | 7.56 | 5.70 | 8.39 | 8.58 |
| Lithuania | 7.43 | 6.02 | 8.03 | 8.25 |
| Malta | 7.13 | 6.63 | 9.13 | 5.63 |
| Italy | 7.05 | 4.98 | 9.33 | 6.83 |
| Germany | 6.93 | 4.49 | 7.49 | 8.80 |
| Greece | 6.56 | 3.63 | 8.99 | 7.05 |
| Slovenia | 6.42 | 1.92 | 8.98 | 8.36 |
| Netherlands | 6.37 | 4.42 | 9.40 | 5.31 |
| Denmark | 6.27 | 3.12 | 9.53 | 6.18 |
| Sweden | 6.25 | 2.19 | 9.52 | 7.05 |
| Croatia | 6.28 | 5.49 | 8.81 | 4.54 |
| Belgium | 6.20 | 1.89 | 9.66 | 7.05 |
| Ireland | 6.16 | 3.37 | 9.70 | 5.42 |
| Spain | 6.21 | 5.17 | 5.85 | 7.60 |
| Luxembourg | 6.16 | 3.74 | 8.77 | 5.96 |
| Finland | 6.02 | 2.18 | 9.25 | 6.62 |
| Portugal | 5.99 | 2.14 | 8.34 | 7.49 |
| Cyprus | 5.78 | 6.62 | 8.91 | 1.81 |
| France | 4.89 | 2.39 | 5.01 | 7.27 |
| Austria | 4.50 | 3.25 | 1.76 | 8.47 |
Appendix Table 2. High-Income Tax Competitiveness Index Rankings
| Country | Final Rank | Marginal Tax Rate Rank | Top Income Tax Rate Threshold Rank | Rank Ratio of Marginal to Average Tax Wedge |
|---|---|---|---|---|
| Bulgaria | 1 | 1 | 1 | 1 |
| Romania | 2 | 7 | 1 | 1 |
| Hungary | 3 | 14 | 1 | 1 |
| Slovakia | 4 | 2 | 14 | 6 |
| Estonia | 5 | 11 | 4 | 4 |
| Czech Republic | 6 | 5 | 20 | 7 |
| Poland | 7 | 9 | 11 | 8 |
| Latvia | 8 | 8 | 21 | 9 |
| Lithuania | 9 | 6 | 23 | 12 |
| Malta | 10 | 3 | 13 | 23 |
| Italy | 11 | 13 | 10 | 19 |
| Germany | 12 | 15 | 24 | 5 |
| Greece | 13 | 18 | 15 | 18 |
| Slovenia | 14 | 26 | 16 | 11 |
| Netherlands | 15 | 16 | 9 | 25 |
| Denmark | 16 | 21 | 7 | 21 |
| Sweden | 17 | 23 | 8 | 17 |
| Croatia | 18 | 10 | 18 | 26 |
| Belgium | 19 | 27 | 6 | 16 |
| Ireland | 20 | 19 | 5 | 24 |
| Spain | 21 | 12 | 25 | 13 |
| Luxembourg | 22 | 17 | 19 | 22 |
| Finland | 23 | 24 | 12 | 20 |
| Portugal | 24 | 25 | 22 | 14 |
| Cyprus | 25 | 4 | 17 | 27 |
| France | 26 | 22 | 26 | 15 |
| Austria | 27 | 20 | 27 | 10 |
Stay informed on the tax policies impacting you.
Subscribe to get insights from our trusted experts delivered straight to your inbox.
Subscribe[1] Annette Alstadsæter, Sarah Godar, Panayiotis Nicolaides, and Gabriel Zucman, Global Tax Evasion Report 2024, EU Tax Observatory, 2023, https://www.taxobservatory.eu//www-site/uploads/2023/10/global_tax_evasion_report_24.pdf.
[2] Gustav Fritzon and Jacob Lundberg, “Taxing High Incomes: A Comparison of 41 Countries,” Timbro, Tax Foundation, and Epicenter, 2019, https://taxfoundation.org/wp-content/uploads/2019/10/Taxing-High-Income-A-Comparison-of-41-Countries-PDF.pdf.
[3] Isabel Saco, “Millonarios «orgullosos de pagar más» piden subir los impuestos a los ricos,” EuroEFE, Jan. 21, 2024, https://euroefe.euractiv.es/section/foro-economico-mundial/news/millonarios-orgullosos-de-pagar-mas-piden-subir-impuestos-a-los-ricos/.
[4] Annette Alstadsæter, Sarah Godar, Panayiotis Nicolaides, and Gabriel Zucman, Global Tax Evasion Report 2024, EU Tax Observatory, 2023, https://www.taxobservatory.eu//www-site/uploads/2023/10/global_tax_evasion_report_24.pdf.
[5] Annette Alstadsæter, Sarah Godar, Panayiotis Nicolaides, and Gabriel Zucman, Global Tax Evasion Report 2024, EU Tax Observatory, 2023, https://www.taxobservatory.eu//www-site/uploads/2023/10/global_tax_evasion_report_24.pdf.
[6] Santo Milasi and Robert J. Waldmann, “Top Marginal Taxation and Economic Growth,” Applied Economics 50:19 (2018): 2156-2170, https://doi.org/10.1080/00036846.2017.1392001.
[7] Ufuk Akcigit, Salomé Baslandze, and Stefanie Stantcheva, “Taxation and the International Mobility of Inventors,” American Economic Review 106:10 (October 2016): 2930-2981, https://doi.org/10.1257/aer.20150237.
[8] Henrik J. Kleven, Camille Landais, and Emmanuel Saez, “Taxation and International Migration of Superstars: Evidence from the European Football Market,” American Economic Review 103:5 (August 2013): 1892-1924, https://doi.org/10.1257/aer.103.5.1892.
[9] Mathilde Muñoz, “Do European Top Earners React to Labour Taxation Through Migration?,” Paris School of Economics, Working Paper No. 35 (June 2021), https://shs.hal.science/halshs-03252899/document
[10] Henrik J. Kleven, Camille Landais, Emmanuel Saez, and Esben Schultz, “Migration and Wage Effects of Taxing Top Earners: Evidence from the Foreigners’ Tax Scheme in Demark,” The Quarterly Journal of Economics 129:1 (February 2014): 333-378, https://doi.org/10.1093/qje/qjt033.
[11] Arun Advani, David Burgherr, and Andy Summers, “Taxation and Migration by the Super-Rich,” IZA DP 16432 (September 2023), https://docs.iza.org/dp16432.pdf.
[12] David R. Agrawal and Dirk Foremny, “Relocation of the Rich: Migration in Response to Top Tax Rate Changes from Spanish Reforms,” SSRN (April 2018), https://papers.ssrn.com/sol3/papers.cfm?abstract_id=2796472.
[13] For a further discussion of this problem, see Oliver Hümbelin and Rudolf Farys, “Income Redistribution through Taxation: How Deductions undermine the Effect of Taxes,” Journal of Income Distribution 26:1 (2017): 1-35, https://doi.org/10.25071/1874-6322.40330.
[14] Eduardo B. Moliné, “Gasto Social, Redistribución y Desigualdad,” Papeles de Economía Española 147 (2016): 128-144, https://www.funcas.es/wp-content/uploads/Migracion/Articulos/FUNCAS_PEE/147art08.pdf.
[15] Gustav Fritzon and Jacob Lundberg, Taxing high incomes: A comparison of 41 countries, Timbro, Tax Foundation, and Epicenter, 2019, https://taxfoundation.org/wp-content/uploads/2019/10/Taxing-High-Income-A-Comparison-of-41-Countries-PDF.pdf.
[16] Specifically, the following sources have been consulted and double-checked:
- PWC, The Worldwide Tax Summaries.
- European Commission, Taxes in Europe Database (v4).
- European Commission, Taxation Trends.
- OECD, Taxing Wages.
[17] Julio López, Carmen Marín, and Jorge Onrubia, “Observatorio sobre el reparto de los impuestos y las prestaciones entre los hogares españoles,” FEDEA, 2024, https://www.fedea.net/observatorio-sobre-el-reparto-de-los-impuestos-y-las-prestaciones-entre-los-hogares-espanoles/.
[18] For additional information on the steps followed for a particular country, you can refer to Fritzon and Lundberg (2019) and/or request it from the authors of this report.
[19] The annual full-time equivalent (FTE) ratio is calculated as the usual weekly hours for full-time employees divided by the usual weekly hours for all employees.
[20] It should be noted that in countries with a flat tax, the income level to which the marginal tax rate is applied is 0, except in the case of Estonia, since there is an exempt minimum of €6,000 that serves as a limit for the purposes of these calculations.
[21] Alex Mengden, International Tax Competitiveness Index 2023, Tax Foundation, 2023. https://taxfoundation.org/wp-content/uploads/2023/10/TF-ITCI23-Book_16-10_FV.pdf.
[22] For Bulgaria, Croatia, Cyprus, Malta, and Romania, the steps followed are different, as the OECD does not provide estimates for these countries. In these cases, the level of income tax applied for an average wage has been substituted in the estimates of the effective marginal tax rate to obtain the average tax wedge. For the marginal tax wedge, the marginal income tax rate obtained in the previous section is used.
[23] See the methodology section for a more detailed description.
[24] Mercedes Serraller, “Madrid es la comunidad que más reduce la desigualdad con el IRPF,” VozPopuli, Feb. 18, 2022, https://www.vozpopuli.com/economia_y_finanzas/madrid-irpf-desigualdad.html.
[25] Arthur B. Laffer, Brian Domitrovic, and Jeanne C. Sinquefield, Taxes Have Consequences: An Income Tax History of the United States (New York City: Post Hill Press, 2022).
[26] Philipp Doerrenberg and Andreas Peichl, “The impact of redistributive policies on inequality in OECD countries,” Applied Economics 46:17 (March 2014): 2066-2086, https://doi.org/10.1080/00036846.2014.892202.
[27] For additional information, see the Instituto de Estudios Económicos analysis which confirms that, for Spain, 86% of inequality is explained by the evolution of the labor market, available at: https://www.ieemadrid.es/wp-content/uploads/IEE-Informe-Sept.-2021.-Empresa-igualdad-de-oportunidades-y-progreso-social-1.pdf. Also, for Spain, Bernardo de Quirós and Gómez analyze the efficiency of the public sector and conclude that public spending could be 10 percentage points of GDP lower by reducing the waste of public resources: Lorenzo Bernaldo de Quirós and María Gómez, Un Estado caro, ineficaz e ineficiente (Madrid: Instituto de Estudios Económicos, 2022), 91-135. These two studies confirm that inequality is a problem of economic efficiency and not so much of the need to increase distortionary taxes.
[28] Edward N. Wolff, “Wealth Taxation in the United States,” National Bureau of Economic Research 26544 (December 2019), https://doi.org/10.3386/w26544.
[29] Karel Mertens and José Luis Montiel Olea, “Marginal Tax Rates and Income: New Time Series Evidence,” The Quarterly Journal of Economics 133:4 (November 2018): 1803-1884, https://www.doi.org/10.1093/qje/qjy008.
Share