Recently, the Internal Revenue Service (IRS) published its annual Country-by-Country Report, providing detailed statistics on profits and taxes of multinational enterprise groups headquartered in the U.S. by major geographic region and taxing jurisdiction. This data provides important information on a subset of U.S. multinationals that can inform the ongoing debate on the taxation of multinational corporations.
The data in the Country-by-Country Report is based on Form 8975 and Schedule A, filed by U.S. corporations and partnerships. This data is collected for U.S. multinational enterprise groups that had annual revenues of $850 million or more in the preceding reporting period. In taxA tax is a mandatory payment or charge collected by local, state, and national governments from individuals or businesses to cover the costs of general government services, goods, and activities. year 2017, there were more than 35,000 sub-groups included in the report.
Table 3 of the report is of particular interest as it provides the effective tax rates of subsidiaries of large U.S. corporations. Of the 35,008 subsidiaries included in the report, 1,600 (or 4.6 percent) reported having a positive profit but accruing a negative income tax liability. An additional 11,055 subsidiaries reported zero or negative profits, accounting for another 31.6 percent of the sub-groups in the report. On the other hand, more than 2,600 (or 7.6 percent) reported an effective tax rate of more than 50 percent.
|
Source: Internal Revenue Service, “Table 3: Country-by-Country Report (Form 8975): Tax Jurisdiction Information (Schedule A: Part I) by Effective Tax Rate of Multinational Enterprise Sub-groups, Tax Year 2017.” |
|||
| Effective tax rate (ETR) of reporting multinational enterprise (MNE) sub-group | Number of reporting multinational enterprise sub-groups | Profit (loss) before income tax (billions) | Income tax accrued – current year (billions) |
|---|---|---|---|
| Negative or zero profit | 11,055 | $(377.2) | $10.3 |
| Negative income tax accrued and positive profit | 1,598 | $254.0 | $(20.6) |
| ETR less than 5% | 5,586 | $886.4 | $7.4 |
| ETR of 5% to less than 15% | 2,989 | $371.8 | $35.9 |
| ETR of 15% to less than 25% | 4,489 | $298.8 | $58.8 |
| ETR of 25% to less than 35% | 4,188 | $318.6 | $95.8 |
| ETR of 35% to less than 50% | 2,429 | $145.2 | $58.7 |
| ETR of 50% or greater | 2,674 | $124.5 | $129.9 |
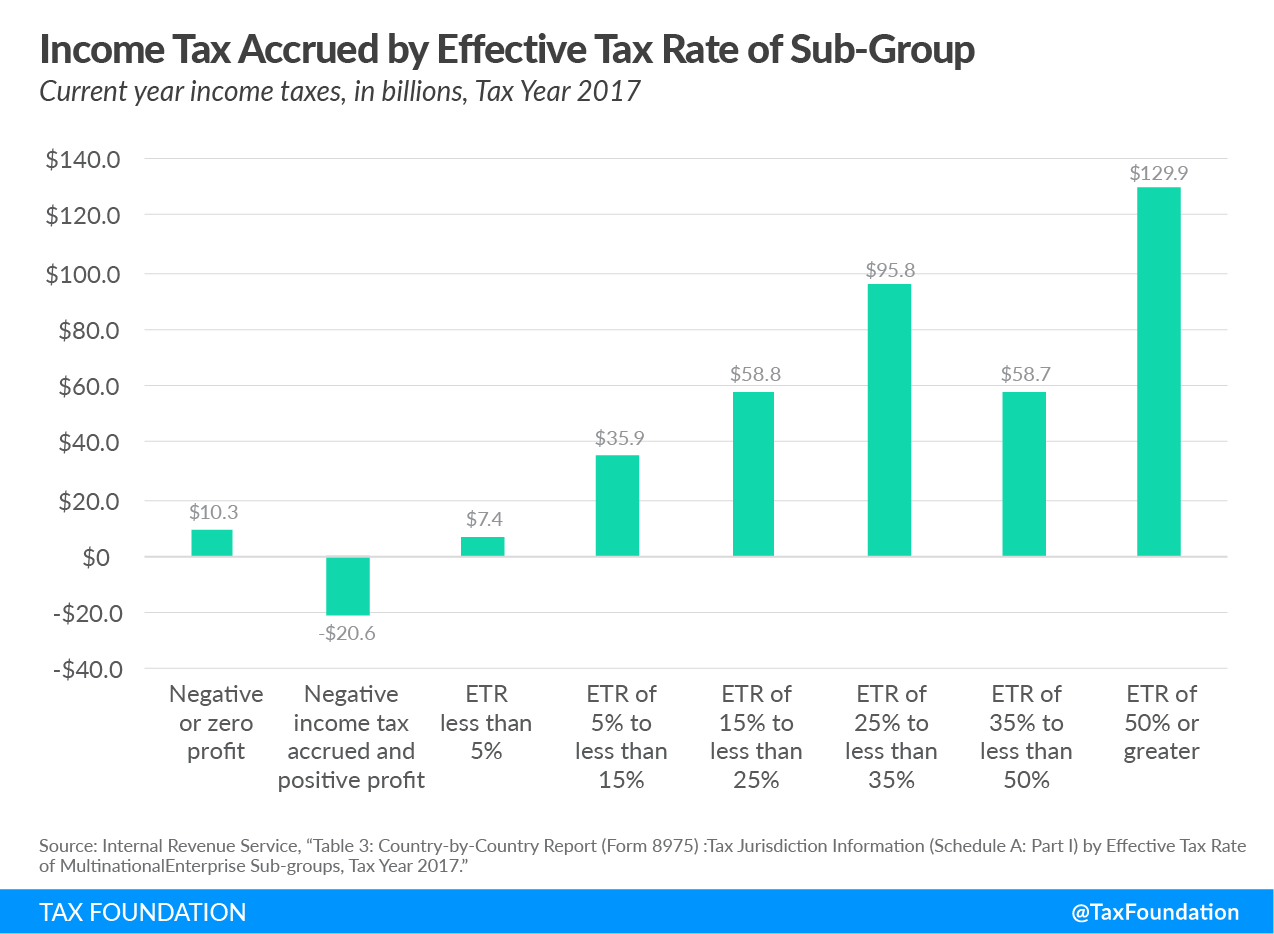
Figure 1 illustrates the total income tax liability accrued by subsidiaries in each ETR category. An interesting observation here is that while subsidiaries with positive profits but negative income tax accrued a total negative tax bill of $20.6 billion, subsidiaries with negative or zero profit accrued a positive tax bill of $10.3 billion. Ultimately, we do not know whether these subsidiaries owed taxes or received refunds because we do not know their tax liability in their jurisdiction of operation, but information like this does raise the question of what country gets to tax these businesses and on what profits. Some drivers of these lower effective tax rates could be deductions for new investments, loss carryforwards, or low tax rates in the jurisdiction of operation.
In addition to the data presented above, the report also breaks these statistics down by major geographic region and selected tax jurisdiction. For example, from Table 4 of the report we learn that 3,761 of the 11,055 subsidiaries with negative or zero profit were located in Europe; zooming in even further we can see that 186 of that 3,761 were located in France. Table 2 below displays the major geographic region for the subsidiaries that reported positive profit and negative income tax.
|
Source: Internal Revenue Service, “Table 4: Country-by-Country Report (Form 8975): Tax Jurisdiction Information (Schedule A: Part I) by Effective Tax Rate of Multinational Enterprise Sub-groups, Major Geographic Region, and Selected Tax Jurisdiction, Tax Year 2017.” |
|||
| Major Geographic Region | Number of reporting multinational enterprise sub-groups | Profit (loss) before income tax (billions) | Income tax accrued – current year (billions) |
|---|---|---|---|
| United States | 115 | $162.2 | -$16.5 |
| Stateless entities and other country | 23 | $31.8 | -$0.1 |
| Africa, total | 79 | $1.0 | -$0.2 |
| Americas, total | 318 | $9.9 | -$1.2 |
| Asia & Oceania, total | 437 | $8.0 | -$1.1 |
| Europe, total | 626 | $41.1 | -$1.6 |
| TOTAL MNE sub-groups with negative income tax accrued and positive profit | 1598 | $254.0 | -$20.6 |
As my colleague Daniel Bunn explains:
Businesses that operate in more than one country are often able to optimize their tax burden by shifting profits from high-tax jurisdictions to low-tax jurisdictions. This profit-shifting behavior can have an impact on an individual country’s tax revenues, but it can also provide a setting in which some businesses invest more (even in high-tax jurisdictions) than they otherwise would. Efforts to measure the revenue loss due to profit-shifting behavior have established a range of estimates.
The data included in the Country-by-Country Report provides important context for ongoing efforts to stymie profit shifting and reform the taxation of multinational corporations by showing U.S. taxes paid by U.S. parented subsidiaries across the globe. For example, the majority (70 percent) of the nearly 24,000 sub-groups with positive profits had an effective tax rate of 5 percent or more, accruing income taxes of more than $378 billion. However, as noted above, this data doesn’t provide a complete picture of how much this group of multinational businesses pay in taxes as it does not include what may be owed to other jurisdictions.
As debate continues on how to reform the taxation of multinational businesses, countries should keep in mind the trade-offs inherent in a global approach. As explained by Bunn, “A global approach to corporate income taxation would likely undermine the sovereignty countries currently have to determine how they tax corporate income, and it would directly stymie the competition among countries to design tax systems to promote growth and minimize the distortionary effects of corporate taxation.”
Share this article