Scott Hodge mentioned something earlier today that might seem hard to believe, especially for readers of the Washington Post: “about 96 percent of all taxpayers have a lower average tax rateThe average tax rate is the total tax paid divided by taxable income. While marginal tax rates show the amount of tax paid on the next dollar earned, average tax rates show the overall share of income paid in taxes. than Romney”. More precisely, in 2010, somewhere between 90 and 95 percent of Americans had a lower effective income taxA tax is a mandatory payment or charge collected by local, state, and national governments from individuals or businesses to cover the costs of general government services, goods, and activities. rate than Romney’s 13.9 percent. In 2011, somewhere between 95 and 97 percent of Americans had a lower effective income tax rate than Romney’s 15.4 percent, at least according to the latest IRS data from 2010.
The table and chart below shows the latest IRS data on filers and their effective income tax rates. In total, there were about 143 million filers in 2010. Adding the 13 million non-filers, as estimated by Emmanual Saez, brings the total “tax unit” population to about 156 million.
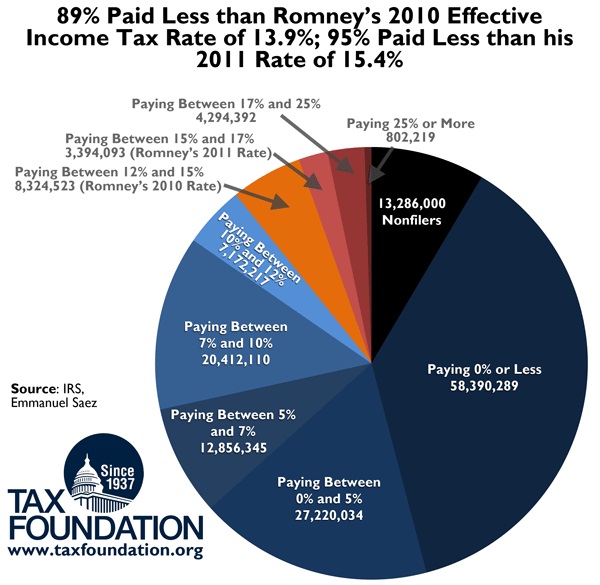
More than 58 million filers were nonpayers, i.e. they had zero or negative federal income tax liability. Therefore, including the non-filers, more than 71 million Americans paid no federal income taxes in 2010, representing about 46 percent of the population.
Another 27 million, or 17 percent of the population, had an effective income tax rate of between zero and 5 percent. Over 89 percent of Americans had an effective income tax rate of less than 12 percent, 95 percent had a tax rate of less than 15 percent, and fully 97 percent of Americans had a tax rate of less than 17 percent. Therefore, the vast majority of Americans pay less than Romney’s 2010 rate of 13.9 percent or his 2011 rate of 15.4 percent.
|
Nonfilers and Filers by Effective Tax Rate, 2010 |
|||
|
Returns |
Share of Filers |
Share of Filers+NonFilers |
|
|
Filers paying 0% or less (nonpayers) |
58,390,289 |
40.87% |
37.39% |
|
Filers paying between 0% and 5% |
27,220,034 |
19.05% |
17.43% |
|
Filers paying 5% to almost 7% |
12,856,345 |
9.00% |
8.23% |
|
Filers paying 7% to almost 10% |
20,412,110 |
14.29% |
13.07% |
|
Filers paying 10% to almost 12% |
7,172,217 |
5.02% |
4.59% |
|
Filers paying 12% to almost 15% |
8,324,523 |
5.83% |
5.33% |
|
Filers paying 15% to almost 17% |
3,394,093 |
2.38% |
2.17% |
|
Filers paying 17% to almost 25% |
4,294,392 |
3.01% |
2.75% |
|
Filers paying 25% to almost 30% |
722,992 |
0.51% |
0.46% |
|
Filers paying 30% to almost 50% |
70,475 |
0.05% |
0.05% |
|
Filers paying 50% to almost 100% |
1,229 |
0.00% |
0.00% |
|
Filers paying 100% or more |
7,523 |
0.01% |
0.00% |
|
Total Filers |
142,866,222 |
100.00% |
91.49% |
|
Non-filers |
13,286,000 |
|
8.51% |
|
Total Filers + Non-filers (tax units) |
156,152,222 |
|
100.00% |
|
Tax units paying less than 12% |
139,336,995 |
|
89.23% |
|
Tax units paying less than 15% |
147,661,518 |
|
94.56% |
|
Tax units paying less than 17% |
151,055,611 |
|
96.74% |
|
Source: IRS, Emmanuel Saez |
Follow William McBride on Twitter @EconoWill
Share this article