The OECD’s new database Corporate Tax Statistics provides insights into the recent history and current state of corporate income taxes (CIT) around the world. The database includes information on a variety of measures of corporate taxation including statutory taxA tax is a mandatory payment or charge collected by local, state, and national governments from individuals or businesses to cover the costs of general government services, goods, and activities. rates, marginal and average effective tax rates, the cost of capital for different investments, and the net present value of capital allowances.
The data shows that while statutory CIT rates have decreased significantly across the covered 88 jurisdictions since 2000, average corporate tax revenues both as a percentage of total tax and as a percentage of GDP have increased slightly. Declines in the statutory CIT rates have been seen in every major region of the world. Our own research has shown similar declines across a broader set of jurisdictions.
Research by the OECD has found that corporate taxes are the most harmful form of taxation for economic growth.
Corporate Tax Revenues
In 2016, on average across the 88 jurisdictions covered in the database, CIT revenue as a percentage of total tax revenue was 13.3 percent, and CIT revenue as a percentage of GDP was 3.0 percent. Between 2000 and 2016, there was a slight increase in both CIT revenue as a share of total tax revenue (1.3 percent) and as a share of GDP (0.3 percent).
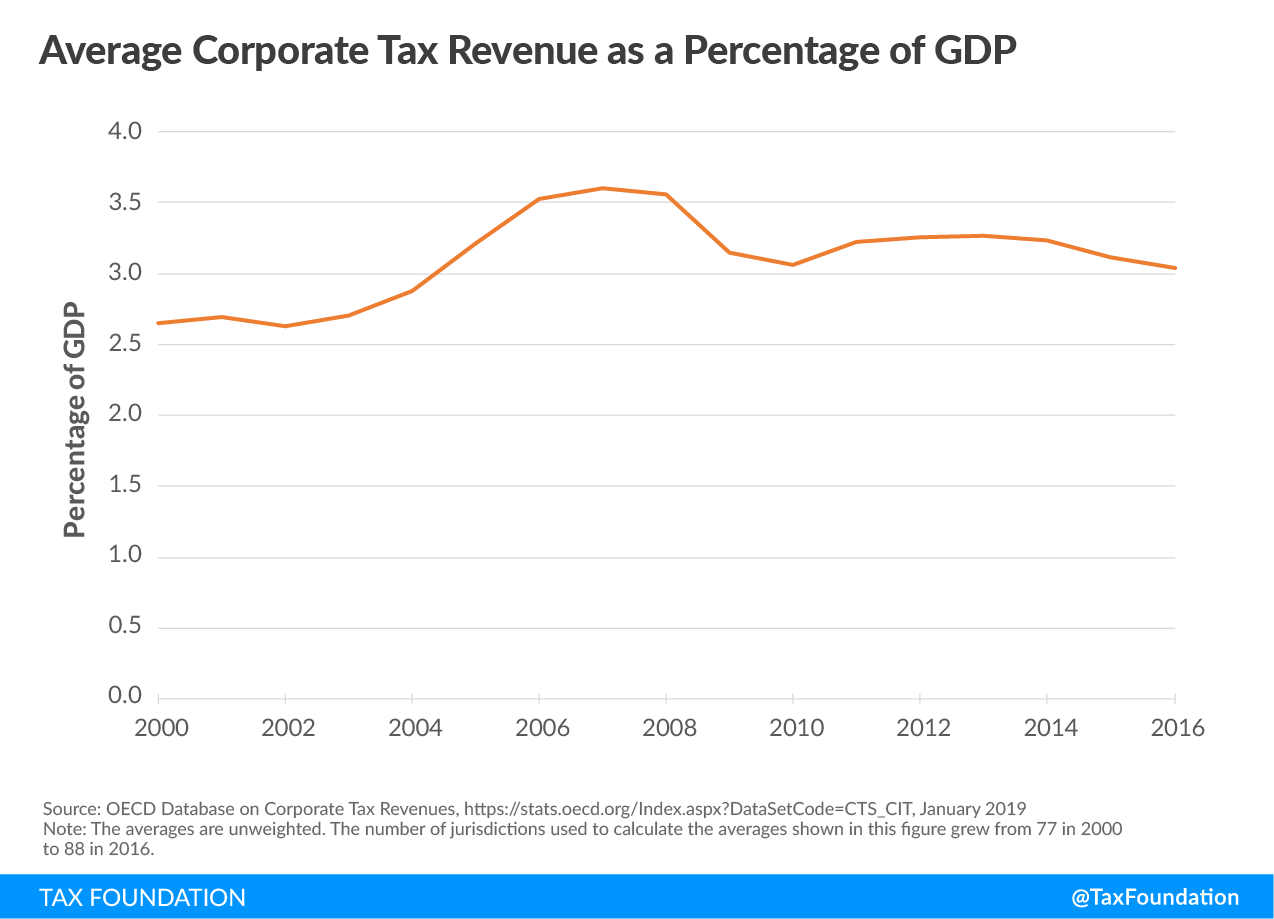
Groupings of jurisdictions show substantial differences across regions. CIT revenues tend to be particularly important in developing countries. While CIT revenue accounted for 15.3 percent of total tax revenue in African jurisdictions and 15.4 percent in Latin American and Caribbean (LAC) jurisdictions in 2016, the OECD average was 9 percent.
Statutory Corporate Income TaxA corporate income tax (CIT) is levied by federal and state governments on business profits. Many companies are not subject to the CIT because they are taxed as pass-through businesses, with income reportable under the individual income tax. Rates
Declines in statutory CIT rates have been seen in every region of the world. While the average statutory CIT rate for the jurisdictions in the OECD dataset was 28.6 percent in 2000, this decreased to 21.4 percent in 2018. In 2018, Australia and New Zealand was the region with the highest average statutory CIT rate (29.0), followed by North America (27.5), Africa (27.1), Europe (19.9), Asia (18.9), and LAC (17.3).
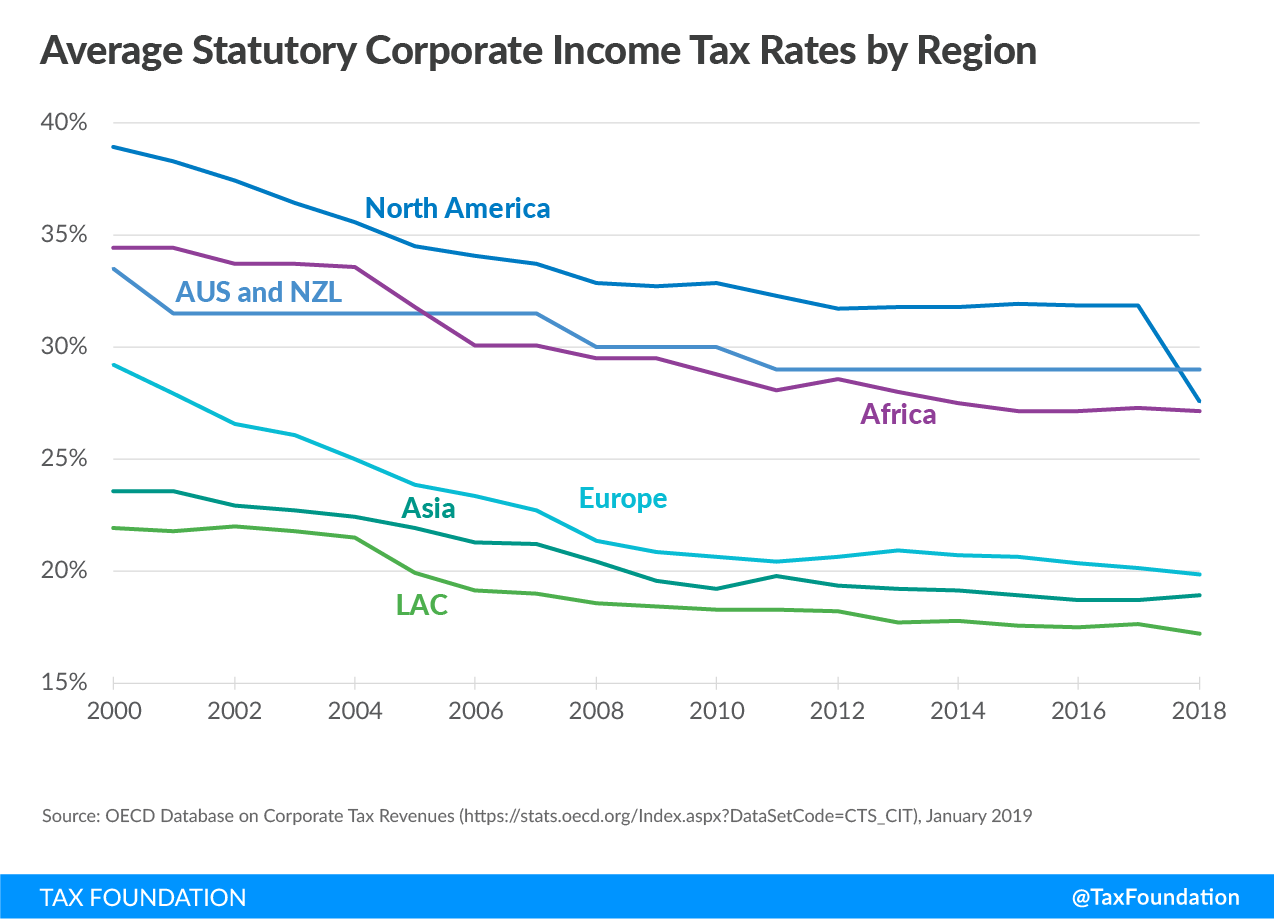
Between 2017 and 2018, the jurisdiction with the largest reduction in the combined statutory CIT rate was the United States with a decrease of 13 percentage points. The combined statutory CIT is now 26 percent in the United States.
Corporate Effective and Marginal Tax Rates
As opposed to the statutory CIT rate, the corporate effective average tax rateThe average tax rate is the total tax paid divided by taxable income. While marginal tax rates show the amount of tax paid on the next dollar earned, average tax rates show the overall share of income paid in taxes. (EATR) provided in the OECD database captures provisions such as capital depreciation rules and other allowances and deductions. DepreciationDepreciation is a measurement of the “useful life” of a business asset, such as machinery or a factory, to determine the multiyear period over which the cost of that asset can be deducted from taxable income. Instead of allowing businesses to deduct the cost of investments immediately (i.e., full expensing), depreciation requires deductions to be taken over time, reducing their value and discouraging investment. rules are important because they, if poorly designed, inflate taxable profits by not allowing businesses to fully deduct the cost of investments. The EATR across the 74 covered jurisdictions in 2017 (20.5 percent) is 1.1 percentage points lower than the average statutory CIT rate (21.6 percent). Most jurisdictions provide some degree of accelerated depreciation; only a few have tax depreciation rules that reduce allowances for capital investment relative to the standard formula. In 2017, the United States and India were the jurisdictions with the largest discrepancy between the statutory CIT rate and the EATR (4.8 percentage points in the United States and 3.8 percentage points in India).
Effective marginal tax rates (EMTR) calculated by the OECD reflect the extent to which taxation increases the cost of capital at the break-even point of a capital investment project. In other words, it measures the extent to which taxation impacts business decisions to invest. According to the OECD estimates, in 2017, the four countries with the highest EMTRs in the sample were Costa Rica (33.1 percent), Chile (31.3 percent), Australia (28.5 percent), and Argentina (26.9 percent).
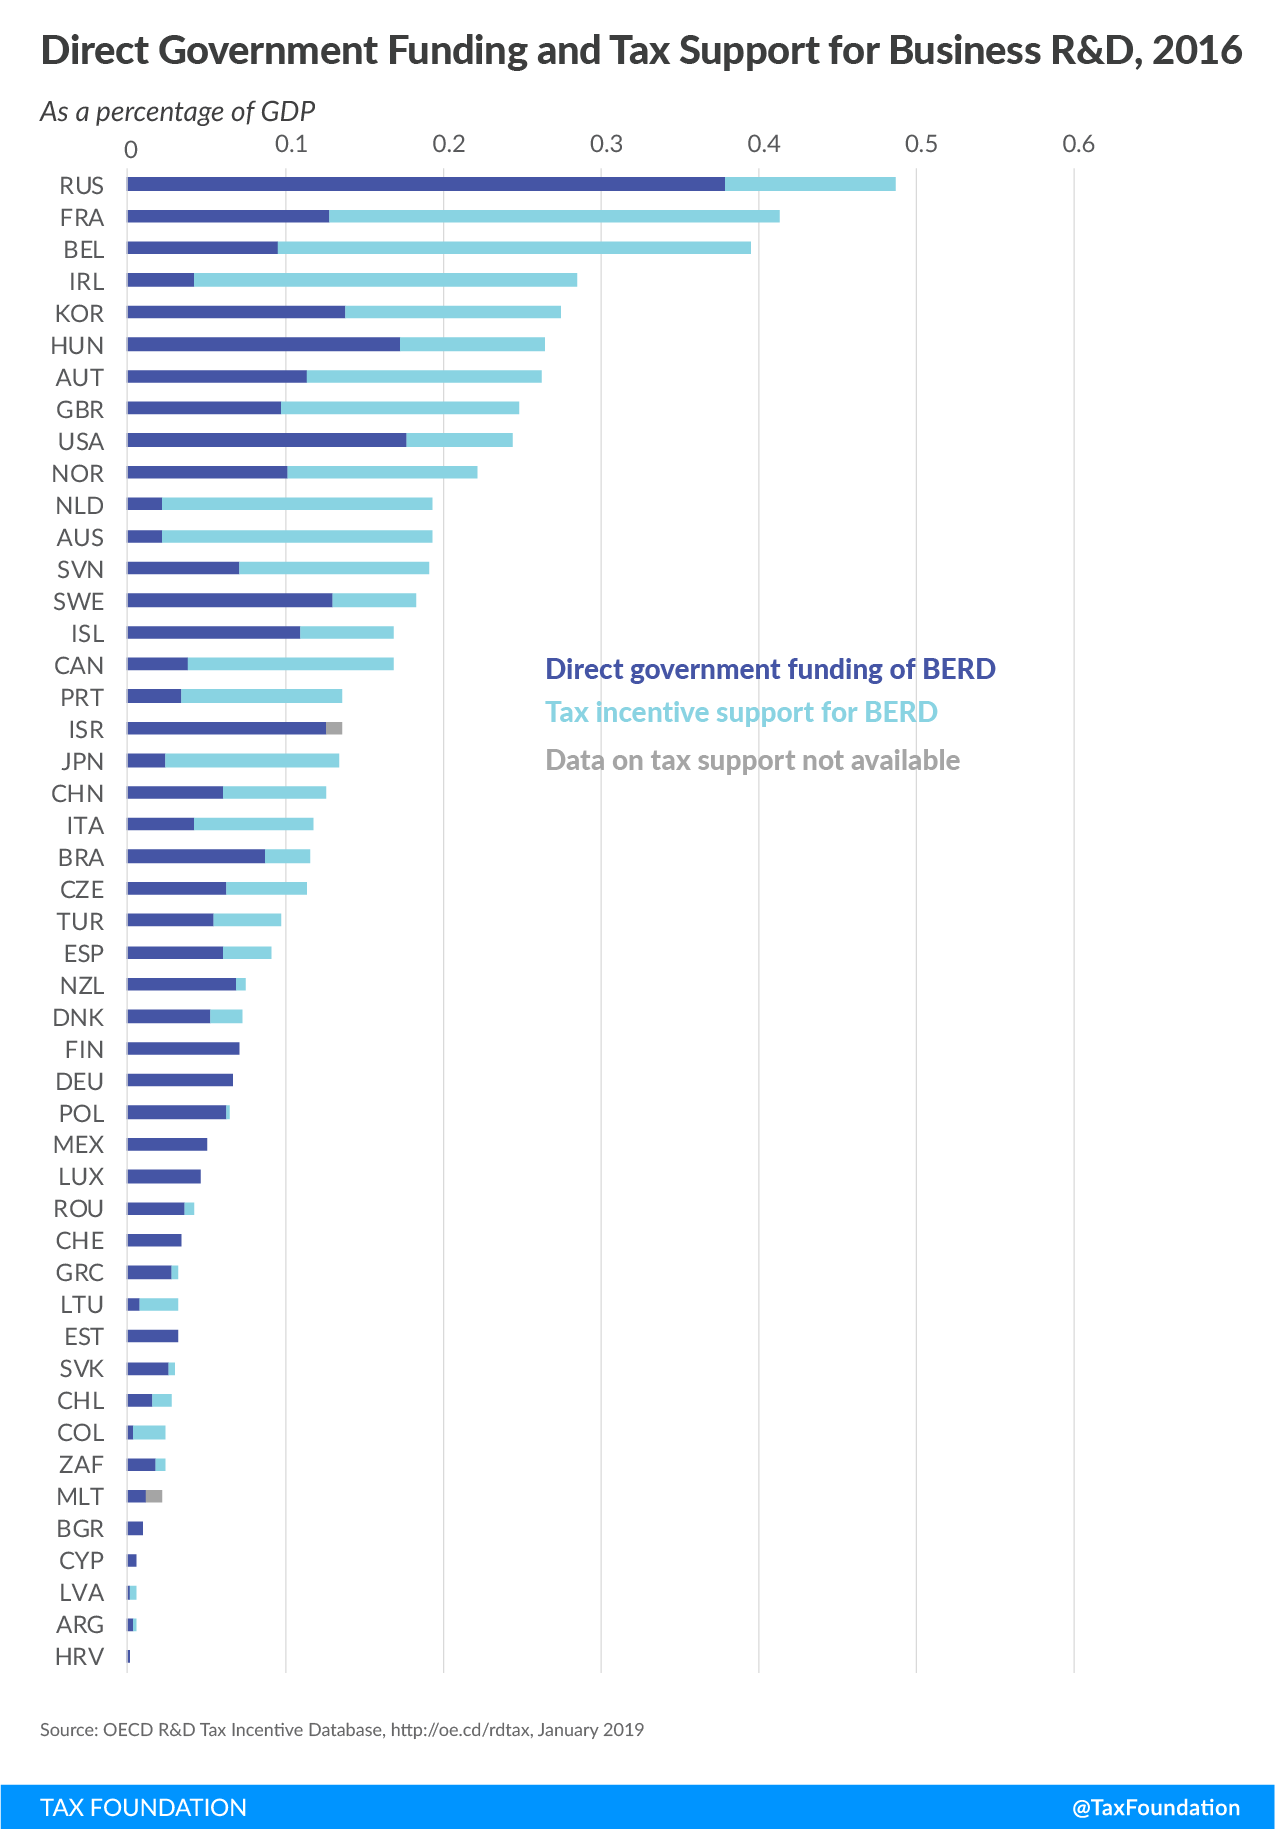
Tax incentives for research and development (R&D)
Since 2000, more jurisdictions have shifted from directly funding business R&D to providing R&D tax incentives. Many countries adopt tax provisions that are generous to R&D activities with the hope that those incentives will spur innovation in their economies. While only 19 out of 36 OECD jurisdictions offered tax relief on R&D expenditures in 2000, this number rose to 30 in 2018. A 70 percent increase in the volume of R&D tax relief in OECD jurisdictions can be observed between 2006 and 2016, reaching $45 billion in 2016. In the same period, direct support for business R&D through spending increased only by 10 percent, reaching $52 billion in 2016.
The BEPS Context
The OECD released its final report on “Measuring and Monitoring BEPS, Action 11” in 2015. At that time, the OECD estimated that global CIT revenue loss due to aggressive tax planning was between $100 billion and $240 billion annually or between 4 and 10 percent of global CIT revenues. Even if the high-end of the estimated range applies to the average country, then this new data from the OECD reveals that eliminating BEPS would increase total revenues by just 1.3 percent on average. However, even the OECD did not expect BEPS revenues to be fully captured, due to the administrative difficulty of collecting the marginal dollar of revenue. As mentioned previously, OECD research has also shown that the CIT is the most harmful tax for economic growth.
During the same period as the BEPS effort has been underway, countries have not only chosen to reduce their CIT rates, but have also chosen to narrow their tax bases with respect to R&D as mentioned previously.
This new data helps to paint a broader picture on the BEPS effort and remind policymakers of the scope of that debate.
Conclusion
Despite the decrease in statutory corporate income tax (CIT) rates over the last two decades, both average CIT revenues as a percentage of total tax revenue and as a percentage of GDP have slightly increased. As one might expect, declining CIT rates on average have not led to lower CIT revenues as a share of GDP. Instead, changes such as adjustments in the tax base by countries weakening their treatment of capital investment have resulted in a slight increase in CIT revenue as a share of GDP.
The database also includes some issues that will need to be investigated further as estimates for marginal effective tax rates and capital allowances for some countries are dissimilar to other estimates using similar methodologies. We will provide updates to our analysis as we continue to explore this dataset and corresponding documentation.
Stay informed on the tax policies impacting you.
Subscribe to get insights from our trusted experts delivered straight to your inbox.
Subscribe