The Federal Highway Trust Fund is due to go bust this summer, in part because the federal gas taxA gas tax is commonly used to describe the variety of taxes levied on gasoline at both the federal and state levels, to provide funds for highway repair and maintenance, as well as for other government infrastructure projects. These taxes are levied in a few ways, including per-gallon excise taxes, excise taxes imposed on wholesalers, and general sales taxes that apply to the purchase of gasoline. of 18.4 cents per gallon has not been raised since 1994. In these 20 years, inflationInflation is when the general price of goods and services increases across the economy, reducing the purchasing power of a currency and the value of certain assets. The same paycheck covers less goods, services, and bills. It is sometimes referred to as a “hidden tax,” as it leaves taxpayers less well-off due to higher costs and “bracket creep,” while increasing the government’s spendin has effectively reduced the taxA tax is a mandatory payment or charge collected by local, state, and national governments from individuals or businesses to cover the costs of general government services, goods, and activities. rate by about one third. Senator Carper of Delaware has recently proposed raising the gas tax “three or four cents a year for up to four years” and then indexing it to inflation.
The Congressional Budget Office (CBO) says increasing the federal gas tax 35 cents from the current 18.4 cents to 53.4 cents, and indexing it to inflation would raise $30 billion in the first year and $40 to $50 billion a year after that due to inflation. CBO is counting the reduction in income tax and payroll tax revenue resulting from the increase in business costs.
Table 1 shows IRS data on federal gas tax revenues and rates since 1933, in both current dollars and inflation adjusted 2012 dollars. The tax rates are depicted in Figure 1, and the revenue in Figure 2. Generally, gas tax revenue goes up in proportion to increases in the tax rate, i.e. there is very little change in behavior to avoid the higher gas taxes. People simply pay it. For example, when the gas tax was last raised in 1994 by 4.3 cents that amounted to a 30 percent increase. Revenue that year rose 34 percent.
By extension, and assuming behavior does not significantly change, if the gas tax today were raised 35 cents to 53.4 cents per gallon, as the CBO modeled, that would increase gas tax revenue by 190 percent, or $47 billion.
Further, because the gas tax (over this range) doesn’t change behavior all that much, it is one of the least economically harmful ways to raise revenue.
Note also, there is a federal tax on diesel of 24.4 cents per gallon that raises about $8.9 billion per year, according to the IRS. As with the gas tax, the diesel tax rate has remained nominally unchanged since 1994, but inflation has effectively reduced it by about one-third.
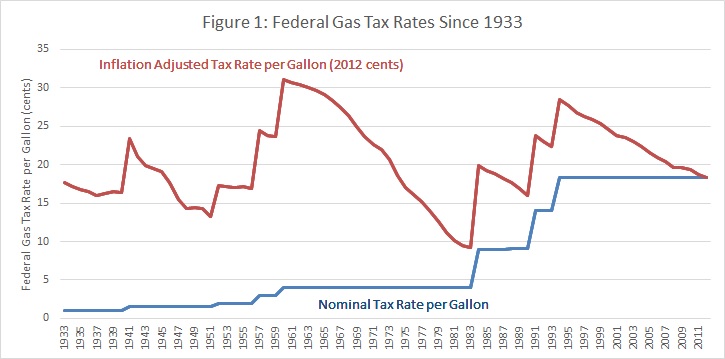

Table 1: Federal Gas Tax Rates and Revenue Since 1933
|
Fiscal Year |
Tax Revenue (billions of current $) |
Tax Revenue (billions of 2012 $) |
Tax Rate per Gallon (current cents) |
Tax Rate per Gallon (2012 cents) |
% Change in Tax Rate |
% Change in Tax Revenue |
|
1933 |
0.12 |
2.21 |
1 |
17.7 |
||
|
1934 |
0.20 |
3.47 |
1 |
17.1 |
0% |
62% |
|
1935 |
0.16 |
2.71 |
1 |
16.8 |
0% |
-20% |
|
1936 |
0.18 |
2.93 |
1 |
16.5 |
0% |
10% |
|
1937 |
0.20 |
3.13 |
1 |
15.9 |
0% |
11% |
|
1938 |
0.20 |
3.32 |
1 |
16.3 |
0% |
4% |
|
1939 |
0.21 |
3.42 |
1 |
16.5 |
0% |
2% |
|
1940 |
0.23 |
3.71 |
1 |
16.4 |
0% |
9% |
|
1941 |
0.34 |
5.36 |
1.5 |
23.4 |
50% |
52% |
|
1942 |
0.37 |
5.21 |
1.5 |
21.1 |
0% |
8% |
|
1943 |
0.29 |
3.83 |
1.5 |
19.9 |
0% |
-22% |
|
1944 |
0.27 |
3.54 |
1.5 |
19.6 |
0% |
-6% |
|
1945 |
0.41 |
5.17 |
1.5 |
19.1 |
0% |
50% |
|
1946 |
0.41 |
4.78 |
1.5 |
17.7 |
0% |
0% |
|
1947 |
0.43 |
4.46 |
1.5 |
15.4 |
0% |
7% |
|
1948 |
0.48 |
4.56 |
1.5 |
14.3 |
0% |
10% |
|
1949 |
0.50 |
4.86 |
1.5 |
14.5 |
0% |
5% |
|
1950 |
0.53 |
5.02 |
1.5 |
14.3 |
0% |
5% |
|
1951 |
0.57 |
5.03 |
1.5 |
13.2 |
0% |
8% |
|
1952 |
0.71 |
6.18 |
2 |
17.3 |
33% |
25% |
|
1953 |
0.89 |
7.66 |
2 |
17.2 |
0% |
25% |
|
1954 |
0.84 |
7.13 |
2 |
17.1 |
0% |
-6% |
|
1955 |
0.95 |
8.17 |
2 |
17.1 |
0% |
14% |
|
1956 |
1.03 |
8.70 |
2 |
16.9 |
0% |
8% |
|
1957 |
1.46 |
11.91 |
3 |
24.5 |
50% |
42% |
|
1958 |
1.64 |
13.00 |
3 |
23.8 |
0% |
12% |
|
1959 |
1.70 |
13.41 |
3 |
23.7 |
0% |
4% |
|
1960 |
2.02 |
15.64 |
4 |
31.0 |
33% |
19% |
|
1961 |
2.37 |
18.20 |
4 |
30.7 |
0% |
18% |
|
1962 |
2.41 |
18.29 |
4 |
30.4 |
0% |
2% |
|
1963 |
2.50 |
18.74 |
4 |
30.0 |
0% |
4% |
|
1964 |
2.62 |
19.39 |
4 |
29.6 |
0% |
5% |
|
1965 |
2.69 |
19.59 |
4 |
29.2 |
0% |
3% |
|
1966 |
2.82 |
20.01 |
4 |
28.3 |
0% |
5% |
|
1967 |
2.93 |
20.16 |
4 |
27.5 |
0% |
4% |
|
1968 |
3.03 |
20.00 |
4 |
26.4 |
0% |
3% |
|
1969 |
3.28 |
20.54 |
4 |
25.0 |
0% |
8% |
|
1970 |
3.43 |
20.30 |
4 |
23.7 |
0% |
4% |
|
1971 |
3.55 |
20.11 |
4 |
22.7 |
0% |
3% |
|
1972 |
3.74 |
20.55 |
4 |
22.0 |
0% |
5% |
|
1973 |
3.93 |
20.31 |
4 |
20.7 |
0% |
5% |
|
1974 |
4.09 |
19.04 |
4 |
18.6 |
0% |
4% |
|
1975 |
3.98 |
16.99 |
4 |
17.1 |
0% |
-3% |
|
1976 |
4.18 |
16.87 |
4 |
16.1 |
0% |
5% |
|
1977 |
4.32 |
16.37 |
4 |
15.2 |
0% |
3% |
|
1978 |
4.44 |
15.65 |
4 |
14.1 |
0% |
3% |
|
1979 |
4.53 |
14.31 |
4 |
12.6 |
0% |
2% |
|
1980 |
4.22 |
11.75 |
4 |
11.1 |
0% |
-7% |
|
1981 |
4.01 |
10.12 |
4 |
10.1 |
0% |
-5% |
|
1982 |
4.21 |
10.03 |
4 |
9.5 |
0% |
5% |
|
1983 |
4.90 |
11.31 |
4 |
9.2 |
0% |
16% |
|
1984 |
9.02 |
19.94 |
9 |
19.9 |
125% |
84% |
|
1985 |
9.06 |
19.34 |
9 |
19.2 |
0% |
0% |
|
1986 |
8.85 |
18.55 |
9 |
18.9 |
0% |
-2% |
|
1987 |
8.93 |
18.04 |
9 |
18.2 |
0% |
1% |
|
1988 |
9.17 |
17.79 |
9.1 |
17.7 |
1% |
3% |
|
1989 |
9.73 |
18.01 |
9.1 |
16.8 |
0% |
6% |
|
1990 |
9.47 |
16.63 |
9.1 |
16.0 |
0% |
-3% |
|
1991 |
14.47 |
24.39 |
14.1 |
23.8 |
55% |
53% |
|
1992 |
14.76 |
24.15 |
14.1 |
23.1 |
0% |
2% |
|
1993 |
14.75 |
23.44 |
14.1 |
22.4 |
0% |
0% |
|
1994 |
19.79 |
30.67 |
18.4 |
28.5 |
30% |
34% |
|
1995 |
19.92 |
30.01 |
18.4 |
27.7 |
0% |
1% |
|
1996 |
19.65 |
28.76 |
18.3 |
26.8 |
-1% |
-1% |
|
1997 |
20.84 |
29.81 |
18.4 |
26.3 |
1% |
6% |
|
1998 |
20.64 |
29.08 |
18.4 |
25.9 |
0% |
-1% |
|
1999 |
21.24 |
29.27 |
18.4 |
25.4 |
0% |
3% |
|
2000 |
21.04 |
28.05 |
18.4 |
24.5 |
0% |
-1% |
|
2001 |
20.62 |
26.73 |
18.4 |
23.9 |
0% |
-2% |
|
2002 |
20.94 |
26.73 |
18.4 |
23.5 |
0% |
2% |
|
2003 |
20.17 |
25.17 |
18.4 |
23.0 |
0% |
-4% |
|
2004 |
18.23 |
22.16 |
18.4 |
22.4 |
0% |
-10% |
|
2005 |
23.73 |
27.89 |
18.4 |
21.6 |
0% |
30% |
|
2006 |
25.52 |
29.06 |
18.4 |
21.0 |
0% |
8% |
|
2007 |
25.77 |
28.54 |
18.4 |
20.4 |
0% |
1% |
|
2008 |
25.10 |
26.77 |
18.4 |
19.6 |
0% |
-3% |
|
2009 |
25.07 |
26.83 |
18.4 |
19.7 |
0% |
0% |
|
2010 |
25.07 |
26.40 |
18.4 |
19.4 |
0% |
0% |
|
2011 |
24.85 |
25.36 |
18.4 |
18.8 |
0% |
-1% |
|
2012 |
24.77 |
24.77 |
18.4 |
18.4 |
0% |
0% |
Follow William McBride on Twitter
Share this article