Key Findings
- In general, large industrialized nations tend to have higher statutory corporate income taxA corporate income tax (CIT) is levied by federal and state governments on business profits. Many companies are not subject to the CIT because they are taxed as pass-through businesses, with income reportable under the individual income tax. rates than developing countries.
- The worldwide average statutory corporate income taxA tax is a mandatory payment or charge collected by local, state, and national governments from individuals or businesses to cover the costs of general government services, goods, and activities. rate, measured across 208 jurisdictions, is 23.03 percent. When weighted by GDP, the average statutory rate is 26.47 percent.
- The average top corporate rate among EU countries is 21.68 percent, 23.69 percent in OECD countries, and 27.63 percent in the G7.
- Europe has the lowest regional average rate, at 18.38 percent (25.43 percent when weighted by GDP). Conversely, Africa has the highest regional average statutory rate, at 28.81 percent (28.39 percent weighted by GDP).
- The worldwide average statutory corporate tax rate has consistently decreased since 1980, with the largest decline occurring in the early 2000s.
- The average statutory corporate tax rate has declined in every region since 1980.
Introduction
In 1980, corporate tax rates around the world averaged 38.84 percent and 46.63 percent when weighted by GDP. Since then countries have recognized the impact that corporate taxes have on business investment decisions so that in 2018, the average is now 23.03 percent and 26.47 when weighted by GDP for 208 separate tax jurisdictions.[1]
Declines have been seen in every major region of the world including in the largest economies. The recent tax reform in the United States brought the statutory corporate income tax rate from among the highest in the world closer to the middle of the distribution. Whereas in 2017 the United States had the fourth highest corporate income tax rate in the world,[2] it now ranks towards the middle of the 208 countries and tax jurisdictions surveyed.
European countries tend to have lower corporate income tax rates than countries in other regions, and many developing countries have corporate income tax rates that are above the worldwide average.
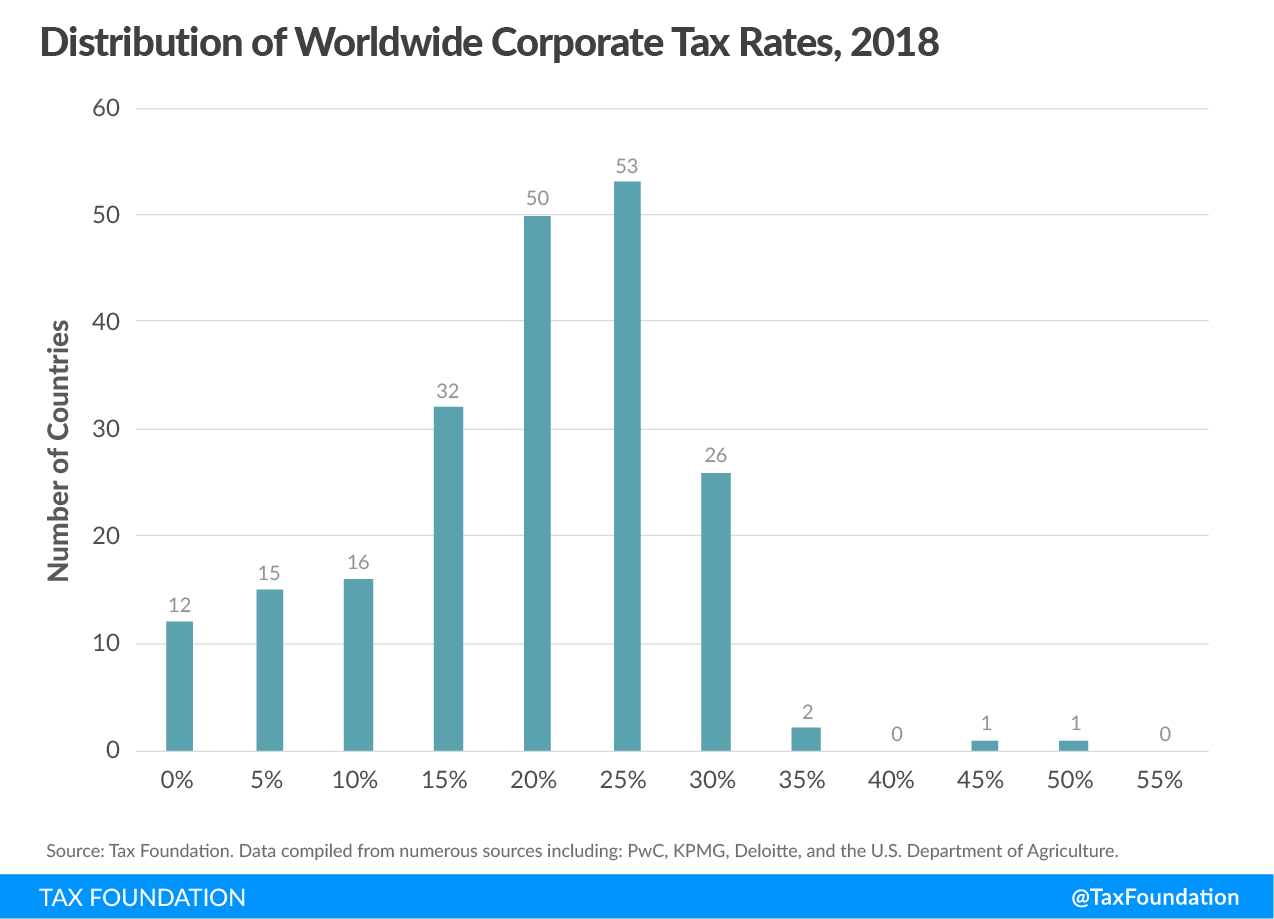
Today, most countries have corporate tax rates below 30 percent.
The Highest and Lowest Corporate Tax Rates in the World
The majority of the 208 separate jurisdictions surveyed have corporate tax rates below 25 percent and 103 have tax rates between 20 and 30 percent. The average tax rateThe average tax rate is the total tax paid divided by taxable income. While marginal tax rates show the amount of tax paid on the next dollar earned, average tax rates show the overall share of income paid in taxes. among these jurisdictions is 23.03 percent,[3] or 26.47 percent weighted by GDP. The United States has the 83rd highest corporate tax rate with a combined statutory rate of 25.84 percent.
The twenty countries with the highest statutory corporate income tax rates span every region, albeit unequally. While nine of the top twenty countries are in Africa, Europe and Asia appear in the top twenty only twice each. Of the remaining jurisdictions, one is in Oceania, and six are in the Americas.
The only other countries with large economies in the top twenty are India (35 percent), France (34.43 percent) and Brazil (34 percent). India holds the ninth spot, while France holds the 16th, and Brazil holds the 17th.
| Source: Tax Foundation. Data compiled from numerous sources including: PwC, KPMG, Deloitte, and the U.S. Department of Agriculture. | ||
| Country | Rate | Region |
|---|---|---|
| United Arab Emirates[4] | 55% | Asia |
| Comoros | 50% | Africa |
| Puerto Rico | 39% | North America |
| Suriname | 36% | South America |
| Chad | 35% | Africa |
| Congo, The Democratic Republic of the | 35% | Africa |
| Equatorial Guinea | 35% | Africa |
| Guinea | 35% | Africa |
| India | 35% | Asia |
| Kiribati | 35% | Oceania |
| Malta | 35% | Europe |
| Saint Maarten | 35% | North America |
| Sudan | 35% | Africa |
| Zambia | 35% | Africa |
| Sint Maarten (Dutch part) | 35% | North America |
| France | 34.43% | Europe |
| Brazil | 34% | South America |
| Venezuela | 34% | South America |
| Reunion | 33.33% | Africa |
| Cameroon | 33% | Africa |
| Worldwide Average | 23.03% | N/A |
| Worldwide weighted average (by GDP) | 26.47% | N/A |
Stay informed on the tax policies impacting you.
Subscribe to get insights from our trusted experts delivered straight to your inbox.
SubscribeOn the other end of the spectrum, the twenty countries with the lowest non-zero statutory corporate tax rates all charge rates lower than 15 percent. Eleven countries have statutory rates of 10 percent, six being small European nations (Andorra, Bosnia and Herzegovina, Bulgaria, Gibraltar, Kosovo, and Macedonia). The only two major industrialized nations[5] represented among the bottom twenty countries are Ireland and Hungary. Ireland is known for its low 12.5 percent rate, which has been in place since 2003. Hungary reduced its corporate income tax rate from 19 to 9 percent in 2017.
| Source: Tax Foundation. Data compiled from numerous sources including: PwC, KPMG, Deloitte, and the U.S. Department of Agriculture. | |||||||||||||||||||||||||||||||||||||||||||||||||||||||||||||||||||||||||||||||||||||||||||||||||||
| (Excluding Countries Without a Corporate Income Tax) | |||||||||||||||||||||||||||||||||||||||||||||||||||||||||||||||||||||||||||||||||||||||||||||||||||
|---|---|---|---|---|---|---|---|---|---|---|---|---|---|---|---|---|---|---|---|---|---|---|---|---|---|---|---|---|---|---|---|---|---|---|---|---|---|---|---|---|---|---|---|---|---|---|---|---|---|---|---|---|---|---|---|---|---|---|---|---|---|---|---|---|---|---|---|---|---|---|---|---|---|---|---|---|---|---|---|---|---|---|---|---|---|---|---|---|---|---|---|---|---|---|---|---|---|---|---|
| Country | Rate | Region | |||||||||||||||||||||||||||||||||||||||||||||||||||||||||||||||||||||||||||||||||||||||||||||||||
| Cyprus | 12.5% | Europe | |||||||||||||||||||||||||||||||||||||||||||||||||||||||||||||||||||||||||||||||||||||||||||||||||
| Ireland | 12.5% | Europe | |||||||||||||||||||||||||||||||||||||||||||||||||||||||||||||||||||||||||||||||||||||||||||||||||
| Liechtenstein | 12.5% | Europe | |||||||||||||||||||||||||||||||||||||||||||||||||||||||||||||||||||||||||||||||||||||||||||||||||
| Macao | 12% | Asia | |||||||||||||||||||||||||||||||||||||||||||||||||||||||||||||||||||||||||||||||||||||||||||||||||
| Moldova, Republic of | 12% | Europe | |||||||||||||||||||||||||||||||||||||||||||||||||||||||||||||||||||||||||||||||||||||||||||||||||
| Andorra | 10% | Europe | |||||||||||||||||||||||||||||||||||||||||||||||||||||||||||||||||||||||||||||||||||||||||||||||||
| Bosnia and Herzegovina | 10% | Europe | |||||||||||||||||||||||||||||||||||||||||||||||||||||||||||||||||||||||||||||||||||||||||||||||||
| Bulgaria | 10% | Europe | |||||||||||||||||||||||||||||||||||||||||||||||||||||||||||||||||||||||||||||||||||||||||||||||||
| Gibraltar | 10% | Europe | |||||||||||||||||||||||||||||||||||||||||||||||||||||||||||||||||||||||||||||||||||||||||||||||||
| Kyrgyzstan | 10% | Asia | |||||||||||||||||||||||||||||||||||||||||||||||||||||||||||||||||||||||||||||||||||||||||||||||||
| Macedonia, The Former Yugoslav Republic of | 10% | Europe | |||||||||||||||||||||||||||||||||||||||||||||||||||||||||||||||||||||||||||||||||||||||||||||||||
| Nauru | 10% | Oceania | |||||||||||||||||||||||||||||||||||||||||||||||||||||||||||||||||||||||||||||||||||||||||||||||||
| Paraguay | 10% | South America | |||||||||||||||||||||||||||||||||||||||||||||||||||||||||||||||||||||||||||||||||||||||||||||||||
| Qatar | 10% | Asia | |||||||||||||||||||||||||||||||||||||||||||||||||||||||||||||||||||||||||||||||||||||||||||||||||
| Timor-Leste | 10% | Asia | |||||||||||||||||||||||||||||||||||||||||||||||||||||||||||||||||||||||||||||||||||||||||||||||||
| Kosovo, Republic of | 10% | Europe | |||||||||||||||||||||||||||||||||||||||||||||||||||||||||||||||||||||||||||||||||||||||||||||||||
| Hungary | 9% | Europe | |||||||||||||||||||||||||||||||||||||||||||||||||||||||||||||||||||||||||||||||||||||||||||||||||
| Montenegro | 9% | Europe | |||||||||||||||||||||||||||||||||||||||||||||||||||||||||||||||||||||||||||||||||||||||||||||||||
| Turkmenistan | 8% | Asia | |||||||||||||||||||||||||||||||||||||||||||||||||||||||||||||||||||||||||||||||||||||||||||||||||
| Uzbekistan | 7.5% | Asia | |||||||||||||||||||||||||||||||||||||||||||||||||||||||||||||||||||||||||||||||||||||||||||||||||
| Worldwide Average | 23.03% | N/A | |||||||||||||||||||||||||||||||||||||||||||||||||||||||||||||||||||||||||||||||||||||||||||||||||
| Worldwide weighted average (by GDP) | 26.47% | N/A | |||||||||||||||||||||||||||||||||||||||||||||||||||||||||||||||||||||||||||||||||||||||||||||||||
Of the 208 jurisdictions surveyed, twelve currently do not impose a general corporate income tax. Most of these countries are small, island nations. A handful, such as the Cayman Islands and Bermuda, are well-known for their lack of corporate taxes. Bahrain has no general corporate income tax but has a targeted corporate income tax on oil companies.[6]
| Source: Tax Foundation. Data compiled from numerous sources including: PwC, KPMG, Deloitte, and the U.S. Department of Agriculture. | |
| Country | Region |
|---|---|
| Anguilla | North America |
| Bahamas | North America |
| Bahrain | Asia |
| Bermuda | North America |
| Cayman Islands | North America |
| Guernsey | Europe |
| Isle of Man | Europe |
| Jersey | Europe |
| Palau | Oceania |
| Turks and Caicos Islands | North America |
| Vanuatu | Oceania |
| Virgin Islands, British | North America |
Regional Variation in Corporate Tax Rates
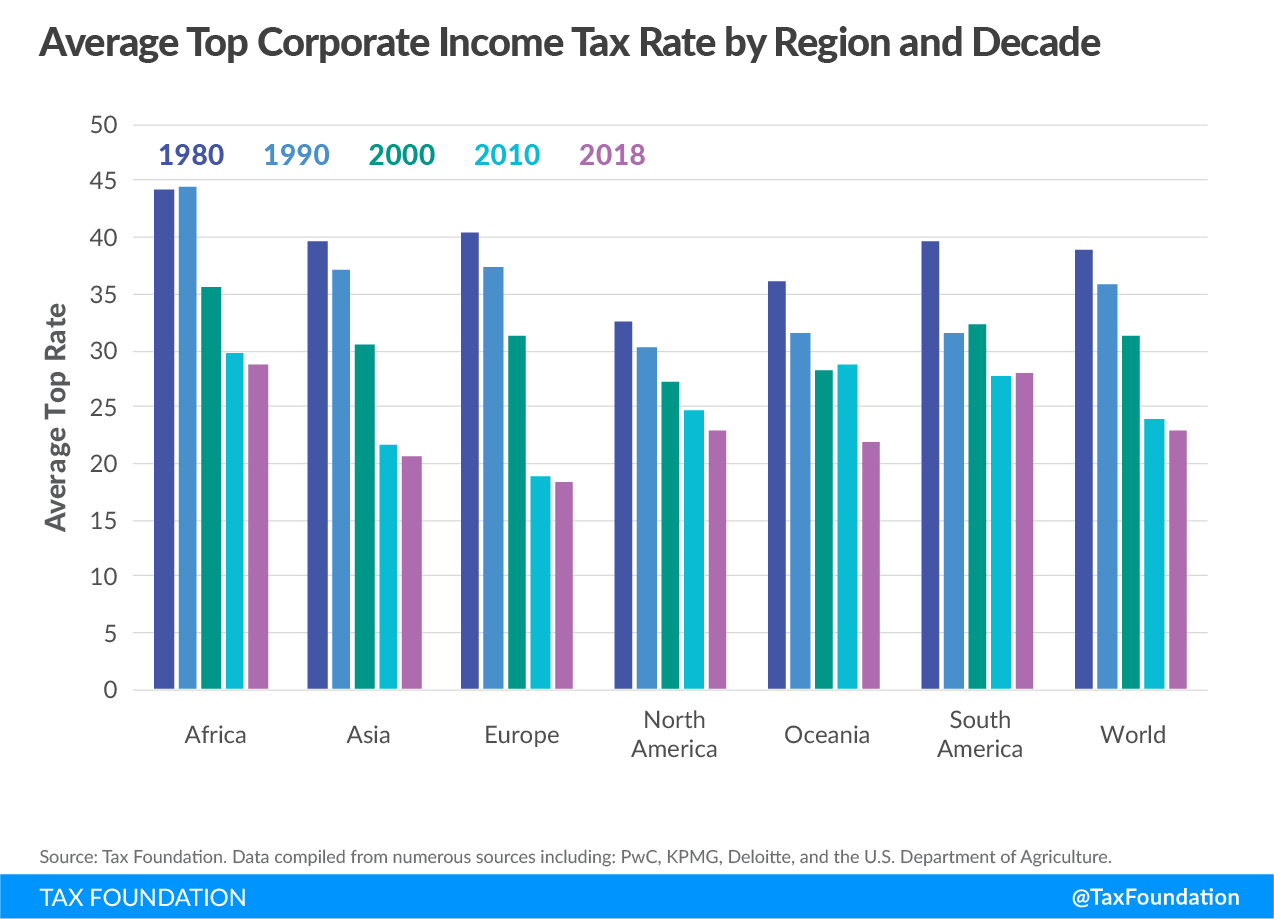
Corporate tax rates can vary significantly by region. Africa has the highest average statutory tax rate among all regions, at 28.81 percent. Europe has the lowest average statutory corporate tax rate among all regions, at 18.38 percent.
When weighted by GDP, South America has the highest average statutory corporate tax rate at 32.2 percent. Europe has the lowest weighted average statutory corporate income tax, with a rate of 25.43 percent.
In general, larger and more industrialized nations tend to have higher corporate income tax rates than smaller or less developed nations. These rates are usually above the worldwide average. The G7, which is comprised of the seven wealthiest nations in the world, has an average statutory corporate income tax rate of 27.63 percent, and a weighted average rate of 27.21 percent. OECD member states have an average statutory corporate tax rate of 23.93 percent and a rate of 26.58 percent when weighted by GDP. The BRICS[7] have an average statutory rate of 28.40 percent and a weighted average statutory corporate income tax rate of 27.33 percent.
| Region or Group | Average Rate | Weighted Average Rate | Number of Countries | ||||||||||||||||||||||||||||||||||||||||||||||||||||||||||||||||||||||||||||||||||||||||||||||||
|---|---|---|---|---|---|---|---|---|---|---|---|---|---|---|---|---|---|---|---|---|---|---|---|---|---|---|---|---|---|---|---|---|---|---|---|---|---|---|---|---|---|---|---|---|---|---|---|---|---|---|---|---|---|---|---|---|---|---|---|---|---|---|---|---|---|---|---|---|---|---|---|---|---|---|---|---|---|---|---|---|---|---|---|---|---|---|---|---|---|---|---|---|---|---|---|---|---|---|---|
| Source: Tax Foundation. Data compiled from numerous sources including: PwC, KPMG, Deloitte, and the U.S. Department of Agriculture. | |||||||||||||||||||||||||||||||||||||||||||||||||||||||||||||||||||||||||||||||||||||||||||||||||||
| Africa | 28.81% | 28.39% | 50 | ||||||||||||||||||||||||||||||||||||||||||||||||||||||||||||||||||||||||||||||||||||||||||||||||
| Asia | 20.65% | 26.42% | 46 | ||||||||||||||||||||||||||||||||||||||||||||||||||||||||||||||||||||||||||||||||||||||||||||||||
| Europe | 18.38% | 25.43% | 49 | ||||||||||||||||||||||||||||||||||||||||||||||||||||||||||||||||||||||||||||||||||||||||||||||||
| North America | 23.01% | 26.22% | 33 | ||||||||||||||||||||||||||||||||||||||||||||||||||||||||||||||||||||||||||||||||||||||||||||||||
| Oceania | 22.00% | 27.04% | 17 | ||||||||||||||||||||||||||||||||||||||||||||||||||||||||||||||||||||||||||||||||||||||||||||||||
| South America | 28.08% | 32.20% | 13 | ||||||||||||||||||||||||||||||||||||||||||||||||||||||||||||||||||||||||||||||||||||||||||||||||
| BRICS | 28.40% | 27.33% | 5 | ||||||||||||||||||||||||||||||||||||||||||||||||||||||||||||||||||||||||||||||||||||||||||||||||
| EU | 21.86% | 26.03% | 28 | ||||||||||||||||||||||||||||||||||||||||||||||||||||||||||||||||||||||||||||||||||||||||||||||||
| G20 | 27.37% | 27.18% | 19 | ||||||||||||||||||||||||||||||||||||||||||||||||||||||||||||||||||||||||||||||||||||||||||||||||
| G7 | 27.63% | 27.21% | 7 | ||||||||||||||||||||||||||||||||||||||||||||||||||||||||||||||||||||||||||||||||||||||||||||||||
| OECD | 23.93% | 26.58% | 36 | ||||||||||||||||||||||||||||||||||||||||||||||||||||||||||||||||||||||||||||||||||||||||||||||||
| World | 23.03% | 26.47% | 208 | ||||||||||||||||||||||||||||||||||||||||||||||||||||||||||||||||||||||||||||||||||||||||||||||||
[global_newsletter_inline_widget campaign=”//TaxFoundation.us1.list-manage.com/subscribe/post?u=fefb55dc846b4d629857464f8&id=6c6b782bd7&SIGNUP=ITCI”]
Distribution of Corporate Tax Rates
Very few tax jurisdictions impose a corporate income tax at statutory rates greater than 35 percent. The following chart shows a distribution of corporate income tax rates among 208 jurisdictions in 2018. A plurality of countries (103 total) impose a rate between 20 and 30 percent. Twenty-eight countries have a statutory corporate tax rate between 30 and 35 percent. Seventy-five countries have a statutory corporate tax rate lower than 20 percent and 178 countries have a corporate tax rate below 30 percent.

The Decline of Corporate Tax Rates Since 1980
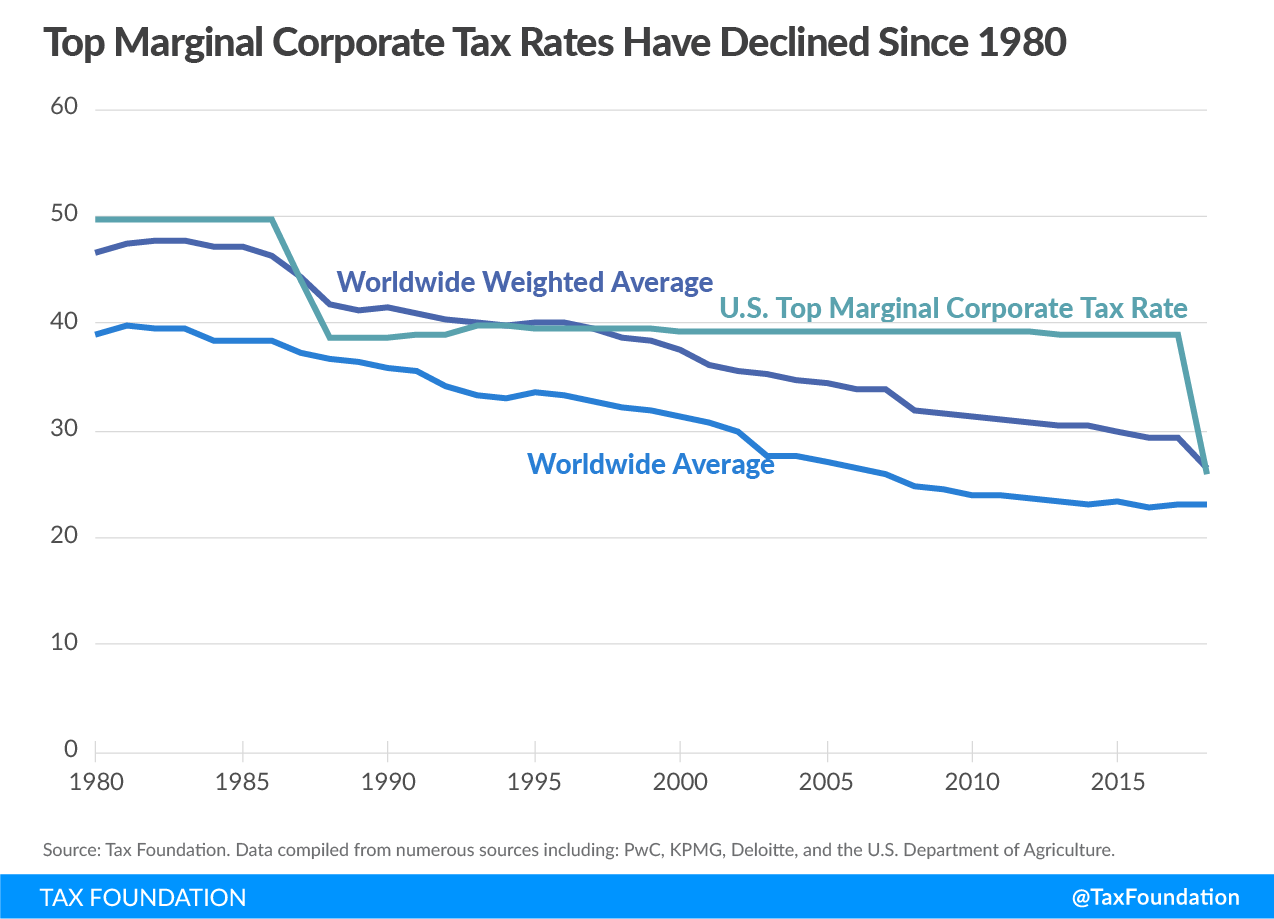
Over the past 38 years, the corporate tax rate has consistently declined on a global basis.[8] In 1980, the unweighted average worldwide statutory tax rate was 38.84 percent. Today, the average statutory rate stands at 23.03 percent, representing a 41 percent reduction over the 38 years surveyed.
The weighted average statutory rate has remained higher than the simple average over this period. Prior to tax reform, the United States was largely responsible for keeping the weighted average so high, given its relatively high tax rate, as well as its significant contribution to global GDP. Figure 2 shows the significant shift in both the corporate tax rate in the United States in 2018 as well as the impact that change had on the worldwide weighted average. The weighted average statutory corporate income tax rate has declined from 46.63 percent in 1980 to 26.47 percent in 2018, representing a 43 percent reduction over the 38 years surveyed.

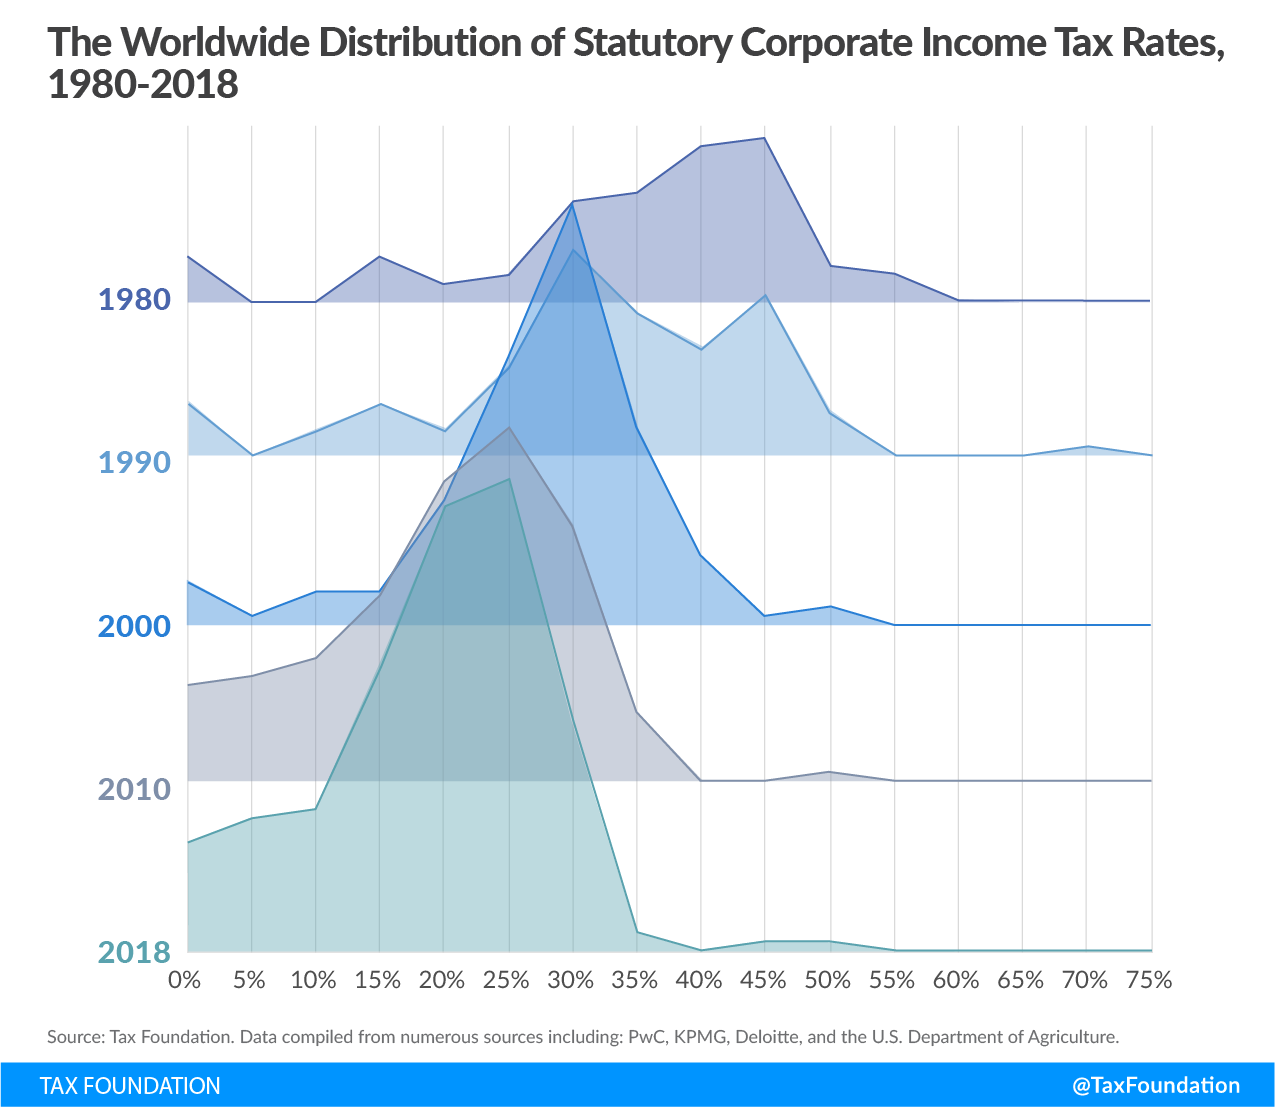
Over time, more countries have shifted to taxing corporations at rates lower than 30 percent, with the United States following this trend with its tax changes at the end of 2017. This changing distribution of corporate tax rates has been far from consistent. The largest shift occurred between 2000 and 2010, with 77 percent of countries imposing a statutory rate below 30 percent in 2010 and only 42 percent of countries imposing a statutory rate below 30 percent in 2000.

[global_newsletter_inline_widget campaign=”//TaxFoundation.us1.list-manage.com/subscribe/post?u=fefb55dc846b4d629857464f8&id=6c6b782bd7&SIGNUP=ITCI”]
All regions saw a net decline in average statutory rates between 1980 and 2018. The average declined the most in Europe, with the 1980 average of 40.5 percent dropping to 18.38 percent, representing almost a 55 percent rate reduction. South America has seen the smallest decline, with the average only decreasing by 29 percent from 39.66 percent in 1980 to 28.08 percent in 2018.
Africa, Oceania, and South America all saw periods where the average statutory rate increased, although the average rates decreased in all regions over the full period. In each instance of an average rate increase, the change was relatively small, with the absolute change being less than 1 percentage point between decades.

Conclusion
Average top corporate tax rates continue to fall across the world, and the recent change to the corporate taxes in the United States is a continuation of that trend. Several countries are planning to reduce their corporate tax rates in the coming years.[9] Today, the United States’ statutory corporate tax rate is closer to the middle of the distribution and closer to the worldwide average. Countries considering cutting their corporate tax rates could look to potential benefits of attracting business investment and a more competitive tax environment.
Stay informed on the tax policies impacting you.
Subscribe to get insights from our trusted experts delivered straight to your inbox.
SubscribeNotes
[1] GDP calculations are from the U.S. Department of Agriculture, “International Macroeconomics Data Set,” December 2017, https://www.ers.usda.gov/data-products/international-macroeconomic-data-set/; World Bank, “World Development Indicators – GDP (current US$),” November 2018, http://data.worldbank.org/indicator/NY.GDP.MKTP.CD; United Nations Department of Economic and Social Affairs -Statistics Division, World Statistics Pocketbook 2016 edition (New York: United Nations, 2016), https://unstats.un.org/unsd/publications/pocketbook/files/world-stats-pocketbook-2016.pdf; European
Commission, “Gross domestic product (GDP) at current market prices by NUTS 2 regions,” Sept, 4, 2018, http://appsso.eurostat.ec.europa.eu/nui/show.do?dataset=nama_10r_2gdp&lang=en; and official worldwide government publications.
[2] Kari Jahnsen, Kyle Pomerleau, “Corporate Income Tax Rates around the World, 2017,” Sept. 7, 2017, https://taxfoundation.org/corporate-income-tax-rates-around-the-world-2017/.
[3] Data on statutory corporate tax rates are from multiple sources: Deloitte, “Tax guides and highlights,” 2018, https://dits.deloitte.com/#TaxGuides; PwC,
“Worldwide Tax Summaries – Corporate income tax (CIT) rates,” http://taxsummaries.pwc.com/ID/Corporate-income-tax-(CIT)-rates; KPMG, “Corporate tax rates table,” https://home.kpmg.com/xx/en/home/services/tax/tax-tools-and-resources/tax-rates-online/corporate-tax-rates-table.html; the OECD Tax Database, “Table II.1 – Statutory corporate income tax rate,” November 2018, https://stats.oecd.org/index.aspx?DataSetCode=Table_II1; EY, “Worldwide Corporate Tax Guide 2018,” April 2018, https://www.ey.com/Publication/vwLUAssets/EY-2018-worldwide-corporate-tax-guide/$FILE/EY-2018-worldwide-corporate-tax-guide.pdf; and various worldwide government publications.
[4] The United Arab Emirates is a federation of seven separate emirates. Since 1960, each emirate has the discretion to levy up to a 55 percent corporate tax rate on any business. In practice, this tax is mostly levied on foreign banks and petroleum companies. For more information on the taxation system in the United Arab Emirates see PwC,
“Worldwide Tax Summaries – Corporate income tax (CIT) rates.”
[5] Major industrialized nations are those who are members of the OECD.
[6] This tax rate can be as high as 46%. See Deloitte, “Tax guides and highlights.”
[7] BRICS is a group of countries with major emerging economies. The members of this group are Brazil, Russia, India, China, and South Africa.
[8] Historical data comes from multiple sources: PwC, “Worldwide Tax Summaries – Corporate Taxes,” 2010-2018; KPMG, “Corporate Tax Rate Survey,” 1998- 2003; KPMG, “Corporate tax rates table,” 2003-2018; EY, “Worldwide Corporate Tax Guide,” 2004-2018; OECD, “Historical Table II.1 – Statutory corporate income tax rate,” 1999, http://www.oecd.org/tax/tax-policy/tax-database.htm#C_CorporateCaptial; and the University of Michigan – Ross School of Business, “World Tax Database,” https://www.bus.umich.edu/otpr/otpr/default.asp.
[9] Daniel Bunn, “Upcoming Corporate Tax Rate Reductions in Developed Countries,” Tax Foundation, Sept. 13, 2018, https://taxfoundation.org/upcoming-corporate-tax-rate-reductions-developed-countries/.
Share this article