Key Findings
- Senator Sherrod Brown (D-OH), Representative Bonnie Watson Coleman (D-NJ), and Representative Ro Khanna (D-CA) introduced legislation to expand the Earned Income Tax CreditA tax credit is a provision that reduces a taxpayer’s final tax bill, dollar-for-dollar. A tax credit differs from deductions and exemptions, which reduce taxable income rather than the taxpayer’s tax bill directly. called the Cost-of-Living Refund Act of 2019. This legislation was recently reintroduced
- The Cost-of-Living Refund Act of 2019 would reduce federal revenue by $1.8 trillion between 2020 and 2029 on a conventional basis.
- The Cost-of-Living Refund Act of 2019 would slightly reduce the overall incentive to work, leading to 51,577 fewer full-time equivalent jobs and a 0.29 percent smaller economy in the long run.
- The effect the Cost-of-Living Refund Act of 2019 has on the incentive to work would depend on how much income a taxA tax is a mandatory payment or charge collected by local, state, and national governments from individuals or businesses to cover the costs of general government services, goods, and activities. filer earns. The proposal would increase the incentive for low-income tax filers to work, leading to 822,788 more full-time equivalent jobs for that income group.
- The smaller projected economy over the next decade would result in slightly lower revenue collections. As a result, we estimate that this proposal would reduce federal revenue by $1.9 trillion between 2020 and 2029 on a dynamic basis.
- The Cost-of-Living Refund Act of 2019 would greatly increase the progressivity of the tax code by raising the after-tax incomes of the bottom 20 percent of taxpayers by 15.4 percent. Overall, taxpayer after-tax incomeAfter-tax income is the net amount of income available to invest, save, or consume after federal, state, and withholding taxes have been applied—your disposable income. Companies and, to a lesser extent, individuals, make economic decisions in light of how they can best maximize their earnings. would rise by 1.5 percent.
Introduction
Senator Sherrod Brown (D-OH), Representative Bonnie Watson Coleman (D-NJ), and Representative Ro Khanna (D-CA) recently reintroduced a bill to greatly expand the Earned Income Tax Credit (EITC) called the Cost-of-Living Refund Act of 2019. This bill would increase the size of the EITC and increase the number of tax filers eligible for the credit.[1]
Details of the Proposal[2]
- Cost-of-Living Refund Act of 2019 would increase the phase-in rate, and the size of the Earned Income Tax Credit for filers with children (see appendix table for all parameters), roughly doubling the credit for these filers.
- The maximum EITC for filers with children would increase from between $3,526 and $6,557 to $6,770 and $12,588, depending on family size.
- The Cost-of-Living Refund Act of 2019 would increase the phase-in rate and the income threshold at which the maximum credit is reached, increasing the maximum credit from $529 to $3,111. The credit for childless filers would then phase out at 15.98 percent instead of 7.65 percent.
- The eligibility age for childless filers would decline from 25 to 21 and eligibility would expand to qualified students.
- Qualified dependents for the purposes of the EITC would be expanded to include parents and other relatives.
- Taxpayers would be allowed to receive an advance up to $500 per year of their EITC refund.
Economic Impact
Overall, we estimate that the Cost-of-Living Refund Act of 2019 would result in a small reduction in the labor force equal to 51,577 full-time equivalent jobs and a reduction in economic output (GDP) of 0.29 percent. However, the effect the Cost-of-Living Refund Act of 2019 has on the incentive to work depends on how much income a tax filer earns. As a result, some workers would end up increasing their hours worked and labor force participation while others would reduce it. We estimate that the Cost-of-Living Refund Act of 2019 would end up boosting hours worked and labor force participation for low-income tax filers by 822,788 full-time equivalent jobs. However, the proposal would reduce hours worked and participation for middle- and upper-income tax filers by 874,366 full-time equivalent jobs.
|
Source: Tax Foundation General Equilibrium Tax Model, October 2018 Note: The income splits (in AGI) for each segment of the labor force are roughly (low) $0-$22,000, (middle) $22,000-$45,000 and (high) $45,000 and up. |
|
| Gross Domestic Product (GDP) | -0.29% |
| Wage Rate | 0% |
| Total Labor Compensation | -0.33% |
| Full-Time Equivalent (FTE) Jobs | -51,577 |
| Low-income FTE Jobs | 822,788 |
| Middle-income FTE Jobs | -849,741 |
| High-income FTE Jobs | -24,625 |
The EITC phases in from the first dollar of earned income until it reaches a maximum credit size. It then phases out at different income levels depending on the tax filer’s marital status and whether they have children. These phase-ins and phaseouts create implicit marginal subsidies and tax rates on earned income that impact individuals’ incentive to work.
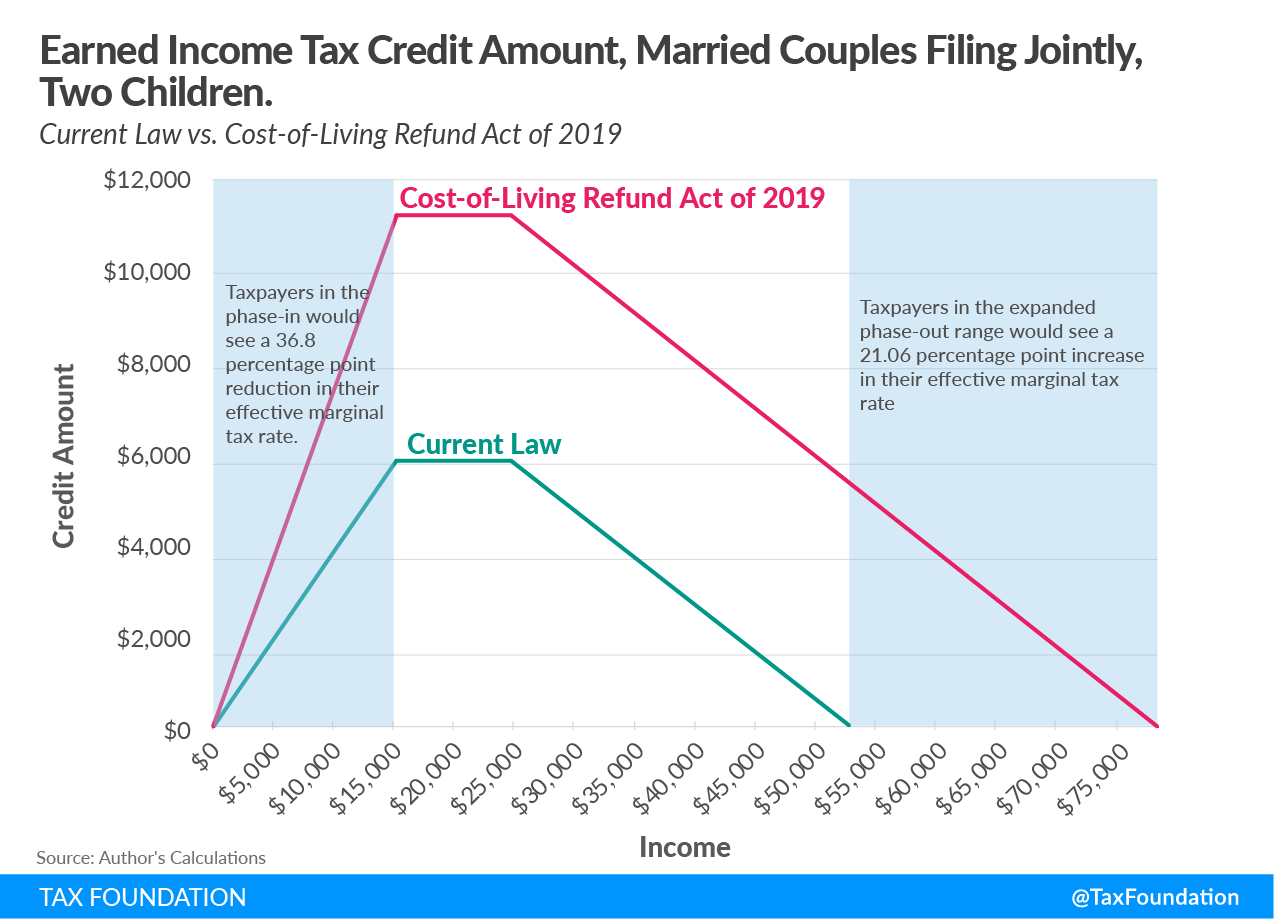
The Cost-of-Living Refund Act of 2019 would change the incentives to work by increasing both the phase-in and phaseout rate of the Earned Income Tax credit and by increasing the number of tax filers subject to the phase-in and phaseout rates. Take for example the EITC for married filers with two children (Figure 1). Under current law, the phase-in rate is 40 percent. Under the Cost-of-Living Refund Act of 2019, the phase-in rate for these taxpayers would increase to 76.8 percent. This represents a 36.8 percentage point reduction in the effective marginal tax rate for these tax filers.
The phaseout rate for married couples with two children remains the same as current law at 21.06 percent. However, the credit amount for filers with two children would max out at a much higher level: $11,190 under the Cost-of-Living Refund Act of 2019 vs. $5,828 under current law. The result is that the credit phases out over a much larger range of income. Married couples with adjusted gross incomes (AGIs) as high as $77,963 receive the credit under this proposal compared to current law under which only families with income up to $52,493 receive the credit. As a result, married couples with two children with AGIs between $52,493 and $77,963 would face a 21.06 percentage point increase in their effective marginal tax rateThe marginal tax rate is the amount of additional tax paid for every additional dollar earned as income. The average tax rate is the total tax paid divided by total income earned. A 10 percent marginal tax rate means that 10 cents of every next dollar earned would be taken as tax..
Figure 1.
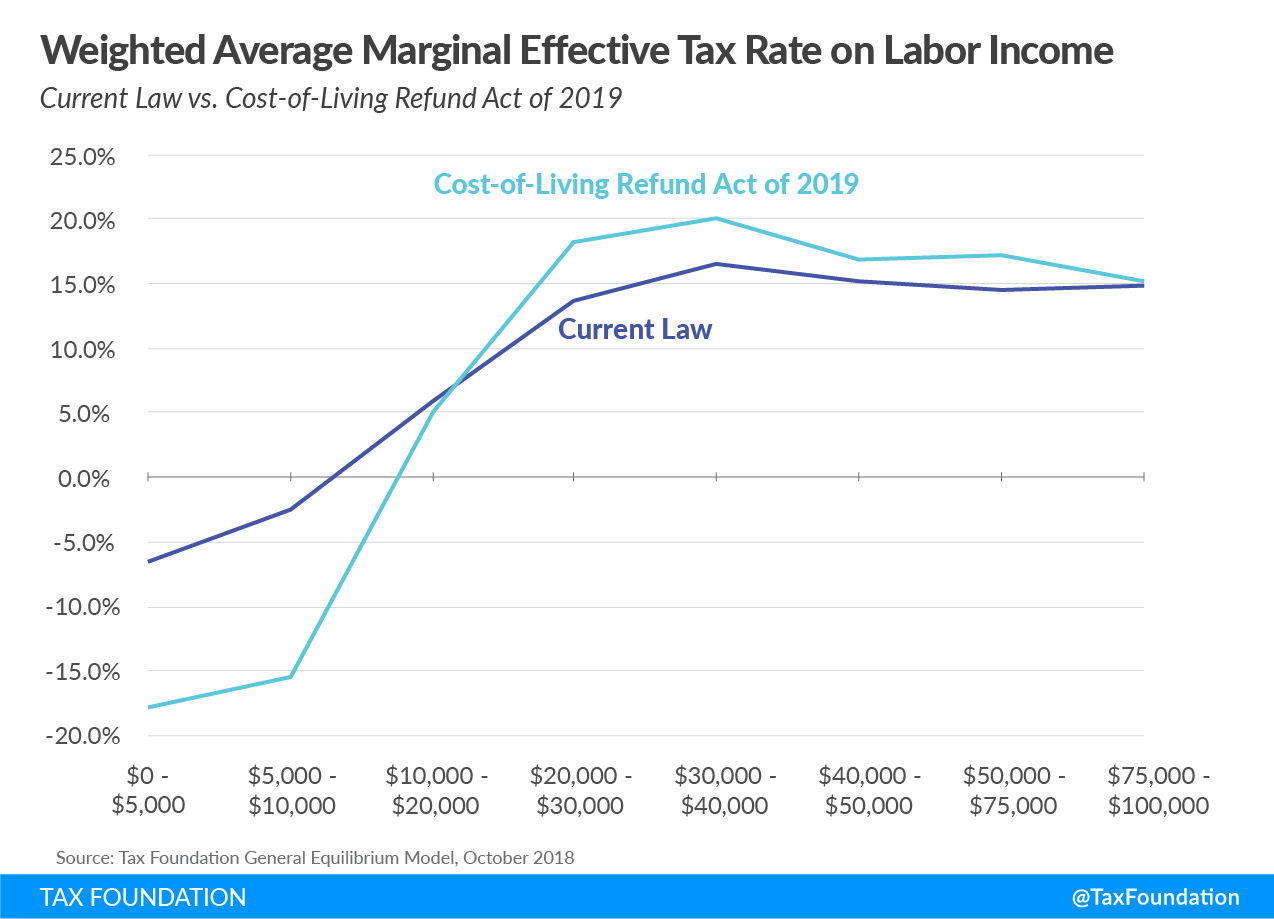
Using the Tax Foundation model, we estimated the change in the weighted average marginal tax rate on wage income for all taxpayers that would be impacted by the Cost-of-Living Refund Act of 2019 (Figure 2). The weighted average marginal tax rate for taxpayers earning between $0-$5,000 would drop by 11.4 percentage points from around -6.5% to -17.9%. Tax filers earning slightly more ($5,000-$10,000) would face an even larger drop from about -2.6% to -15.5%. In contrast, taxpayers earning between $20,000 and $75,000 would face an increase in their marginal effective tax rates due to the phaseout of the credit of between 4.5 percentage points and 0.2 percentage points.
Changes in marginal tax rates on wage income impacts the after-tax returns to work. Workers respond to change in their after-tax wage by either increasing or decreasing their hours worked or their decision to work at all. How responsive individuals are to changes in their after-tax wage can depend on their income level and whether they are a primary or secondary earner in a household. Primary earners and those with higher income tend to be less responsive than low-income individuals and secondary earners to changes in their after-tax wages.[3] Lastly, the decision to work tends to be more sensitive to after-tax wages than the number of hours an individual works.[4]
Figure 2.
Stay informed on the tax policies impacting you.
Subscribe to our free newsletter to get the latest tax data, news and analysis.
SubscribeBudgetary Impact
According to the Tax Foundation Model, the Cost-of-Living Refund Act of 2019 would reduce federal revenue by around $1.8 trillion between 2020 and 2029 (Table 2). In 2020, the Cost-of-Living Refund Act of 2019 would reduce federal revenue by about $167 billion. The cost over the decade would grow as the population grows, and the size of the credit is adjusted each year for inflation. By 2029, the credit would reduce federal revenue by $193.9 billion.
|
Source: Tax Foundation General Equilibrium Model, March 2018 |
|||||||||||
|
Year |
2020 | 2021 | 2022 | 2023 | 2024 | 2025 | 2026 | 2027 | 2028 | 2029 | 2020-2029 |
|---|---|---|---|---|---|---|---|---|---|---|---|
| Static Revenue | -$167.0 | -$166.0 | -$169.0 | -$172.6 | -$176.0 | -$180.2 | -$183.6 | -$187.5 | -$191.2 | -$193.9 | -$1,787.1 |
| Dynamic Revenue | -$170.6 | -$173.5 | -$180.7 | -$185.0 | -$189.0 | -$193.8 | -$198.2 | -$203.0 | -$207.3 | -$211.0 | -$1,912.1 |
On a dynamic basis, the revenue loss would be slightly more than $1.9 trillion over the next 10 years. Output would be lower over the budget window due to slightly lower labor compensation and economic output overall, reducing payroll, corporate, income, and other tax revenue. Overall, the dynamic feedback from this proposal would result in an additional revenue loss of $125 billion over the next decade.
Distributional Impact
The Cost-of-Living Refund Act of 2019 would greatly increase the progressivity of the federal tax code. Taxpayers in the bottom income quintile (0% to 20%) would see the largest increase in after-tax income of 15.4 percent. Taxpayers in the next two quintiles (20% to 40% and 40% to 60%) would see an increase in after-tax income of 8.9 percent and 2.7 percent, respectively. Due to the phaseout of the credit, those in the top 40 percent of taxpayers would see little to no benefit from the Cost-of-Living Refund Act of 2019 credit. Overall, taxpayer after-tax income would rise by 1.5 percent.
|
Source: Tax Foundation General Equilibrium Model, October 2018 |
|
| Income Quintile | Percent Change in After-Tax Income |
|---|---|
| 0% to 20% | 15.4% |
| 20% to 40% | 8.9% |
| 40% to 60% | 2.7% |
| 60% to 80% | 0.0% |
| 80% to 90% | 0.0% |
| 90% to 95% | 0.0% |
| 95% to 99% | 0.0% |
| 99% to 100% | 0.0% |
| TOTAL | 1.5% |
Conclusion
Senator Brown and Representative Khanna introduced a proposal to expand the Earned Income Tax Credit. We estimate that this proposal would reduce federal revenue by $1.8 trillion on a conventional basis and $1.9 trillion on a dynamic basis. It would reduce economic output by 0.29 percent and result in about 51,000 fewer full-time equivalent jobs. However, it would boost full-time equivalent employment for low-income taxpayers by more than 800,000 jobs. Overall, it would greatly increase the progressivity of the U.S. tax code, providing low-income taxpayers a large increase in after-tax income.
Stay informed on the tax policies impacting you.
Subscribe to our free newsletter to get the latest tax data, news and analysis.
SubscribeMethodology
We use the Tax Foundation General Equilibrium Tax Model to estimate the impact of tax policies. The model can produce both conventional and dynamic revenue estimates of tax policy. The model can also produce estimates of how policies impact measures of economic performance such as GDP, wages, employment, capital stock, investment, consumption, saving, and trade deficit. Lastly, it can produce estimates of how different tax policy impacts the distribution of the federal tax burden.[5]
The most recent version of the Tax Foundation model allows for expanded analysis of the labor force. For this analysis we broke the labor force down into three equal groups: low-income, middle-income, and high-income workers. We estimate a wage rate, hours worked, and total labor compensation for each segment of the labor force. Each group also has a specific elasticity, representing their responsiveness to their after-tax wage (bottom third: 0.47, middle third: 0.27, and top third: 0.22). Consistent with the Congressional Budget Office (CBO), these labor force elasticities combine the effect of a policy on the hours worked (the intensive margin) and the decision to enter or exit the labor market (the extensive margin).[6]
The Tax Foundation model estimates the impact of a tax policy on the labor market by the change in total compensation. The change in total compensation is then converted into a full-time jobs equivalent by dividing the change in total labor compensation by the average wage rate. Since this policy impacted three groups of individuals at different income levels our total jobs estimate is the sum of the full-time jobs’ effect of the three groups of taxpayers.
Appendix
|
Note: These values assume that the policy is enacted one year later than was first proposed and all parameters are adjusted for one year of inflation. |
||||
|
EITC Parameters under Current Law |
||||
| No Children | One Child | Two Children | Three or More Children | |
| Phase-in Rate | 7.65% | 34.0% | 40.0% | 45.0% |
| Income at Max Credit | $6,920 | $10,370 | $14,570 | $14,570 |
| Maximum Credit | $529 | $3,526 | $5,828 | $6,557 |
| Phaseout Begins (Single and Head of Household) | $8,650 | $19,030 | $19,030 | $19,030 |
| Phaseout Begins (Married Filing Jointly) | $14,450 | $24,820 | $24,820 | $24,820 |
| Phaseout Rate | 7.65% | 15.98% | 21.06% | 21.06% |
| Phaseout Ends (Single and Head of Household) | $15,570 | $41,094 | $46,703 | $50,162 |
| Phaseout Ends (Married Filing Jointly) | $21,370 | $46,884 | $52,493 | $55,952 |
|
EITC Parameters under Cost-of-Living Refund Act of 2019 (as modeled) |
||||
| No Children | One Child | Two Children | Three or More Children | |
| Phase-in Rate | 30.0% | 65.3% | 76.8% | 86.4% |
| Income at Max Credit | $10,370 | $10,370 | $14,570 | $14,570 |
| Maximum Credit | $3,111 | $6,770 | $11,190 | $12,588 |
| Phaseout Begins (Single and Head of Household) | $19,030 | $19,030 | $19,030 | $19,030 |
| Phaseout Begins (Married Filing Jointly) | $24,830 | $24,830 | $24,830 | $24,830 |
| Phaseout Rate | 15.98% | 15.98% | 21.06% | 21.06% |
| Phaseout Ends (Single and Head of Household) | $38,498 | $61,393 | $72,163 | $78,804 |
| Phaseout Ends (Married Filing Jointly) | $44,298 | $67,193 | $77,963 | $84,604 |
Stay informed on the tax policies impacting you.
Subscribe to our free newsletter to get the latest tax data, news and analysis.
Subscribe[1] “Brown, Khanna, Watson Coleman Propose ‘Cost-Of-Living Refund’ To Help Lift Millions of Americans into Middle Class,” Office of Senator Sherrod Brown, Feb. 13, 2019, https://www.brown.senate.gov/newsroom/press/release/brown-khanna-watson-coleman-propose-cost-of-living-refund_to-help-lift-millions-of-americans-into-middle-class; Also see “Release: Sen. Sherrod Brown and Rep. Ro Khanna Introduce Landmark Legislation to Raise the Wages of Working Families,” Office of Congressman Ro Khanna, Sept. 13, 2017, https://khanna.house.gov/media/press-releases/release-sen-sherrod-brown-and-rep-ro-khanna-introduce-landmark-legislation.
[2] A link to legislative language, https://khanna.house.gov/sites/khanna.house.gov/files/KHANNA_035_xml.pdf.
[3] “How the Supply of Labor Responds to Changes in Fiscal Policy,” Congressional Budget Office, October 2012, https://www.cbo.gov/sites/default/files/112th-congress-2011-2012/reports/43674-laborsupplyfiscalpolicy.pdf.
[4] Robert McClelland and Shannon Mok, “A Review of Recent Research on Labor Supply Elasticities,” Congressional Budget Office, Working Paper 2012-12, October 2012, https://www.cbo.gov/sites/default/files/112th-congress-2011-2012/workingpaper/10-25-2012-recentresearchonlaborsupplyelasticities.pdf.
[5] Stephen J. Entin, Huaqun Li, and Kyle Pomerleau, “Overview of the Tax Foundation’s General Equilibrium Model: April 2018 Update,” Tax Foundation, /wp-content/uploads/2018/04/TaxFoundaton_General-Equilibrium-Model-Overview1.pdf.
[6] “How the Supply of Labor Responds to Changes in Fiscal Policy.”
Share this article