As the end of 2018 approaches, many Americans are considering making end-of-year charitable donations. While the new tax law contains many changes that will impact these decisions, we can look at Internal Revenue Service (IRS) data to gauge how much Americans have deducted for charitable giving in the past.
In taxA tax is a mandatory payment or charge collected by local, state, and national governments from individuals or businesses to cover the costs of general government services, goods, and activities. year 2016, just over 37 million taxpayers took an itemized deductionItemized deductions allow individuals to subtract designated expenses from their taxable income and can be claimed in lieu of the standard deduction. Itemized deductions include those for state and local taxes, charitable contributions, and mortgage interest. An estimated 13.7 percent of filers itemized in 2019, most being high-income taxpayers. for their charitable giving, deducting a total of $236 billion in charitable contributions for an average of $6,349. Note that this doesn’t represent the total amount of giving in the United States, just the amount that eligible taxpayers deducted on their income tax returns. It’s also worth noting that wealthier Americans disproportionately benefit from the charitable deduction overall, as it is high-income taxpayers who tend to itemize their deductions.
Taxes make more sense with us in your inbox.
Subscribe to our newsletter for tax insights that cut through the noise—and make sense of it.
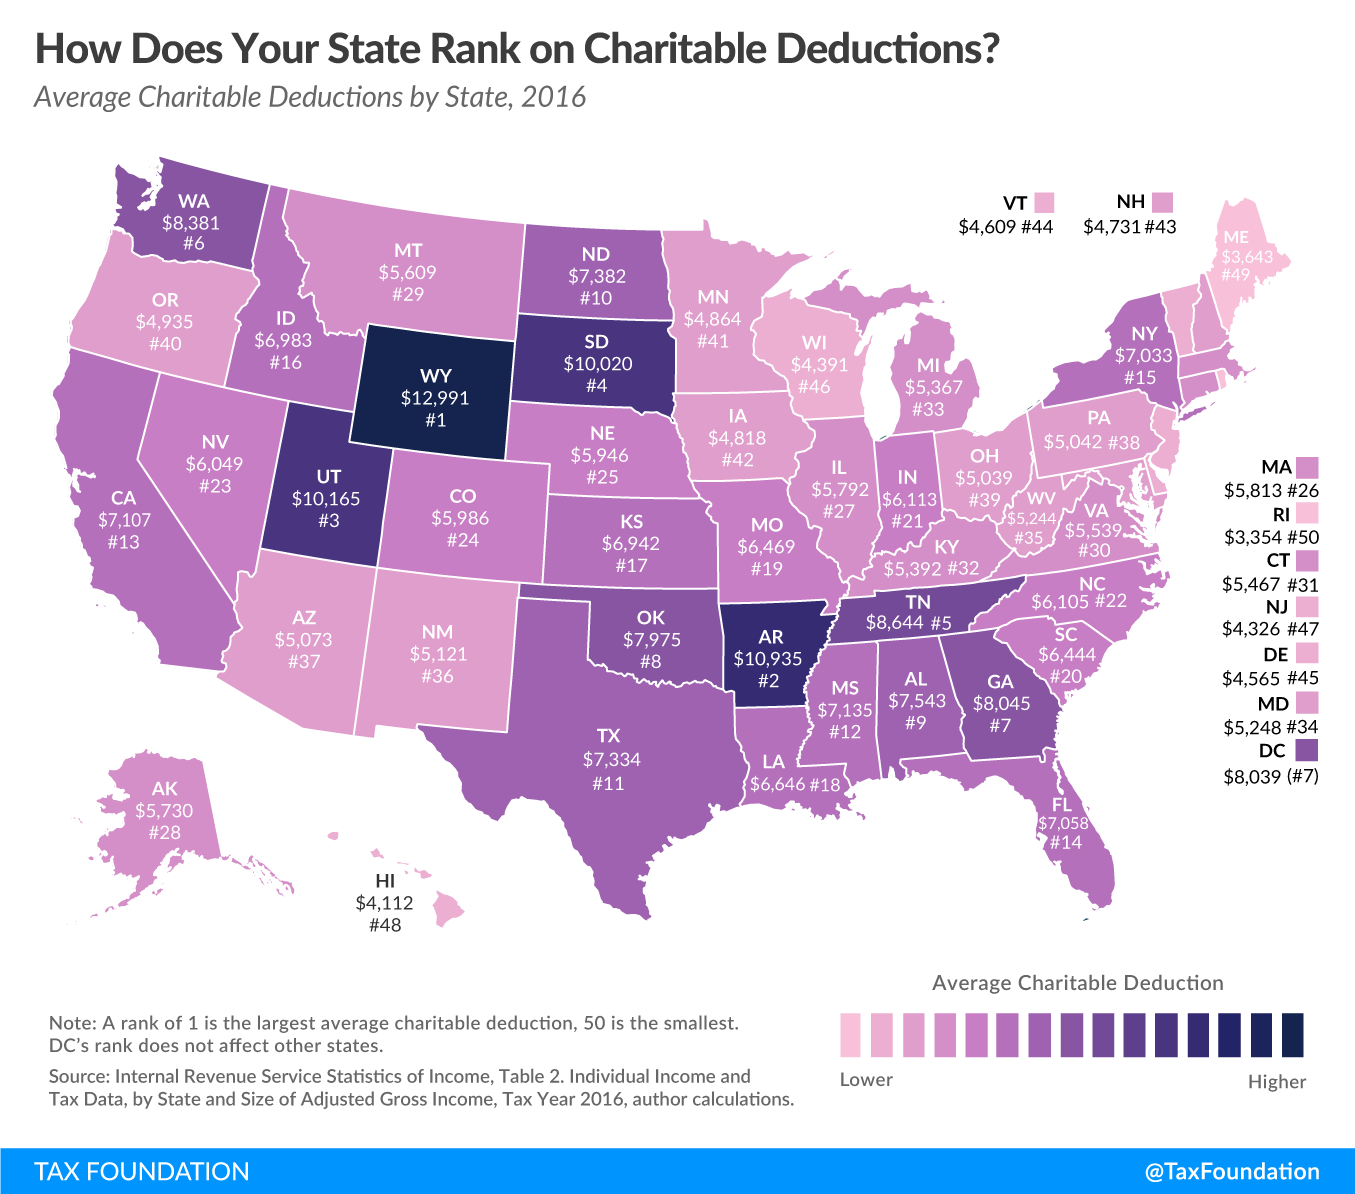
Sign UpFour states had average charitable deductions greater than $10,000 in 2016: Wyoming ($12,991), Arkansas ($10,935), Utah ($10,165), and South Dakota ($10,019). The state with the smallest average, at $3,354, was Rhode Island.
Because the Tax Cuts and Jobs Act greatly increased the standard deductionThe standard deduction reduces a taxpayer’s taxable income by a set amount determined by the government. Taxpayers who take the standard deduction cannot also itemize their deductions; it serves as an alternative., it’s estimated that nearly 30 million households will be better off taking the standard deduction instead of itemizing. While this means tax filing will be simpler, it also means these households will no longer benefit from the charitable contribution deduction.
Lower marginal tax rates under the new law also mean that, for those still taking itemized deductions, their value is lessened. While charitable giving will still be subsidized for these taxpayers, it will be subsidized to a lesser extent.
As millions fewer households will itemize going forward, we should expect forthcoming IRS data to show fewer charitable contribution deductions. What this means for charitable giving overall, however, is less certain. Though some households may decrease their giving, others may use new strategies, such as bunching their donations, or maintaining their giving by making multiple years’ worth of donations at once to have enough to itemize. Given that the tax subsidy for charitable donations has decreased, it would not be surprising if tax-motivated charitable giving decreases as well. However, households make giving decisions for a variety of reasons, many of which are not tax related.
|
Source: Internal Revenue Service Statistics of Income, Table 2. Individual Income and Tax Data, by State and Size of Adjusted Gross Income, Tax Year 2016, author calculations |
||||
|
State |
Rank |
Number of Charitable Deductions |
Amount of Charitable Deductions (in millions) |
Average Charitable Deduction |
|---|---|---|---|---|
| Alabama | 9 | 470,090 | $3,546 | $7,542.61 |
| Alaska | 28 | 57,090 | $327 | $5,729.72 |
| Arizona | 37 | 729,580 | $3,701 | $5,072.62 |
| Arkansas | 2 | 224,470 | $2,455 | $10,935.32 |
| California | 13 | 5,154,350 | $36,634 | $7,107.46 |
| Colorado | 24 | 713,080 | $4,269 | $5,986.40 |
| Connecticut | 31 | 607,150 | $3,319 | $5,466.78 |
| Delaware | 45 | 122,180 | $558 | $4,565.17 |
| D.C. | (7) | 113,460 | $912 | $8,038.71 |
| Florida | 14 | 1,854,220 | $13,087 | $7,057.78 |
| Georgia | 7 | 1,261,830 | $10,151 | $8,044.67 |
| Hawaii | 48 | 163,170 | $671 | $4,111.80 |
| Idaho | 16 | 173,440 | $1,211 | $6,983.28 |
| Illinois | 27 | 1,595,330 | $9,240 | $5,792.19 |
| Indiana | 21 | 570,380 | $3,487 | $6,113.38 |
| Iowa | 42 | 351,620 | $1,694 | $4,817.93 |
| Kansas | 17 | 281,250 | $1,952 | $6,941.88 |
| Kentucky | 32 | 407,570 | $2,198 | $5,392.05 |
| Louisiana | 18 | 374,240 | $2,487 | $6,645.83 |
| Maine | 49 | 135,170 | $492 | $3,642.64 |
| Maryland | 34 | 1,143,160 | $5,999 | $5,247.88 |
| Massachusetts | 26 | 1,048,220 | $6,093 | $5,812.67 |
| Michigan | 33 | 1,064,400 | $5,712 | $5,366.87 |
| Minnesota | 41 | 811,520 | $3,947 | $4,863.68 |
| Mississippi | 12 | 250,380 | $1,786 | $7,135.01 |
| Missouri | 19 | 595,180 | $3,850 | $6,468.83 |
| Montana | 29 | 112,060 | $629 | $5,609.03 |
| Nebraska | 25 | 209,070 | $1,243 | $5,946.21 |
| Nevada | 23 | 292,780 | $1,771 | $6,048.50 |
| New Hampshire | 43 | 170,560 | $807 | $4,731.44 |
| New Jersey | 47 | 1,547,390 | $6,694 | $4,325.77 |
| New Mexico | 36 | 159,060 | $814 | $5,120.70 |
| New York | 15 | 2,784,390 | $19,583 | $7,033.17 |
| North Carolina | 22 | 1,127,090 | $6,881 | $6,104.96 |
| North Dakota | 10 | 49,420 | $365 | $7,382.15 |
| Ohio | 39 | 1,146,570 | $5,778 | $5,039.11 |
| Oklahoma | 8 | 305,930 | $2,440 | $7,975.20 |
| Oregon | 40 | 556,740 | $2,747 | $4,934.87 |
| Pennsylvania | 38 | 1,454,530 | $7,333 | $5,041.54 |
| Rhode Island | 50 | 145,120 | $487 | $3,354.44 |
| South Carolina | 20 | 523,990 | $3,377 | $6,443.86 |
| South Dakota | 4 | 58,100 | $582 | $10,019.97 |
| Tennessee | 5 | 504,460 | $4,361 | $8,644.19 |
| Texas | 11 | 2,275,810 | $16,691 | $7,333.88 |
| Utah | 3 | 401,590 | $4,082 | $10,165.43 |
| Vermont | 44 | 65,610 | $302 | $4,608.79 |
| Virginia | 30 | 1,212,690 | $6,717 | $5,538.82 |
| Washington | 6 | 855,110 | $7,166 | $8,380.77 |
| West Virginia | 35 | 95,190 | $499 | $5,243.70 |
| Wisconsin | 46 | 715,510 | $3,142 | $4,390.81 |
| Wyoming | 1 | 41,690 | $542 | $12,991.08 |
Taxes make more sense with us in your inbox.
Subscribe to our newsletter for tax insights that cut through the noise—and make sense of it.
Sign Up