Urban legends are things that we have all heard and thought to be true, but end up being false. For instance, we’ve all heard stories of poisoned Halloween candy, yet there have never been any documented cases of children poisoned by tampered candy.
The biggest urban legend in Washington is that the Bush-era tax cuts are the cause of our current $1.4 trillion deficit. Indeed, we’ve all heard that the taxA tax is a mandatory payment or charge collected by local, state, and national governments from individuals or businesses to cover the costs of general government services, goods, and activities. cuts were responsible for turning $5.6 trillion in projected surpluses into a sea of red ink. But like the story of tampered Halloween candy, this story turns out to be false too.
Congress’ official scorekeeper, the Congressional Budget Office, recently released a review [here] of the budget estimate they issued in January 2001 and the factors that turned their $5.6 trillion surplus projection into $6.2 trillion in cummulative deficits by 2011.
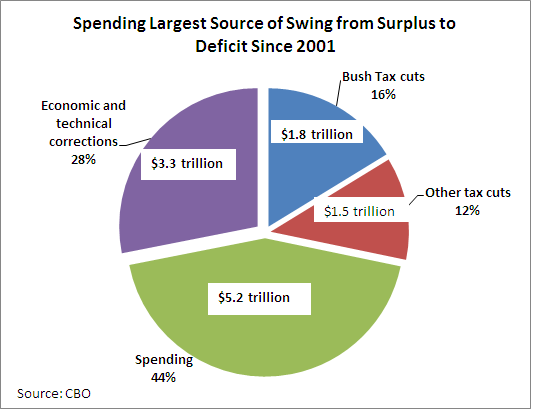
The pie chart below breaks down the major components of the $11.8 trillion swing from surpluses to deficits over the ten year period 2002 to 2011. Higher spending turns out to be the largest factor erasing those surplus projections, comprising 44 percent of the ten-year swing. Over the past ten years, spending was $5.2 trillion higher than what CBO projected it would be in 2001. [These figures include the interest costs associated with the higher spending]. Discretionary spending accounts for 68 percent of this total.

Contributing roughly equally to the $11.8 trillion swing were economic and technical corrections (i.e. forecasting errors) and tax cuts, each accounting for 28 percent of the change. The Bush-era tax cuts (2001, 2003, and 2004) comprise just 16 percent, or $1.8 trillion, of the overall swing from surpluses to deficits [including interest costs]. The other tax cuts, such as the 2008 and 2010 stimulus bills, contributed about 12 percent to the deficit swing.
If we look at how these factors have changed over the past ten years, it becomes obvious that the Bush-era tax cuts have been declining as a contributing factor to the swing to deficits. Indeed, the area chart below shows that in 2011, the Bush-era tax cuts account for only 6 percent of the current swing to deficits. By contrast, higher spending accounts for 42 percent of the change, while economic and technical factors account for 28 percent of the change.
Urban myths are difficult to put to rest, but perhaps these CBO figures can help dispel the myth that the Bush-era tax cuts contributed to Washington’s current fiscal mess.
