Can an organization rightfully be called a “nonprofit” if it almost always makes money? And what if most of that organization’s income comes from “business income,” should it legitimately be considered a “charity”?
Those are the questions lawmakers should ask of the more than 218,000 organizations and entities that have been designated as 501(c)(3) taxA tax is a mandatory payment or charge collected by local, state, and national governments from individuals or businesses to cover the costs of general government services, goods, and activities. -exempt nonprofit organizations.
(And that’s coming from a nonprofit organization—Tax Foundation itself is organized as a 501(c)(3).)
Based on IRS data, 501(c)(3) tax-exempt nonprofit organizations have never been financially healthier than they are today. In 2019, the latest data available, revenues from charitable donations reached a record high in both nominal and inflationInflation is when the general price of goods and services increases across the economy, reducing the purchasing power of a currency and the value of certain assets. The same paycheck covers less goods, services, and bills. It is sometimes referred to as a “hidden tax,” as it leaves taxpayers less well-off due to higher costs and “bracket creep,” while increasing the government’s spending power. -adjusted terms.
Moreover, total revenues—including government grants and program service income—also reached record levels. Total nonprofit revenues now equal 12 percent of GDP.
IRS data also indicates that in the 31 years between 1988 and 2019, the nonprofit sector has suffered just one year of deficits, in 2008. Adjusted for inflation, sector surpluses have averaged $110 billion per year over the past three decades.
And the number of nonprofits has grown steadily over the past 30 years, from 124,233 in 1988 to 218,516 in 2019, an increase of nearly 100,000 new tax-exempt nonprofit organizations. Clearly, the industry seems quite resilient.
TCJA Did Not Cause a Slump in Charitable Giving
Despite the record income and record “profits” nonprofits have enjoyed lately, some members of Congress have joined with leading charitable organizations in calling for an above-the-line charitable deduction in response to the perception that the 2017 Tax Cuts and Jobs Act (TCJA) damped the tax benefits of charitable giving.
Advocates claim TCJA’s near doubling of the standard deductionThe standard deduction reduces a taxpayer’s taxable income by a set amount determined by the government. It was nearly doubled for all classes of filers by the 2017 Tax Cuts and Jobs Act (TCJA) as an incentive for taxpayers not to itemize deductions when filing their federal income taxes. has impacted charitable giving. The increased value of the standard deduction dramatically reduced the number of taxpayers who needed to itemize their deductions, from 38 million in 2017 to 15 million in 2018, a 60 percent decline. Advocates worry that because fewer taxpayers itemize, fewer are incentivized by the tax benefit of giving charitably.
IRS data refutes this. The nearby table shows that charitable contributions and total nonprofit revenues were both higher in 2018 and 2019 than in 2016 in inflation adjusted dollars. Some may point to the fact that charitable giving in 2018 was less than in 2017. But 2017 was an anomaly as many taxpayers increased their charitable contributions to take advantage of the higher income tax rates before TCJA cut rates the following year. At best, 2017 represents a shift in giving from the future to the present, not a benchmark to compare post-TCJA donations.
The more accurate comparison is to 2016, the year before TCJA was enacted. Indeed, charitable contributions in 2019 are 11 percent higher than 2016 levels, clearly not a slump in donations because of the increased standard deduction.
Key Financial Data for 501(c)(3) Nonprofit Organizations: Before and After the 2017 Tax Cuts and Jobs Act
| (in Billions of Constant 2021 Dollars) | 2016 | 2017 | 2018 | 2019 |
|---|---|---|---|---|
| Total Revenues | $2,419 | $2,569 | $2,532 | $2,608 |
| Government Grants | $204 | $207 | $204 | $240 |
| Charitable Contributions | $275 | $290 | $279 | $305 |
| Program Service Revenue | $1,747 | $1,831 | $1,838 | $1,846 |
| All Other Revenues (Rents, Interest, Investments, etc.) | $193 | $242 | $210 | $216 |
| Total Expenditures | $1,747 | $1,831 | $1,838 | $1,846 |
| Surpluses (+)/Deficits (-) | $126 | $183 | $124 | $152 |
Thirty Years of Nonprofit Growth
IRS data shows that tax-exempt nonprofits have done very well over the past thirty years. The nearby chart illustrates that between 1988 and 2019, charitable contributions grew in real terms by more than 300 percent, from $74 billion to $305 billion, outpacing the growth in government grants. While charitable contributions have ebbed and flowed over the years with the economy, the path has been upward irrespective of the many tax code changes during the period.
The chart clearly shows that total nonprofit revenues have also enjoyed three decades of growth, rising in real terms from $812 billion in 1988 to more than $2.6 trillion in 2019, an increase of 221 percent. In both nominal and inflation-adjusted figures, 2019 is by far the highest level of nonprofit revenues in the past thirty years.
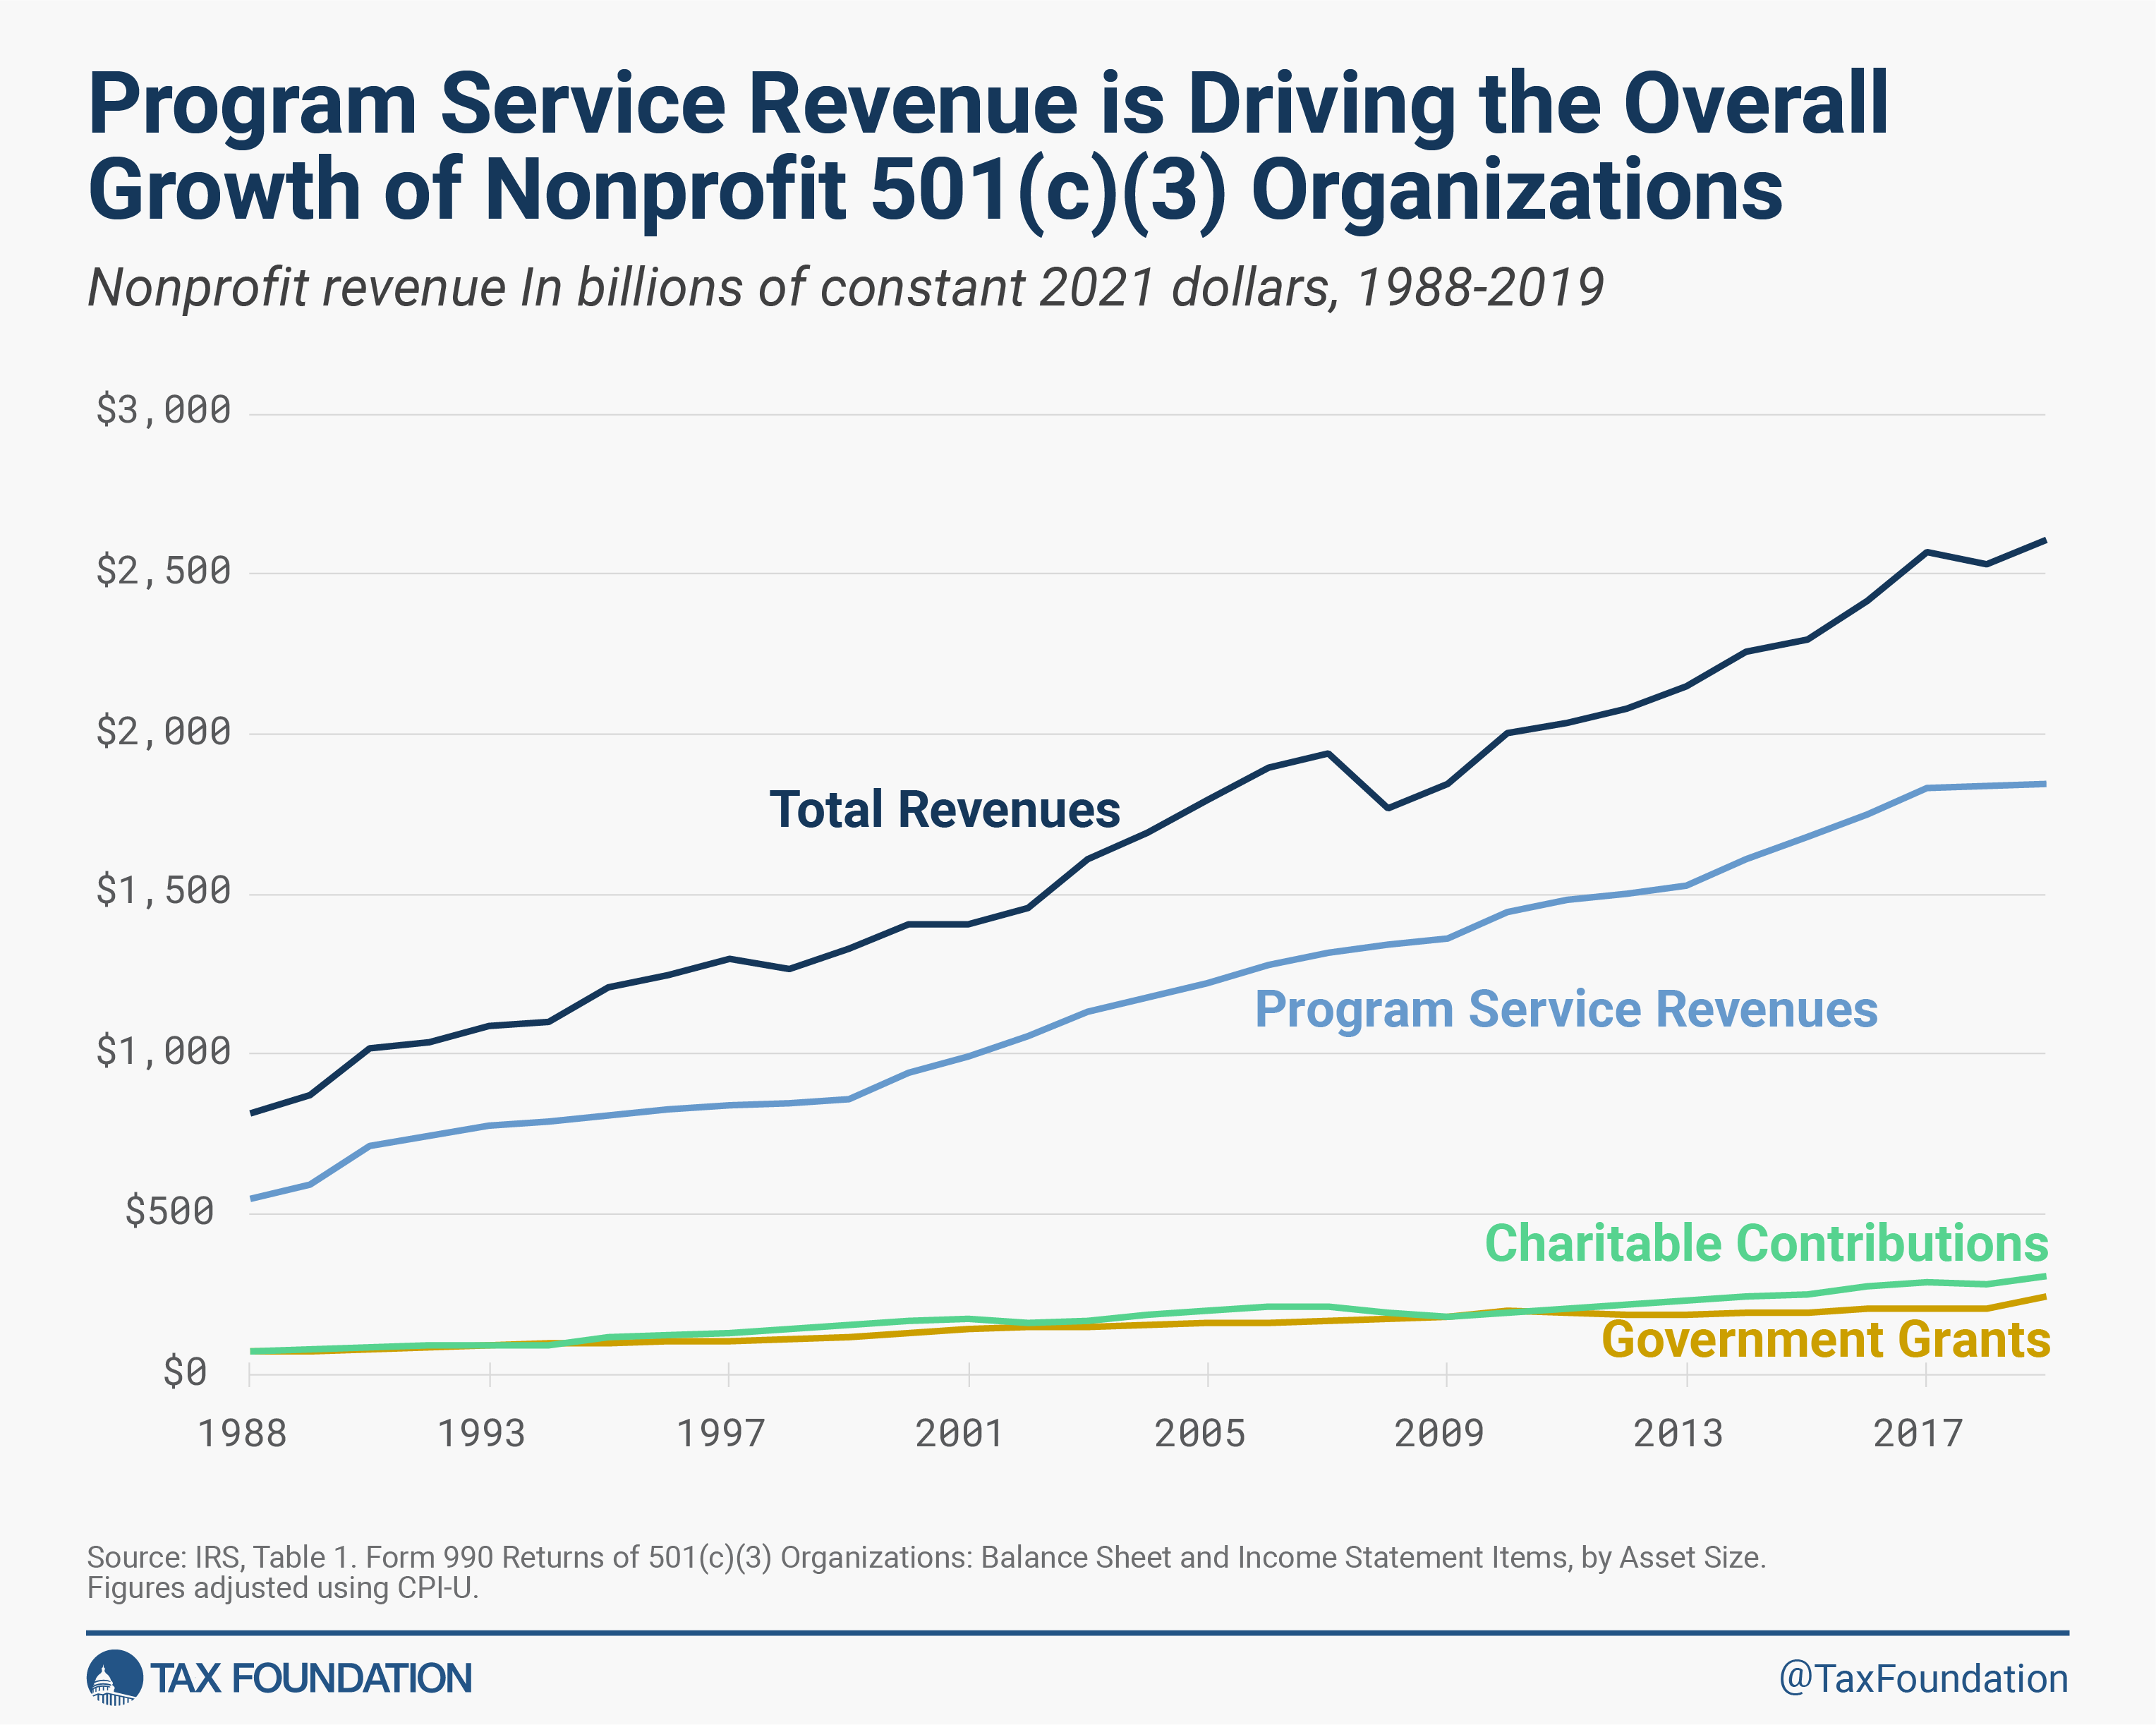
The Real Story is Growth in Program Service Revenues
The issue advocates overlook in the debate over the charitable deduction is how little nonprofits receive in charitable contributions compared to how dependent they are on program service revenues.
Program service revenues encompass a spectrum of income sources, including tuition, payments for medical expenses, payments from Medicare and Medicaid, ticket sales, broadcast rights, conference fees, and government contracts. Nearly all such revenue is exempt from federal income taxes for nonprofits.
The nearby chart shows how the growth in program service revenues has driven the overall growth in nonprofit revenues over the past 30 years, rising from $548 billion in today’s dollars, to more than $1.8 trillion—an increase of 310 percent.
Program service revenues comprised 71 percent of nonprofit revenues in 2019, up from 67 percent in 1988. The high-water mark for program service revenues was in 2008 when it reached 76 percent of nonprofit revenues.
Contrary to the image of charitable organizations, program service revenues—once called “business receipts”—have been the dominant source of revenues for nonprofit organizations for decades. A 1987 Government Accountability Office (GAO) analysis of competition between taxable businesses and tax-exempt organizations reported that in 1946, “business receipts” comprised 46 percent of total revenues for 501(c)(3) organizations while donations comprised 36 percent.
Comparable data for “business receipts” are not available for intervening years, but revenues other than contributions—mostly comprised of program service income—continued to grow into the 1980s while donations fell as a share of overall nonprofit revenues. By 1975, contributions had fallen to 27 percent of revenues, and further to 18 percent by 1982. By 2019, charitable contributions comprised 12 percent of nonprofit revenues.
Nonprofit Hospitals and Private Universities are Big Businesses
Digging below the topline numbers, data shows the majority of program service revenues are generated by nonprofit hospitals, health care systems, and private universities.
Indeed, thanks to 2019 IRS nonprofit data made available through the Urban Institute’s Center for Charitable Statistics Data Archive, nonprofit organizations can be separated into 26 categories ranging from arts and culture to social science and technology.
By far, the largest sector of nonprofits are hospitals, with nearly $1 trillion of total revenues in 2019. In addition, health care systems generated total revenues of nearly $375 billion, while mental health facilities added another $40 billion in revenues. Total revenues for the nonprofit health care sector were more than $1.4 trillion—more than half of all nonprofit revenues. The sector reported net income (i.e., untaxed profits) of more than $62 billion in 2019.
Program service revenues for the health care sector totaled nearly $1.3 trillion, or 90 percent of the sector’s revenue. Were these organizations for-profit corporations, every net dollar would be taxable at 21 percent.
Private universities generated more than $294 billion in revenues in 2019, nearly 70 percent of which was program service revenues from tuition, ticket sales, and other businesslike income. This does not include more than $3 billion in revenues generated by college athletic associations, such as the National Collegiate Athletic Association (NCAA) and the Big 10 Conference. Nearly all of the income of these organizations is from selling broadcast rights to television and radio networks, revenues that would be taxed if these organizations were for-profit firms.
The Issue: $2.6 trillion in Mostly Untaxed Income
To be sure, certain nonprofit organizations report no businesslike revenues and survive only on charitable donations. However, even this income escapes taxation because of the way the tax code provides a deduction for the donor and exempts from tax the income received by the nonprofit. In tax parlance, it is called double non-tax income because the income is not taxed at either the individual level or at the organization level.
The Urban Institute’s dataset also identifies a number of large organizations (some with incomes over $1 billion) that provide consulting, research, and analysis for the government and for-profit companies. This income also escapes tax because the payments for service by the companies are deductible as a business expense and not taxed at the organization level. Of course, the government pays no tax on its income.
A small amount of nonprofit revenues are taxed if they are tangential to the main mission of the nonprofit. This is called unrelated business income. However, the definition of unrelated business income is so narrow that few nonprofits actually pay it. In 2017, the latest data available, roughly 40,000 501(c)(3) organizations reported $10.5 billion in gross unrelated business income, but just $1.7 billion in net income. So, after deducting expenses, just 24,000 organizations paid roughly $469 million in taxes on that income.
The 501(c)(3) nonprofit sector needs a complete rethink. First, the data shows that the sector is healthy financially, weakening the argument that the sector needs a larger tax deductionA tax deduction is a provision that reduces taxable income. A standard deduction is a single deduction at a fixed amount. Itemized deductions are popular among higher-income taxpayers who often have significant deductible expenses, such as state and local taxes paid, mortgage interest, and charitable contributions. for charitable giving. Second, allowing organizations to generate billions of dollars in income free of taxes while competing against tax-paying firms is unfair and distorts the meaning of nonprofit. It was certainly not what Congress intended when it created the nonprofit designation in the first place.
Stay informed on the tax policies impacting you.
Subscribe to get insights from our trusted experts delivered straight to your inbox.
Subscribe