Key Findings
- States have paid out $175 billion in unemployment benefits since the start of the pandemic, with the federal government providing an additional $660 billion.
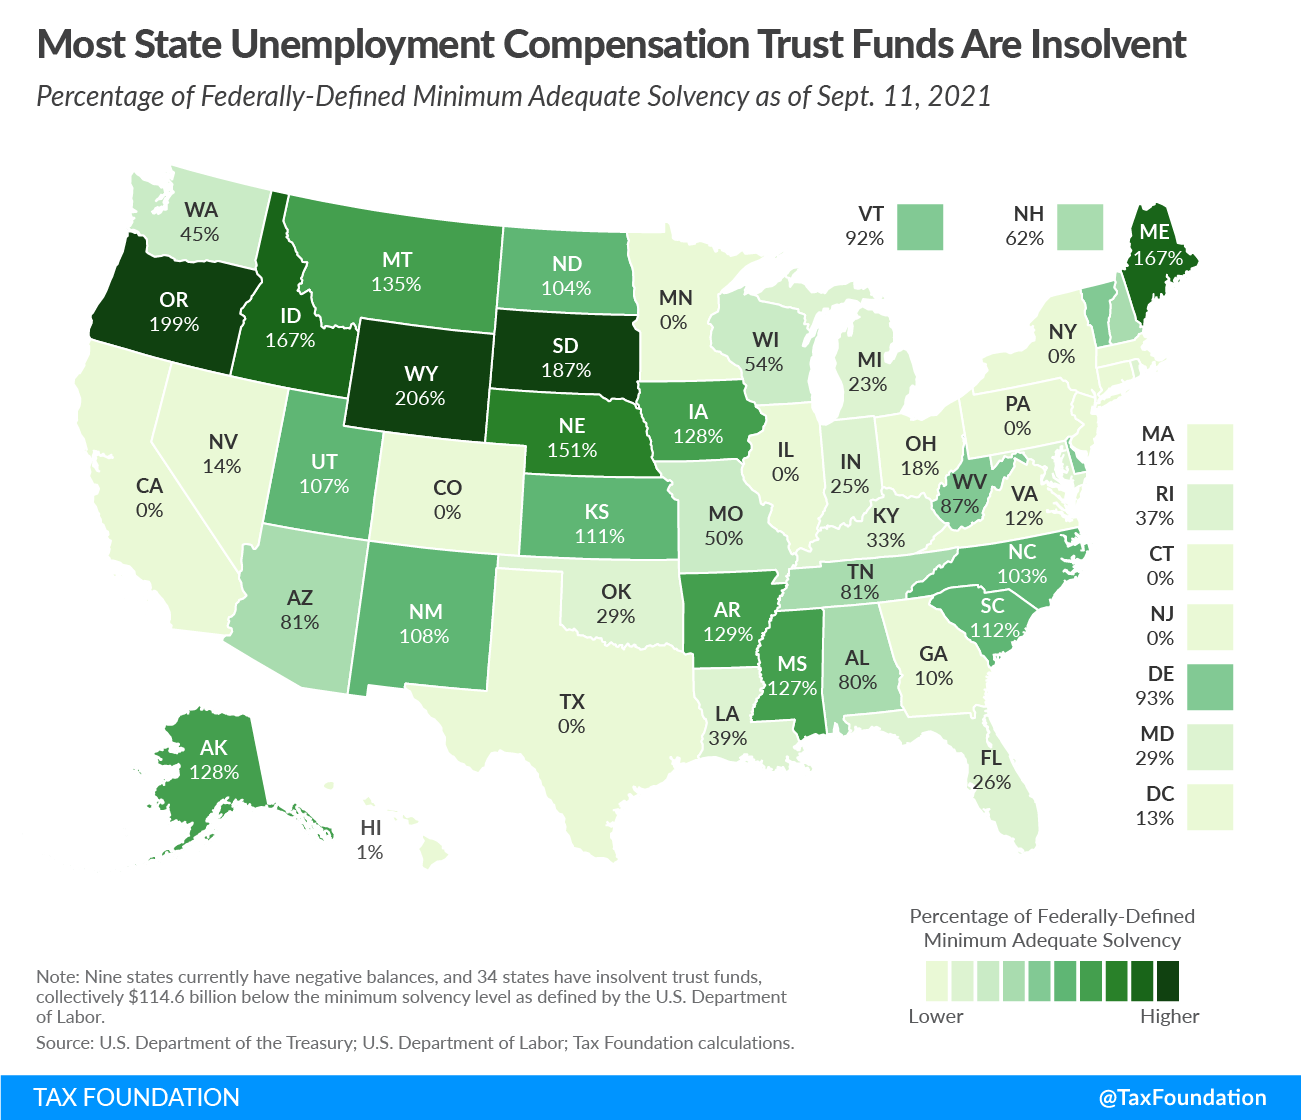
- Taking debt into account, state trust funds now have a negative aggregate balance of -$11 billion and are $115 billion shy of minimum adequate solvency levels.
- States are authorized to use federal Fiscal Recovery Funds to replenish unemployment compensation trust funds to pre-pandemic levels, but as of late January 2022 (updated data), have only used $9 billion of the nearly $95 billion available to them for this purpose.
- Given the restrictions on the use of this federal funding, and the significantly higher taxA tax is a mandatory payment or charge collected by local, state, and national governments from individuals or businesses to cover the costs of general government services, goods, and activities. burdens on employment that will result if trust funds are not replenished, applying federal aid to these trust funds should be an urgent priority.
States are permitted to replenish their unemployment compensation (UC) trust funds using the $195.3 billion they received in Fiscal Recovery Funds under the American Rescue Plan Act (ARPA)—and they need the help, having paid out $175 billion in state-funded benefits since the start of the pandemic, in addition to the $661 billion shelled out by the federal government in extended and expanded benefits, for a total of about $836 billion between January 27, 2020 and September 11, 2021.[1]
| State and Federally Funded Unemployment Benefit Payments by State through Sept. 11, 2021 | |||
|---|---|---|---|
| State | State Spending | Federal Spending | Total Spending |
| Alabama | $904,939,512 | $4,118,109,266 | $5,023,048,778 |
| Alaska | $410,608,175 | $951,349,974 | $1,361,958,149 |
| Arizona | $1,709,394,643 | $12,142,971,075 | $13,852,365,718 |
| Arkansas | $492,909,337 | $2,828,020,319 | $3,320,929,656 |
| California | $31,120,090,836 | $129,494,293,807 | $160,614,384,643 |
| Colorado | $3,503,626,603 | $8,975,692,597 | $12,479,319,200 |
| Connecticut | $2,704,960,696 | $7,237,039,626 | $9,942,000,322 |
| Delaware | $373,094,638 | $1,081,593,661 | $1,454,688,299 |
| District of Columbia | $791,471,551 | $1,961,353,167 | $2,752,824,718 |
| Florida | $3,737,556,325 | $25,422,717,453 | $29,160,273,778 |
| Georgia | $4,788,983,519 | $17,423,787,992 | $22,212,771,511 |
| Hawaii | $1,831,144,119 | $4,306,572,321 | $6,137,716,440 |
| Idaho | $327,522,174 | $952,112,434 | $1,279,634,608 |
| Illinois | $9,048,636,342 | $25,723,107,696 | $34,771,744,038 |
| Indiana | $2,038,557,810 | $8,463,158,989 | $10,501,716,799 |
| Iowa | $1,479,366,017 | $2,904,076,132 | $4,383,442,149 |
| Kansas | $1,241,508,125 | $2,107,630,729 | $3,349,138,854 |
| Kentucky | $1,749,005,051 | $5,031,720,488 | $6,780,725,539 |
| Louisiana | $1,680,436,504 | $7,733,274,439 | $9,413,710,943 |
| Maine | $682,806,857 | $2,009,901,985 | $2,692,708,842 |
| Maryland | $2,147,798,063 | $12,698,164,588 | $14,845,962,651 |
| Massachusetts | $7,604,490,246 | $26,303,480,707 | $33,907,970,953 |
| Michigan | $6,227,159,077 | $31,062,539,063 | $37,289,698,140 |
| Minnesota | $4,381,289,491 | $10,285,476,575 | $14,666,766,066 |
| Mississippi | $727,551,144 | $3,627,963,955 | $4,355,515,099 |
| Missouri | $1,440,803,208 | $5,080,480,774 | $6,521,283,982 |
| Montana | $355,276,108 | $1,063,209,741 | $1,418,485,849 |
| Nebraska | $423,408,402 | $1,000,143,530 | $1,423,551,932 |
| Nevada | $3,643,131,019 | $9,087,775,425 | $12,730,906,444 |
| New Hampshire | $418,921,221 | $1,457,810,349 | $1,876,731,570 |
| New Jersey | $7,208,202,637 | $25,817,043,829 | $33,025,246,466 |
| New Mexico | $1,088,341,718 | $3,289,162,574 | $4,377,504,292 |
| New York | $17,508,236,594 | $79,437,908,220 | $96,946,144,814 |
| North Carolina | $1,765,125,483 | $11,510,240,420 | $13,275,365,903 |
| North Dakota | $464,840,143 | $776,769,868 | $1,241,610,011 |
| Ohio | $4,771,669,589 | $19,194,721,073 | $23,966,390,662 |
| Oklahoma | $2,144,095,549 | $3,653,976,604 | $5,798,072,153 |
| Oregon | $2,724,179,606 | $7,613,898,564 | $10,338,078,170 |
| Pennsylvania | $8,684,373,910 | $39,646,174,102 | $48,330,548,012 |
| Rhode Island | $812,596,212 | $2,977,630,965 | $3,790,227,177 |
| South Carolina | $1,274,417,737 | $5,101,065,761 | $6,375,483,498 |
| South Dakota | $130,877,384 | $278,576,746 | $409,454,130 |
| Tennessee | $1,714,407,724 | $6,102,976,375 | $7,817,384,099 |
| Texas | $13,389,250,574 | $38,370,985,294 | $51,760,235,868 |
| Utah | $777,909,903 | $1,388,486,388 | $2,166,396,291 |
| Vermont | $468,467,459 | $1,262,268,502 | $1,730,735,961 |
| Virginia | $2,642,109,461 | $11,281,093,770 | $13,923,203,231 |
| Washington | $5,358,988,425 | $15,100,660,941 | $20,459,649,366 |
| West Virginia | $662,834,307 | $1,765,878,081 | $2,428,712,388 |
| Wisconsin | $2,098,362,893 | $4,799,528,292 | $6,897,891,185 |
| Wyoming | $228,202,104 | $329,179,667 | $557,381,771 |
| Puerto Rico | $1,224,387,936 | $143,464,598 | $1,367,852,534 |
| Virgin Islands | $57,916,078 | $8,566,890,755 | $8,624,806,833 |
| Totals | $175,186,240,242 | $660,944,110,246 | $836,130,350,488 |
|
Note: Begins January 27, 2020, which is used by the American Rescue Plan Act as the benchmark for pre-pandemic trust fund levels. Sources: U.S. Department of the Treasury; U.S. Department of Labor; Tax Foundation calculations. |
|||
To put these amounts in context: states distributed at about 350 percent of their normal benefit payment levels for the period, exhausting their trust funds and in many cases forcing them to resort to repayable federal loans (called Title XII Advances), while the federal government, which only typically funds a share of extended benefits, has already spent nine times what it did during the Great RecessionA recession is a significant and sustained decline in the economy. Typically, a recession lasts longer than six months, but recovery from a recession can take a few years. . In fact, governments have paid out almost as much in benefits since the start of the pandemic (pegged at January 27, 2020 for unemployment compensation purposes) as they did from January 1, 2001 until the pandemic began—a period that covers two recessions, including the Great Recession.[2] Benefit payments during this period have been almost 20 times higher than they were in the equivalent pre-pandemic calendar period.
Pre-pandemic trust fund balances stood at $72.5 billion. Today, aggregate trust fund balances are negative, at -$11.1 billion, reflecting $44.8 billion in indebtedness currently incurred by 10 states and the U.S. Virgin Islands. By federal standards, 34 state accounts are currently insolvent, with $114.6 billion needed to bring them all up to what the federal government regards as minimum adequate levels.
Stay informed on the tax policies impacting you.
Subscribe to get insights from our trusted experts delivered straight to your inbox.
SubscribeMeanwhile, 42 states and the District of Columbia are eligible to use up to a combined $94.7 billion of their ARPA allocations to refill the coffers of their unemployment insurance trust funds (including the $9 billion already used for this purpose), which would go a long way to restoring their fiscal health.
Under ARPA, states are permitted to use Fiscal Recovery Funds not only to pay off Title XII Advances, but also to replenish their trust funds to pre-pandemic levels—defined as levels as of January 27, 2020.[3] State trust fund balances are, on net, $83.6 billion lower than they were at the start of the pandemic, but the authorized amount to restore states to pre-pandemic balances is slightly higher because 11 states have higher UC trust fund balances now than they did pre-pandemic, largely due to earlier infusions of $7.5 billion in federal aid under the Coronavirus Aid, Relief, and Economic Security (CARES) Act.
To date, 15 states have applied Fiscal Recovery Funds to restocking their funds, for a total of just under $9 billion,[4] well shy of the $94.7 billion states could use for this purpose. Even among the states that have used ARPA funding, significant amounts are often still unauthorized.
Additionally, at least 23 states used Coronavirus Relief Fund moneys available under the CARES Act to pay out claims or otherwise replenish their trust funds, to the tune of about $7.5 billion.[5] All told, 31 states have applied at least some portion of CARES or ARPA funding to their UC trust funds, for a total of $15.4 billion in transfers. Some states have remaining CARES Act balances that could be used for UC purposes, but even focusing exclusively on authorized levels for Fiscal Recovery Funds under ARPA, states are still leaving $83.7 billion on the table.
| State Dedication CARES and ARPA Funding to UC Trust Funds, and Remaining ARPA Authorization | ||||
|---|---|---|---|---|
| Federal Aid Spent on UI | ||||
| State | CARES | ARPA | Total | Still Available (ARPA) |
| Alabama | — | — | — | $89 |
| Alaska | — | — | — | $182 |
| Arizona | — | $759 | $759 | $0 |
| Arkansas | $165 | — | $165 | $16 |
| California | $6 | — | $6 | $21,999 |
| Colorado | — | — | — | $2,029 |
| Connecticut | — | $155 | $155 | $1,052 |
| Delaware | $209 | — | $209 | $0 |
| District of Columbia | — | — | — | $464 |
| Florida | — | — | — | $3,072 |
| Georgia | $2,200 | — | $2,200 | $2,274 |
| Hawaii | — | $700 | $700 | $594 |
| Idaho | $200 | — | $200 | $0 |
| Illinois | — | — | — | $5,755 |
| Indiana | $400 | $500 | $900 | $447 |
| Iowa | $490 | $238 | $728 | $0 |
| Kansas | — | $500 | $500 | $196 |
| Kentucky | — | $575 | $575 | $242 |
| Louisiana | $85 | $490 | $575 | $747 |
| Maine | $295 | $80 | $375 | $27 |
| Maryland | — | — | $830 | $0 |
| Massachusetts | — | — | — | $1,208 |
| Michigan | — | — | — | $3,655 |
| Minnesota | — | — | — | $2,629 |
| Mississippi | $182 | — | $182 | $113 |
| Missouri | $300 | — | $300 | $434 |
| Montana | $200 | — | $200 | $0 |
| Nebraska | $427 | — | $427 | $0 |
| Nevada | — | $335 | $335 | $1,747 |
| New Hampshire | $50 | — | $50 | $119 |
| New Jersey | — | — | — | $2,920 |
| New Mexico | $194 | $657 | $851 | $17 |
| New York | — | — | — | $11,414 |
| North Carolina | — | — | — | $925 |
| North Dakota | $260 | — | $260 | $0 |
| Ohio | — | $1,500 | $1,500 | $661 |
| Oklahoma | — | — | — | $859 |
| Oregon | — | — | — | $645 |
| Pennsylvania | — | — | — | $3,985 |
| Rhode Island | — | — | — | $333 |
| South Carolina | $500 | — | $500 | $0 |
| South Dakota | $100 | — | $100 | $0 |
| Tennessee | $400 | — | $400 | $141 |
| Texas | — | — | — | $7,660 |
| Utah | — | $100 | $100 | $381 |
| Vermont | — | — | — | $274 |
| Virginia | $210 | $862 | $1,072 | $0 |
| Washington | $80 | $500 | $580 | $2,817 |
| West Virginia | $502 | — | $502 | $0 |
| Wisconsin | — | — | — | $877 |
| Wyoming | $25 | — | $25 | $24 |
| Totals | $7,480 | $8,780 | $16,260 | $83,024 |
|
Sources: National Conference of State Legislatures; U.S. Department of the Treasury; U.S. Department of Labor; Tax Foundation calculations. |
||||
Replenishing these trust funds using ARPA dollars is an urgent priority for several reasons. States which have not used any of their Fiscal Recovery Funds for that purpose—or which have only used a modest amount—should look to them as a source of important relief.
First, state revenues have fared quite well during the pandemic, and, coupled with generous federal assistance, most states find they are on a financially secure footing—these depleted trust funds being the one glaring exception.[6] Given the constraints on how ARPA money can be spent, many states are struggling to find high-priority ways to utilize the glut of federal aid.[7] Rather than spending the money on low-value projects that never would have been considered otherwise, or creating new spending programs which will be difficult to sustain once federal assistance runs out, lawmakers should apply the money to one of their most pressing needs: addressing the unemployment compensation trust fund crisis.
Second, inadequate fund balances incur financial penalties for businesses and state governments alike. The federal government maintains a calculation of minimum adequate solvency levels, and when states are insolvent going into a year when they incur or maintain indebtedness to the federal account, that insolvency triggers interest payments on outstanding debt. These interest obligations were temporarily suspended for all states—regardless of initial solvency—but was reinstated for states in arrears as of September 6, 2021.
Additionally, unpaid Title XII Advances ultimately yield higher federal unemployment insurance taxes for businesses in those states. The federal unemployment insurance tax of 6 percent is usually abated by a 90 percent credit, reducing it to a nominal 0.6 percent tax on a $7,000 wage base. The credit is reduced each additional year a state remains in debt, however, creating charges for in-state businesses that do nothing to fill state accounts.
Third, replenishing these funds through tax revenues would require years of astronomically high tax rates on employment. Unemployment insurance tax rates on businesses rise automatically when trust fund balances are low, and many states have intervened to limit the size—and delay the implementation—of these automatic rate increases.
In Maryland, for instance, Gov. Larry Hogan (R) issued an executive order to forestall a projected 600 percent increase in unemployment insurance (UI) taxes for businesses with no layoffs whatsoever, and far more for businesses that were forced to lay off employees during the pandemic. Pre-pandemic, an employer with no history of layoffs paid a low $25.50 per employee in Maryland. Absent the governor’s intervention, a company forced to lay people off could pay as much as $1,147.50 per remaining employee—a stunning 4,400 percent increase.[8] New Jersey, meanwhile, initially delayed UI tax hikes, but is now phasing in an $885 million tax increase over three years to begin refilling its UC coffers (beginning with a $252 billion increase in October 2021),[9] even though it has not used any of its $6.2 billion in Fiscal Recovery Funds for the purpose.
And finally, the Fiscal Recovery Funds offer a lifeline that states have never had before: a chance to wipe out the losses from the economic downturn, allowing states to focus on building up their funds for the next recession, rather than using the good years to pay down debts racked up during the last downturn. Too often, these funds have been backward-looking, with UI taxes used to pay off previously accumulated debt rather than to prepare for the future.
With almost $45 billion in outstanding Title XII Advances and aggregate net balances of -$11.1 billion, using a substantial share of remaining Fiscal Recovery Fund balances to restore unemployment compensation trust funds to pre-pandemic levels is one of the most responsible things states can do with the money.
| Current Trust Fund Balances and Title XII Advance Indebtedness by State | |||
|---|---|---|---|
| State | Trust Fund Balance | Outstanding Debt | Net Balance |
| Alabama | $608,727,011 | — | $608,727,011 |
| Alaska | $309,221,925 | — | $309,221,925 |
| Arizona | $1,167,555,862 | — | $1,167,555,862 |
| Arkansas | $826,386,348 | — | $826,386,348 |
| California | $470,335,733 | $19,436,629,716 | -$18,966,293,982 |
| Colorado | $114,969,552 | $1,014,167,919 | -$899,198,367 |
| Connecticut | $338,146,449 | $725,070,963 | -$386,924,514 |
| Delaware | $233,487,255 | — | $233,487,255 |
| District of Columbia | $53,920,660 | — | $53,920,660 |
| Florida | $981,310,448 | — | $981,310,448 |
| Georgia | $265,688,322 | — | $265,688,322 |
| Hawaii | $3,012,915 | — | $3,012,915 |
| Idaho | $821,027,455 | — | $821,027,455 |
| Illinois | $277,861,015 | $4,232,873,381 | -$3,955,012,366 |
| Indiana | $434,146,848 | — | $434,146,848 |
| Iowa | $1,320,699,511 | — | $1,320,699,511 |
| Kansas | $795,351,803 | — | $795,351,803 |
| Kentucky | $357,937,572 | — | $357,937,572 |
| Louisiana | $307,396,910 | — | $307,396,910 |
| Maine | $473,346,698 | — | $473,346,698 |
| Maryland | $413,023,249 | — | $413,023,249 |
| Massachusetts | $2,710,518,702 | $2,268,015,460 | $442,503,242 |
| Michigan | $912,779,190 | — | $912,779,190 |
| Minnesota | $81,015,348 | $1,091,625,001 | -$1,010,609,654 |
| Mississippi | $593,269,792 | — | $593,269,792 |
| Missouri | $623,774,110 | — | $623,774,110 |
| Montana | $395,882,799 | — | $395,882,799 |
| Nebraska | $457,860,901 | — | $457,860,901 |
| Nevada | $183,546,411 | — | $183,546,411 |
| New Hampshire | $184,992,433 | — | $184,992,433 |
| New Jersey | $51,454,171 | $235,401,015 | -$183,946,844 |
| New Mexico | $446,760,197 | — | $446,760,197 |
| New York | $20,427,455 | $8,957,388,360 | -$8,936,960,905 |
| North Carolina | $3,076,448,914 | — | $3,076,448,914 |
| North Dakota | $259,401,507 | — | $259,401,507 |
| Ohio | $544,453,004 | — | $544,453,004 |
| Oklahoma | $240,890,981 | — | $240,890,981 |
| Oregon | $4,381,384,098 | — | $4,381,384,098 |
| Pennsylvania | $44,634,927 | $740,426,642 | -$695,791,714 |
| Rhode Island | $194,034,233 | — | $194,034,233 |
| South Carolina | $1,203,762,646 | — | $1,203,762,646 |
| South Dakota | $165,586,486 | — | $165,586,486 |
| Tennessee | $1,121,884,568 | — | $1,121,884,568 |
| Texas | $158,782,848 | $6,029,186,964 | -$5,870,404,116 |
| Utah | $783,906,716 | — | $783,906,716 |
| Vermont | $237,354,310 | — | $237,354,310 |
| Virginia | $181,721,131 | — | $181,721,131 |
| Washington | $1,882,557,437 | — | $1,882,557,437 |
| West Virginia | $321,212,732 | — | $321,212,732 |
| Wisconsin | $1,063,059,957 | — | $1,063,059,957 |
| Wyoming | $349,503,564 | — | $349,503,564 |
| Puerto Rico | $290,619,736 | — | $290,619,736 |
| Virgin Islands | $5,709,192 | $96,715,085 | -$91,005,892 |
| Totals | $33,742,744,036 | $44,827,500,505 | -$11,084,756,468 |
|
Sources: U.S. Department of the Treasury; Tax Foundation calculations. |
|||
[1] Tax Foundation calculations using U.S. Department of the Treasury and U.S. Department of Labor data. See U.S. Department of the Treasury, “Unemployment Trust Fund Reports,” TreasuryDirect, https://www.treasurydirect.gov/govt/reports/tbp/account-statement/report.html; and U.S. Department of Labor, “Unemployment Insurance Data,” https://oui.doleta.gov/unemploy/data_summary/DataSum.asp.
[2] Data from the U.S. Departments of Labor and Treasury show about $842 billion in payments from January 1, 2001 through January 27, 2020, compared to $836 billion between January 28, 2020 and September 11, 2021. Using a different, survey-based methodology, the U.S. Bureau of Economic Analysis indicates $1.03 trillion in expenditures from 2001 to the pandemic’s onset, and an estimated $870 billion (extrapolated for August and early September, 2021) for the pandemic era, and would have the comparable period beginning in mid-2004.
[3] U.S. Department of the Treasury, “Coronavirus State and Local Fiscal Recovery Funds Interim Final Rule,” 84 Fed. Reg. 26786, May 17, 2021, https://home.treasury.gov/system/files/136/FRF-Interim-Final-Rule.pdf.
[4] National Conference of State Legislature, “ARPA State Fiscal Recovery Fund Allocations,” Sept. 16, 2021, https://www.ncsl.org/research/fiscal-policy/arpa-state-fiscal-recovery-fund-allocations.aspx.
[5] National Conference of State Legislatures, “State Actions on Coronavirus Relief Funds,” June 17, 2021, https://www.ncsl.org/research/fiscal-policy/state-actions-on-coronavirus-relief-funds.aspx.
[6] Jared Walczak, “State Aid in American Rescue Plan Act Is 116 Times States’ Revenue Losses,” Tax Foundation, Mar. 3, 2021, https://www.taxfoundation.org/state-and-local-aid-american-rescue-plan/.
[7] See discussion of authorized uses in Jared Walczak, “Four Questions Treasury Must Answer About the State Tax Cut Prohibition in the American Rescue Plan Act,” Tax Foundation, Mar. 18, 2021, https://www.taxfoundation.org/american-rescue-plan-state-tax-cuts-treasury/.
[8] Maryland Department of Legislative Services, “Issue Papers: 2021 Legislative Session,” December 2020, http://dls.maryland.gov/pubs/prod/RecurRpt/Issue-Papers-2021-Legislative-Session.pdf.
[9] Samantha Marcus, “N.J. Businesses to get Socked with $250M Unemployment Insurance Tax Hike,” New Jersey Advance Media, Aug. 14, 2021, https://www.nj.com/politics/2021/08/nj-businesses-to-get-socked-with-250m-unemployment-insurance-tax-hike.html.
Share