Executive Summary
The Tax Foundation’s Taxes and Growth Model was used to estimate the long-run effects on the U.S. economy and federal revenue of enacting the capital cost recovery plan developed by Senate Finance Committee staff under the guidance of Senator Max Baucus.
In general, the Baucus plan would slow the rate at which businesses could claim investment costs as expenses on their taxA tax is a mandatory payment or charge collected by local, state, and national governments from individuals or businesses to cover the costs of general government services, goods, and activities. returns. Because of the time value of money, that would depress the present value of the write-offs and worsen the income tax’s bias against saving and investment.
Consequently, new investments would be fewer than otherwise, the economy’s stock of capital would increase less rapidly, productivity would suffer, and economic growth would slow.
Government revenue estimators would score the Baucus proposal as a big revenue raiser, which increases the odds that it will be seen as an option in current or future policy debates. That makes it worth evaluating even though Senator Baucus has moved on to become Ambassador to China.
Key Findings
- The Baucus plan would slow the rate at which businesses could claim investment costs as expenses on their tax returns, which would depress the present value of the write-offs and worsen the income tax’s bias against saving and investment.
- In the long run, Baucus’s cost recoveryCost recovery is the ability of businesses to recover (deduct) the costs of their investments. It plays an important role in defining a business’ tax base and can impact investment decisions. When businesses cannot fully deduct capital expenditures, they spend less on capital, which reduces worker’s productivity and wages. plan would reduce the nation’s capital stock by 7.1 percent, wages by 2.2 percent, employment by 0.5 percent (449,800 fewer full-time-equivalent jobs), gross domestic product (GDP) by 2.5 percent
- The plan appears to increase yearly federal revenue by $33 billion (in 2014 dollars), but when accounting for economic effects, the plan would actually lower federal revenue by $64 billion due to reduced growth.
- If the proposed, slower capital cost recovery schedule is combined with a revenue-neutral cut in the corporate income taxA corporate income tax (CIT) is levied by federal and state governments on business profits. Many companies are not subject to the CIT because they are taxed as pass-through businesses, with income reportable under the individual income tax. rate to 30.6 percent, the package would still hurt growth, although not as much as without the rate cut, and federal revenue would fall due to the weaker economy.
- Instead of slower capital write-offs in exchange for lower rates, a clean cut in the corporate tax rate to 25 percent would increase the capital stock by 5.7 percent, wages by 1.7 percent, employment by 0.4 percent (348,200 additional full-time-equivalent jobs), GDP by 2.0 percent, and federal revenue by $7 billion.
In late 2013, Senator Max Baucus (D-MT), then chairman of the Senate Finance Committee, unveiled drafts for a series of proposed income tax reforms. The recommendations, which Finance Committee staff developed under his guidance, would revise the taxation of income earned abroad by U.S. businesses,[1] deal with selected individual and corporate tax enforcement issues,[2] modify the tax treatment of businesses’ investment costs,[3] and revamp energy tax credits.[4]
These proposals come with the promise that they would be part of a broader reform effort that would include reducing the U.S. corporate income tax rate to a more competitive level. Currently, the U.S. has the highest corporate tax rate in the industrialized world.[5] However, the committee drafts do not specify the amount of corporate rate reduction.
Although Senator Baucus has moved on to become ambassador to China, his proposals remain in play, not least because many of them would be scored as substantial revenue raisers. When they find their way into new legislative proposals this year or in coming years, it would be desirable to have a clear understanding of how they would affect the U.S. economy’s growth.
This paper examines one of the central elements of the Baucus plan: abolishing the income tax’s current capital cost recovery system and adopting a new one. We used the Tax Foundation’s Taxes and Growth Model to estimate the long-run effects on capital formation, employment, incomes, and output if the proposed depreciation system were enacted. The model also estimated the long-run effect of the new depreciationDepreciation is a measurement of the “useful life” of a business asset, such as machinery or a factory, to determine the multiyear period over which the cost of that asset can be deducted from taxable income. Instead of allowing businesses to deduct the cost of investments immediately (i.e., full expensing), depreciation requires deductions to be taken over time, reducing their value and discouraging investment. system on federal revenue, taking economic feedbacks into account. We additionally examined the long-run growth and revenue effects if the proposed cost recovery system were paired with a lower corporate tax rate.
In general, we find that the new cost recovery system would discourage investment, reduce wages and employment, and lower the nation’s output. In addition, we find that it would fail to increase government revenue collections, because it would lead to slower economic growth. Combining the new cost recovery system with a lower corporate income tax rate would lessen, but not fully offset, the damage.
The Current Capital Cost Recovery System
Income is not gross receipts. Income is receipts minus the costs incurred in generating the receipts. Therefore, businesses need to be able to deduct income-related expenses when computing income. While most labor costs can be deducted immediately, current law requires most capital investment costs to be depreciated, or written off, over time. Capital cost recovery allowances, as the tax write-offs are called, usually begin when an asset (e.g., structures, machines, equipment, etc.) is placed in service but are not completed until years later.
The Modified Accelerated Cost Recovery System (MACRS) is the standard tax depreciation system for tangible investment assets placed in service after 1986.[6] The cost recovery period depends on the type of asset, and it may also vary according to the industry in which an asset is used. The majority of depreciable assets other than structures have recovery periods of between 3 and 20 years, with 5 and 7 years being most common. For example, the costs of office furniture are written off over 7 years, and the costs of equipment specifically used in semiconductor manufacturing are written off over 5 years.[7] Write-off periods are 27.5 years for residential rental property and 39 years for nonresidential structures.
In addition to the length of the recovery period, the pattern of write-offs over the period also matters. The usual depreciation method under MACRS is 200 percent declining balance for 3-, 5-, 7-, and 10-year property, 150 percent declining balance for 15- and 20-year property, and straight-line for 27.5- and 39-year property. Some capital assets, such as property that U.S. companies use abroad, are subject to the alternative depreciation system (ADS) and must be written off by the straight-line method over recovery periods that are usually longer than those of MACRS.
MACRS has “accelerated” in its name because it generally lets assets be written off faster than they wear out physically or lose value economically. Relative to when businesses incur investment costs, however, MACRS delays the write-offs; it does not accelerate them.
The delay in recognizing investment costs for tax purposes creates an anti-investment bias. To illustrate this, suppose hypothetically that a business buys a machine this year for $100, that the tax system makes the business depreciate the cost over 5 years in equal installments, and that the business’s discount rate (time value of money) is 6 percent. Given these assumptions, the drawn-out depreciation schedule has a present discounted value of $89.30, which is $10.70 less than the investment’s $100 current cost. Because costs are understated by $10.70, income will be overstated by the same $10.70, both in present value terms. The extra tax due to the overstatement of income will turn some investments from profitable to unprofitable, and they will be shelved. To compensate for the time cost of the delayed write-off, a business considering buying a machine or other capital good will demand a higher pre-tax return on investments than otherwise. (The required pre-tax return is often called the hurdle rate, or cost of capital.) Consequently, new investments will be fewer than otherwise, the economy’s stock of capital will increase less rapidly, productivity will suffer, and economic growth will slow.[8]
Although multi-year depreciation periods are the rule, Section 179 of the tax code does let small businesses expense (write off immediately) a limited amount of capital investment. On several recent occasions, Congress has additionally enacted temporary provisions known as bonus depreciationBonus depreciation allows firms to deduct a larger portion of certain “short-lived” investments in new or improved technology, equipment, or buildings in the first year. Allowing businesses to write off more investments partially alleviates a bias in the tax code and incentivizes companies to invest more, which, in the long run, raises worker productivity, boosts wages, and creates more jobs. that allowed businesses to expense a specified percentage of certain capital equipment investments. (Congress permitted 50 percent bonus depreciation in 2013, but the provision expired at the end of the year.) The Joint Committee on Taxation (JCT) reports that in 2009, Section 179 deductions were 7.2 percent of total depreciation deductions and bonus depreciation deductions were 28.5 percent.[9] Two advantages of expensing are that it does not skew incentives away from investment (it is saving-consumption neutral) and that it is much simpler administratively for taxpayers than depreciation.
The Baucus Proposal
The draft plan from Senate Finance Committee staff would move to a new depreciation system as of January 1, 2015. The plan would divide depreciable assets into five categories.[10]
In four of the categories, intended for most short- to longer-term personal property (most depreciable items other than structures), assets within the category would be placed in a common pool and a specified percentage of the pool’s depreciable basis that year would be written off. The annual depreciation rates would be 38 percent for Pool 1, 18 percent for Pool 2, 12 percent for Pool 3, and 5 percent for Pool 4.
To illustrate how this would work, suppose a business’s Pool 2 assets have a total depreciable basis of $1 million in 2015. Rather than depreciating the assets individually as is currently done, the Baucus plan would apply an annual depreciation rate of 18 percent to the pool’s depreciable basis. Hence, in 2015, the business’s depreciation allowance for Pool 2 assets would be $180,000 (18 percent of $1 million). In 2016, the remaining basis would be $820,000 (if, for simplicity, no new assets are added and no old ones sold), and the depreciation allowance that year would be $147,600. The same procedure would be repeated in subsequent years. The remaining balance would shrink over time but never be fully written off unless the entire remaining pool were sold or scrapped or its depreciable basis fell below $1,000.
The fifth category would mainly consist of structures and some utility property. Assets in that category would be depreciated individually, without pooling. The depreciation method there would be straight-line over 43 years, compared to MACRS’s 27.5 years for residential rental property and 39 years for most other real property. These assets would be fully written off in 43 years.
The treatment of equipment, structures, and other depreciable property in a capital cost recovery system is jointly determined by the present value of the depreciation allowances in the various asset categories and by the categories into which the system places different assets.
On the first point, the depreciation schedules for most asset categories in the Baucus plan are relatively slow compared to MACRS categories and have lower present values. This is shown in Table 1, which compares the present values of the write-offs for the main asset categories in the Baucus plan with those in MACRS. The numbers depend on the discount rate and, for simplicity, a 6 percent rate was assumed.
The present value of the write-offs for an asset from Pool 1 in the Baucus plan is lower than that for a 3-year asset in MACRSs and somewhat higher than that for a 5-year asset in MACRS, while the present value for a Pool 2 asset in the Baucus plan is somewhat lower than for a 10-year asset in MACRS. The present value of the write-offs for a Pool 3 asset in the Baucus plan is between those for 15- and 20-year MACRS assets. The present value of the write-offs for a Pool 4 asset is lower than the present value of the 27.5-year straight line depreciation that MACRS provides for residential rental property. For category five assets (mostly structures), the present value of the Baucus plan’s write-offs is smaller than the present value of the 39-year straight-line write-off MACRS allows for nonresidential structures.
|
Table 1. Discounted Present Values of Capital Cost Recovery Allowances, by Asset Category Current-Law MACRS versus Baucus Proposal (A 6% discount rate is assumed) |
|
|
Cost Recovery System and Asset Category |
Discounted Present Value (as percent of $1 of initial cost) |
|
MACRS |
|
|
3-year equipment |
94.5% |
|
5-year equipment |
90.1% |
|
7-year equipment |
86.1% |
|
10-year equipment |
80.6% |
|
15-year equipment |
68.9% |
|
20-year equipment |
61.4% |
|
27.5-year residential structures |
48.9% |
|
39-year structures |
38.6% |
|
Baucus Proposal |
|
|
Pool 1 (38% yearly depreciation) |
91.3% |
|
Pool 2 (18% yearly depreciation) |
79.0% |
|
Pool 3 (12% yearly depreciation) |
64.8% |
|
Pool 4 (5% yearly depreciation) |
47.4% |
|
Category 5 (43-year straight line) |
36.9% |
|
Computations by author. |
With the exception of structures, there is no simple rule for inferring from a property’s MACRS recovery period how the Baucus plan would categorize it. For example, office furniture, railroad tracks, work horses younger than age 13, equipment used in manufacturing ships, and natural gas production plants are some of the assets currently in MACRS 7-year recovery period. The Baucus plan would move office furniture to Pool 3, railroad tracks to Pool 4, work horses younger than age 13 to Pool 2, equipment used in manufacturing ships to Pool 3, and natural gas production plants to Category 5 (structures). Table 2 shows these and other examples. Some assets and industries would be hit harder than others. In most cases, though, the reshuffling would lead to a slower tax depreciation schedule with a smaller present value than current law provides.
|
Table 2. Some Examples of How the Baucus Plan Would Classify Assets Compared with Current Law (MACRS) |
|||
|
Asset |
Within IRS Asset Class |
MACRS |
Baucus |
|
Tractor Units for Use Over-the-Road |
0.26 |
3-year |
Pool 2 |
|
Hogs, Breeding |
1.23 |
3-year |
Pool 2 |
|
Special Handling Devices in Manufacture of Food |
20.5 |
3-year |
Pool 3 |
|
Computers |
0.12 |
5-year |
Pool 1 |
|
Taxis |
0.22 |
5-year |
Pool 1 |
|
Trailer-Mounted Containers |
0.27 |
5-year |
Pool 2 |
|
Light General Purpose Trucks |
0.241 |
5-year |
Pool 2 |
|
Offshore Drilling Barges |
13.0 |
5-year |
Pool 3 |
|
Equipment Used in Producing Knitted Fabrics and Lace |
22.1 |
5-year |
Pool 3 |
|
Work Horses Younger than Age 13 |
1.221 |
7-year |
Pool 2 |
|
Office Furniture |
0.11 |
7-year |
Pool 3 |
|
Ship and Boat Building Machinery and Equipment |
37.31 |
7-year |
Pool 3 |
|
Railroad Tracks |
40.4 |
7-year |
Pool 4 |
|
Amusement Park Rides |
80.0 |
7-year |
Pool 4 |
|
Natural Gas Production Plant |
49.23 |
7-year |
Structure |
|
Petroleum Refining Equipment |
13.3 |
10-year |
Pool 3 |
|
Ship and Boat Building Dry Docks |
37.32 |
10-year |
Pool 4 |
|
Pipeline Transportation |
46.0 |
15-year |
Pool 4 |
|
Electric Utility Steam Production Plant |
49.13 |
20-year |
Structure |
A basic principle throughout the income tax’s history is that changes in the depreciation system are prospective, not retroactive. For example, when the Tax Reform Act of 1986 introduced MACRS, it specified that property placed in service before 1987 would continue to be depreciated under old law. In a break with the principle of not increasing taxes retroactively, the Baucus proposal would move existing assets that are still being depreciated into the new system.[11] Accordingly, many businesses would have to wait longer, often much longer, than they had expected when they bought assets before they could fully recognize the assets’ costs for tax purposes.
The Baucus cost recovery proposal includes many other provisions that would also affect when businesses could recognize expenses for tax purposes. A few will be mentioned here. Research and experimental costs could no longer be expensed but would have to be capitalized and amortized ratably over 5 years. Advertising costs could no longer be fully expensed; half would have to be capitalized and amortized ratably over 5 years. The amortization period for Section 197 intangible assets would increase from 15 to 20 years. The last-in, first-out (LIFO) method of inventory accounting, which offers some protection against being taxed on phantom gains due to inflation, would be eliminated in favor of the first-in, first-out (FIFO) method, which lacks inflationInflation is when the general price of goods and services increases across the economy, reducing the purchasing power of a currency and the value of certain assets. The same paycheck covers less goods, services, and bills. It is sometimes referred to as a “hidden tax,” as it leaves taxpayers less well-off due to higher costs and “bracket creep,” while increasing the government’s spending power. protection. On the other hand, the amount of qualifying investments that could be expensed under Section 179 would increase to $1 million with the expensing phasing out dollar-for-dollar on investment costs exceeding $2 million.
Economic Depreciation and the Baucus Proposal
According to Senator Baucus and the Finance Committee staff, the lodestar that guided the development of their cost recovery proposal is a concept known as “economic depreciation.” They write that their plan would “[r]eplace the current rules with a system that better approximates economic depreciation based on estimates from the Congressional Budget Office.”[12] In deciding when businesses should be able to recognize costs for tax purposes, economic depreciation disregards when costs actually occur and instead attempts to match the rates at which plant, equipment, and other capital are expected to wear out physically or technologically.
Economic depreciation has some support in the economics profession. It is consistent with one very broad definition of income known as the Haig-Simons concept of income. Unfortunately, a tax based on Haig-Simons income is strongly biased against saving and investment[13] and so is a tax system that attempts to set cost recovery allowances according to economic depreciation.
It was noted earlier that capital cost recovery allowances in present law usually lag behind businesses’ actual costs. That delay produces an anti-investment bias because of the time value of money. Present-law cost recovery allowances are “accelerated,” though, compared to economic depreciation. That is to say, economic depreciation would increase the time delay between when businesses incur capital costs and when they can write-off those costs on their tax returns. That added delay would worsen the tax system’s anti-investment bias.
Economic depreciation also suffers from a major operational deficiency: it is not something that can be specified with any accuracy in the tax code. For instance, the Baucus plan assumes that all the assets to be placed in Pool 3 will lose value at a steady rate of approximately 12 percent yearly. Pool 3 includes a wide range of diverse assets, examples of which are airplanes, tools used in manufacturing jewelry, and tools used to manufacture railroad cars. Lumping them together produces, at best, an extremely crude approximation of the rates at which each asset type will lose value in future years. When the proposed cost recovery schedule is applied to individual assets at individual businesses, the approximation becomes even cruder.
One of the few cases where enough information is available to estimate physical or technical decay with good accuracy is the used car market, where resale prices on millions of automobiles traded every year provide abundant data.[14] Economic depreciation for automobiles depends on the make of car, the model, how much the car has been driven, how well it has been maintained, the car’s options, the prices of new cars (substitutes for used autos), regional market conditions, and a host of other factors. The yearly decay rate often varies over a car’s life. (Autos tend to lose the most value in the first year.) Further, automobiles built in one year may not lose value at the same rates as those built a few years earlier or a few years later. In addition, used cars in the resale market are typically inspected individually, with the resale price often adjusted up or down based on the inspection results. Compare this with the Baucus plan’s five asset categories. The tax system is just not capable of capturing the diverse economic decay rates of hundreds of thousands of different asset types at millions of different businesses.
The Taxes and Growth Model
The Tax Foundation’s Taxes and Growth Model (TAG Model) has two main, interactive components.[15] One part, known as a production function, relates inputs of labor and capital to the economy’s output. The particular type of production function chosen, Cobb-Douglas, has historically provided a good fit for U.S. economic data.
The quantities of labor and capital that people wish to supply depend on incentives, and some of those incentives are tax related. If tax changes reduce (increase) after-tax rewards for working or investing, people will be less (more) eager to work or invest. The production function computes how the tax-induced changes in labor and capital inputs will affect economic output. Empirically, the supply of labor responds modestly to changes in after-tax rewards, while people’s willingness to save and invest is extremely sensitive to expected after-tax rewards.
The second part of the model is an individual income tax calculator. Using a sample of approximately 140,000 anonymous tax records from the Internal Revenue Service (the 2008 Public Use File), the model calculates people’s marginal and average income tax rates and their tax liabilities. For proposed income tax changes, the model calculates the effects on what is taxable, income tax rates, and the resulting tax liabilities. If marginal tax rates or depreciation schedules change, that will lead to adjustments in the supplies of labor and capital, which will produce changes in employment, investment, productivity, output, and growth. These real economic changes, in turn, will feed back on the income tax because the size and health of the economy have a strong impact on income tax collections.
The model is long run. Its results estimate the economic and tax revenue changes after people have fully adjusted to the new tax rules. (This is known as a comparative statics model.) While the adjustment process is not instantaneous, it does not take that many years. With capital, experience indicates that most of the adjustments will have been completed after five years for equipment and after ten years for structures.
Although the tax data are for 2008, tax parameters have been updated to reflect current law, and tax rates and liabilities have been recalculated accordingly. The production function’s baseline is calibrated to 2008 National Income and Product Accounts (NIPA) data computed by the U.S. Bureau of Economic Analysis (BEA). That was the last year of reasonably normal NIPA data before the recession hit with full force.
Modeling the Baucus Cost Recovery Proposal
The TAG Model estimated the economic and tax revenue effects if the prospective portion of the Baucus capital cost recovery proposal were to become law. This part of the Baucus plan would require that the costs of future investments be written off based on the Baucus plan’s five asset categories, not based on current-law MACRS. A crucial preliminary step was comparing the MACRS categories into which the tax code now places various types of depreciable assets with the Baucus categories into which those assets would fall.
The model did not estimate the impact of the proposal’s retroactivity. As mentioned earlier, retroactive taxes inhibit future investment because people regard the retroactivity as weakening the rule of law, fear more episodes of retroactive taxation in the future, and become more reluctant to undertake new investments in response to the heightened risk.[16] However, the economic relationships and responses on which the model is based offer little guidance as to the size of the negative effect. Moreover, the long-term effects would depend on whether, having established so conspicuous a precedent, retroactive taxes become a habit. Given these uncertainties, the quantitative analysis focuses on the prospective change. If the retroactive change were included, the capital cost recovery portion of the Baucus plan would look more damaging than reported here.
The estimates also do not consider some other recommendations in the Baucus and Finance Committee staff plan that would delay tax write-offs for business costs, such as requiring that advertising costs and research and development expenditures be deducted over five years instead of being expensed.
The Results: Less Investment, Fewer Jobs, Slower Growth, and Less Tax Revenue
Chart 1 and Table 3 show the model’s estimates of the long-run economic consequences of requiring future capital investments to be written off according to the Baucus plan’s cost recovery system. To compensate for the tougher tax climate, businesses would increase the minimum return they require before being willing to green-light investment projects by 4.8 percent (from 13.04 percent to 13.67 percent). To compute this change, depreciable assets were first categorized under the current-law MACRS system and the cost of capital (or hurdle rate) calculated. Assets were then recategorized as recommended by the Baucus plan and the cost of capital recomputed.

|
Table 3. Changes in Economic Activity and Federal Revenues If the Baucus Plan’s Capital Cost Recovery System Replaces MACRS |
|
|
ECONOMIC AND BUDGET CHANGES VERSUS 2014 LAW |
|
|
(Dollar amounts in billions of 2014 dollars except as noted) |
|
|
GDP |
-2.53% |
|
$GDP ($ billions) |
-$429.0 |
|
Private business GDP |
-2.62% |
|
Private business stocks |
-7.09% |
|
Wage rate |
-2.17% |
|
Private business hours of work |
-0.47% |
|
Full time equivalent jobs (in thousands) |
-449.9 |
|
Static revenue estimate ($ billions) |
$33.2 |
|
Federal revenue (dynamic)($ billions) |
-$63.9 |
|
% revenue reflow vs. static |
-292.7% |
|
Cost of Capital |
% Change |
|
Corporate |
5.60% |
|
Noncorporate |
2.95% |
|
All business |
4.81% |
|
These are long-run estimates. They do not include the deterrent effect the Baucus plan’s retroactivity may have on future investment. |
Because fewer investments would be able to surmount the higher hurdle, the model estimates that, after several years, the stock of capital would be 7.1 percent lower than otherwise. With less capital to enhance their efforts, workers would become less productive. Because workers are paid based on their productivity, that would lead to lower pay (down 2.2 percent) and fewer hours worked (down 0.5 percent). The model estimates employment would fall by 449,800 full-time-equivalent jobs compared to current law. With people supplying fewer capital and labor inputs in the production process, the economy’s output and people’s incomes would be smaller than if MACRS was left in place. The model estimates that gross domestic product (GDP) would drop 2.5 percent.
The proposed capital cost recovery system would be a large revenue raiser in the near term, collecting several hundred billion extra tax dollars because of its retroactivity. That effect would gradually wear off, though, as old investments were eventually depreciated. A conventional revenue estimate would also score the cost recovery proposal as a substantial revenue raiser in the long term because it would force taxpayers to write off their future investments more slowly. The long-term estimate, however, relies on an assumption that is unrealistic in this case.
In estimating the revenue effects of tax changes, government revenue estimators typically ignore growth effects. They assume that tax changes have no impact whatsoever on major economic aggregates like total investment, total employment, and total output. (They may permit shifts within an aggregate, such as more sales of one type of good, provided it is exactly offset by fewer sales of other goods.) The static assumption simplifies revenue estimates, and it is not a bad approximation for tax changes that do not generate large shifts in marginal tax rates. However, it is a very bad approximation for the capital cost recovery system in the Baucus plan because that would generate substantial increases in marginal tax rates, increases concentrated on capital formation which is very sensitive to after-tax returns.
The TAG Model estimated the long-run revenue impact of the Baucus plan’s cost recovery system under both the conventional (static) assumption that ignores growth effects and a dynamic analyses that takes account of how tax-induced growth changes feedback on tax collections. (See Chart 2.) When growth effects are disregarded, the proposal looks like a powerful revenue raiser in the long run, collecting an estimated $33.2 billion annually (in 2014 dollars). Once growth enters the analysis, though, the revenue gain disappears. It is replaced by an estimated annual revenue loss of $63.9 billion. The model predicts that business tax collections would still be up as a result of the slower tax write-offs for investment costs, but this would be more than offset because the smaller economy would depress most people’s federal income taxes, payroll taxes, and excise taxes. Even if one insisted on using the static revenue estimate, the model indicates that every $1 of static revenue gain would be paid by a nearly $13 decrease in economic output and people’s incomes. That seems like a poor tradeoff.

Combining the Proposed Capital Cost Recovery System with a Lower Corporate Income Tax Rate
The Baucus proposal suggests that some of the revenue from the new, slower cost recovery system might finance a lower corporate income tax rate. The staff summary declares, “While the Chairman believes tax reform as a whole should raise significant revenue for deficit reduction, the package of reforms in this staff discussion draft is intended to be coupled with a significant reduction in the corporate tax rate that, on net, is revenue-neutral in the long-term (i.e., in a steady state).”[17]
Because the portion of the revenue gain due to retroactivity would be temporary, the reference to the long-run steady state implies that none of the large retroactive tax increase would be used for rate reduction. In determining how much is available as a funding source, the plan’s advocates would probably look to a long-run revenue estimate based on the conventional assumption that economic growth would be the same with the tax change as without it.
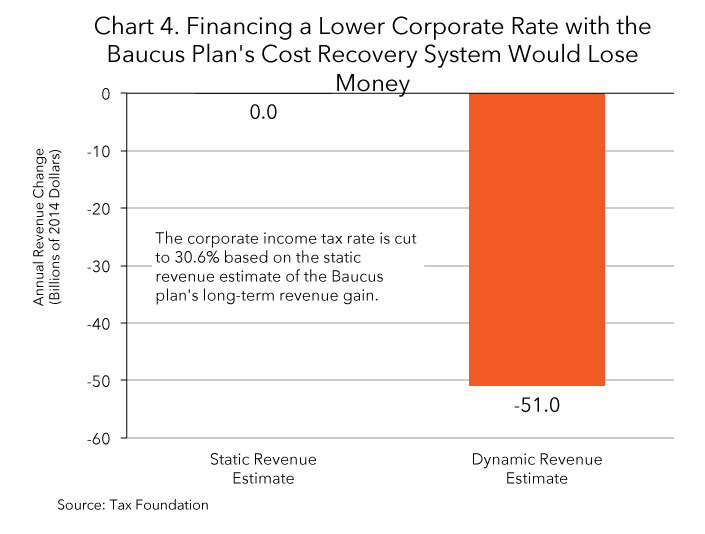
The TAG Model estimates the federal corporate income tax rate could be lowered to 30.6 percent by this route. This assumes none of the static revenue gain would be earmarked for higher government spending, other tax changes, or deficit reduction. Table 4 and Chart 3 show the model’s estimates of the economic effects of this broader-tax-base-for-lower-corporate-rate trade. The cost of capital would rise by 2.6 percent compared to current law, the capital stock would drop by 3.9 percent, hours worked would fall by 0.25 percent (the loss of 244,700 full-time-equivalent jobs), and GDP would decrease 1.4 percent. These numbers are an improvement over the proposed capital cost recovery system by itself, but they are still disappointing.

|
Table 4. Changes in Economic Activity and Federal Revenues If the Baucus Plan’s Capital Cost Recovery System Replaces MACRS |
|
|
Assume Static Revenue Gain Used to Cut Corporate Income Tax Rate to 30.6% |
|
|
ECONOMIC AND BUDGET CHANGES VERSUS 2014 LAW (Dollar amounts in billions of 2014 dollars except as noted) |
|
|
GDP |
-1.38% |
|
$GDP ($ billions) |
-$225.5 |
|
Private business GDP |
-1.43% |
|
Private business stocks |
-3.92% |
|
Wage rate |
-1.18% |
|
Private business hours of work |
-0.25% |
|
Full time equivalent jobs (in thousands) |
-244.7 |
|
Static revenue estimate ($ billions) |
$0.0 |
|
Dynamic revenue estimate ($ billions) |
-$51.0 |
|
% revenue reflow vs. static |
N/A |
|
Cost of Capital |
% Change |
|
Corporate |
2.37% |
|
Noncorporate |
3.09% |
|
All business |
2.59% |
|
These are long-run estimates. They do not include the deterrent effect the Baucus plan’s retroactivity may have on future investment. |
Chart 4 shows the estimated revenue effect of the tradeoff. The trade is revenue neutral on a static basis by construction, with the static loss from the lower rate counterbalancing the static gain from the slower tax depreciation of investments. On a dynamic basis, however, the TAG Model estimates the long-term loss would be $51 billion. This is actually an improvement over the proposed cost recovery system by itself because the lower corporate rate would more than pay for itself by growing the economy and bolstering a range of federal taxes. In other words, the dynamic revenue loss is due entirely to the more delayed capital cost recovery system.
A Smarter Approach
Instead of conditioning a lower corporate tax rate on offsetting business tax increases, Congress should recognize that many proposed revenue raisers would weaken the economy and be counterproductive. Congress should also acknowledge that the corporate income tax rate is internationally uncompetitive and itself counterproductive for the U.S. economy. Consider the pro-growth impact if Congress enacted a clean reduction in the corporate income tax rate to 25 percent.
The model estimates that, after the economy adjusted to the change, the cost of capital would be 3.5 percent lower, which would encourage more investment and cause the capital stock to expand by 5.7 percent compared to what it would be if the corporate rate remained 35 percent. The resulting productivity increase would lift wages by 1.7 percent and hours worked by 0.4 percent (348,200 full-time-equivalent jobs). The economy’s output of goods and services (GDP) would expand by 2.0 percent. (See Chart 5 and Table 5.)

|
Table 5. Changes in Economic Activity and Federal Revenues from a Clean Corporate Tax Rate Cut to 25% |
|
|
ECONOMIC AND BUDGET CHANGES VERSUS 2014 LAW (Dollar amounts in billions of 2014 dollars except as noted) |
|
|
GDP |
1.97% |
|
$GDP ($ billions) |
$333.9 |
|
Private business GDP |
2.04% |
|
Private business stocks |
5.75% |
|
Wage rate |
1.68% |
|
Private business hours of work |
0.36% |
|
Full time equivalent jobs (in thousands) |
348.2 |
|
Static revenue estimate ($ billions) |
-$68.5 |
|
Dynamic revenue estimate ($ billions) |
$7.0 |
|
% revenue reflow vs. static |
-110.2% |
|
Cost of Capital |
% Change |
|
Corporate |
-5.08% |
|
Noncorporate |
0.22% |
|
All business |
-3.50% |
|
These are long-run estimates. |
In a conventional revenue estimate that ignores the feedback of growth on tax revenue, a 25 percent corporate rate appears to open a daunting revenue hole, almost $70 billion. (See Chart 6.) However, while the cut would indeed lower corporate income tax collections, its positive economic feedback would push up other federal receipts so much that the model estimates overall federal revenues would actually increase by $7.0 billion.

A simple reduction in the corporate income tax rate to 25 percent would be far better for the U.S. economy than adopting the Baucus plan’s capital cost recovery system.
[1] Press Release, Senate Finance Committee, Baucus Unveils Proposals for International Tax Reform (Nov. 19, 2013), http://www.finance.senate.gov/newsroom/chairman/release/?id=f946a9f3-d296-42ad-bae4-bcf451b34b14.
[2] Press Release, Senate Finance Committee, Baucus Unveils Proposal to Combat Tax Fraud, Make Filing Safer, Simpler and More Efficient (Nov. 20, 2013), http://www.finance.senate.gov/newsroom/chairman/release/?id=a4f8205c-d286-4a41-a61d-753d1abd23d3.
[3] Press Release, Senate Finance Committee, Baucus Works to Overhaul Outdated Tax Code (Nov. 21, 2013), http://www.finance.senate.gov/newsroom/chairman/release/?id=536eefeb-2ae2-453f-af9b-946c305d5c93.
[4] Press Release, Senate Finance Committee, Baucus Unveils Proposal for Energy Tax Reform (Dec. 18, 2013), http://www.finance.senate.gov/newsroom/chairman/release/?id=3a90679c-f8d0-4cb6-b775-ca559f91ebb4.
[5] See Tax Foundation, Putting a Face on America’s Tax Returns: A Chart Book (2d ed. 2013) at 44.
[6] For a very detailed explanation of how MACRS operates, see Internal Revenue Service, How To Depreciate Property, Publication 946 (Feb. 15, 2013), http://www.irs.gov/pub/irs-pdf/p946.pdf.
[7] Id. at Appendix B. Technically, the write-off periods for the assets mentioned in the text are actually 8 and 6 years, respectively, because of the half-year convention.
[8] For a fuller discussion, see Stephen J. Entin, The Tax Treatment of Capital Assets and Its Effect on Growth: Expensing, Depreciation, and the Concept of Cost Recovery in the Tax System, Tax Foundation Background Paper No. 67 (Apr. 24, 2013), https://taxfoundation.org/article-ns/tax-treatment-capital-assets-and-its-effect-growth-expensing-depreciation-and-concept-cost-recovery.
[9] Joint Committee on Taxation, Background and Present Law Relating to Manufacturing Activities Within the United States, JCX-61-12 (July 17, 2012), at 94, 96, and 98, https://www.jct.gov/publications.html. In 2009, Congress permitted businesses to expense half the costs of eligible assets placed in service that year. Businesses then depreciated the remaining basis according to normal rules.
[10] For a detailed explanation, see Joint Committee on Taxation, Technical Explanation of the Senate Committee on Finance Chairman’s Staff Discussion Draft to Reform Certain Business Provisions, JCX-19-13 (Nov. 21, 2013), http://www.finance.senate.gov/newsroom/chairman/download/?id=ccfc8169-75a8-4cfb-be20-51ba32eb9551.
[11] If an old asset falls in one of the pooled categories, its remaining depreciable basis would be added to that category’s pool. If it falls in category five, its remaining basis would be depreciated over 43 years minus the number of years of prior depreciation. The Baucus plan would collect hundreds of billions of dollars through retroactive taxes. For a discussion of three major retroactive provisions, including this one, see Michael Schuyler, Retroactive Taxation and the Baucus Proposal, Tax Foundation Fiscal Fact No. 405 (Dec. 9, 2013), https://taxfoundation.org/article/retroactive-taxation-and-baucus-proposal. See also Scott A. Hodge, The Tax Draft of Sen. Max Baucus Amounts to Legalized Wealth Confiscation, Forbes, Dec. 11, 2013, https://taxfoundation.org/article/forbes-op-ed-scott-hodge-senator-baucuss-tax-reform-proposals.
[12] U.S. Senate Committee on Finance, Cost Recovery and Accounting Tax Reform Discussion Draft (Nov. 21, 2013), http://www.finance.senate.gov/newsroom/chairman/download/?id=0dad1fac-533e-4a62-8824-024c05c42897.
[13] See Entin, supra note 8.
[14] Examining prices in markets for used assets is the gold-standard method for estimating economic depreciation. For one of the classic studies in this field, see Charles R. Hulten & Frank C. Wykoff, The Measurement of Economic Depreciation, in Inflation & the Taxation of Income from Capital (Charles R. Hulten ed., 1981), http://econweb.umd.edu/~hulten/WebPageFiles/Original%20Hulten-Wykoff%20Economic%20Depreciation%20Study.pdf. However, resale markets for capital assets are rarely large and deep enough to yield more than guesstimates.
[15] For more information about the Tax Foundation’s Taxes and Growth Model (TAG Model), see Tax Foundation, Taxes and Growth, https://taxfoundation.org/taxes-and-growth.
[16] A contrary view is that retroactive taxes cause no changes in people’s behavior. First, if they were unexpected, they did not have alter past behavior. Second, it is argued that they will not change future behavior because they do not tax future actions. However, this argument assumes people will not fear additional retroactive taxes in the future. More realistically, it is common for people to adjust their behavior in response to unpleasant surprises.
[17] U.S. Senate Committee on Finance, Summary of Staff Discussion Draft: Cost Recovery and Accounting (Nov. 21, 2013), at 6, http://www.finance.senate.gov/newsroom/chairman/download/?id=b932d649-2a64-4827-a7a4-d2f177592a49.