

By Erica York and Alex Durante
Key Findings
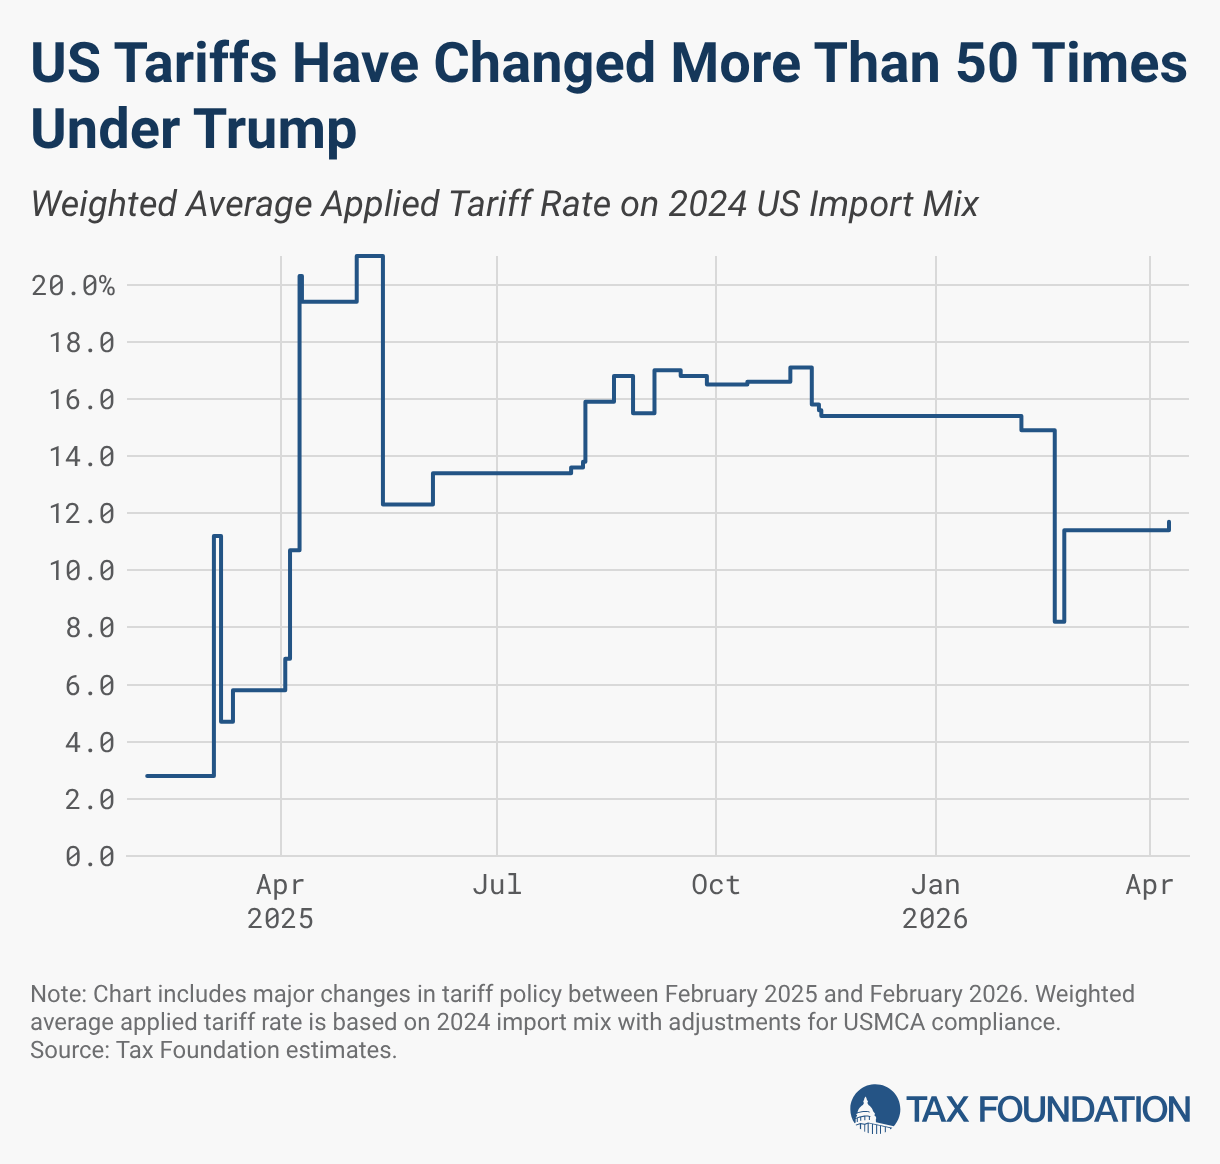
- US tariff policy has changed more than 50 times since January 2025 as President Trump imposed tariffs on nearly all US trading partners using a variety of tested and untested authorities, including: International Emergency Economic Powers Act (IEEPA), Section 232, Section 122, Section 338, Section 301, and Section 201.
- We estimate new tariffs apply to 54 percent of US goods imports in 2026.
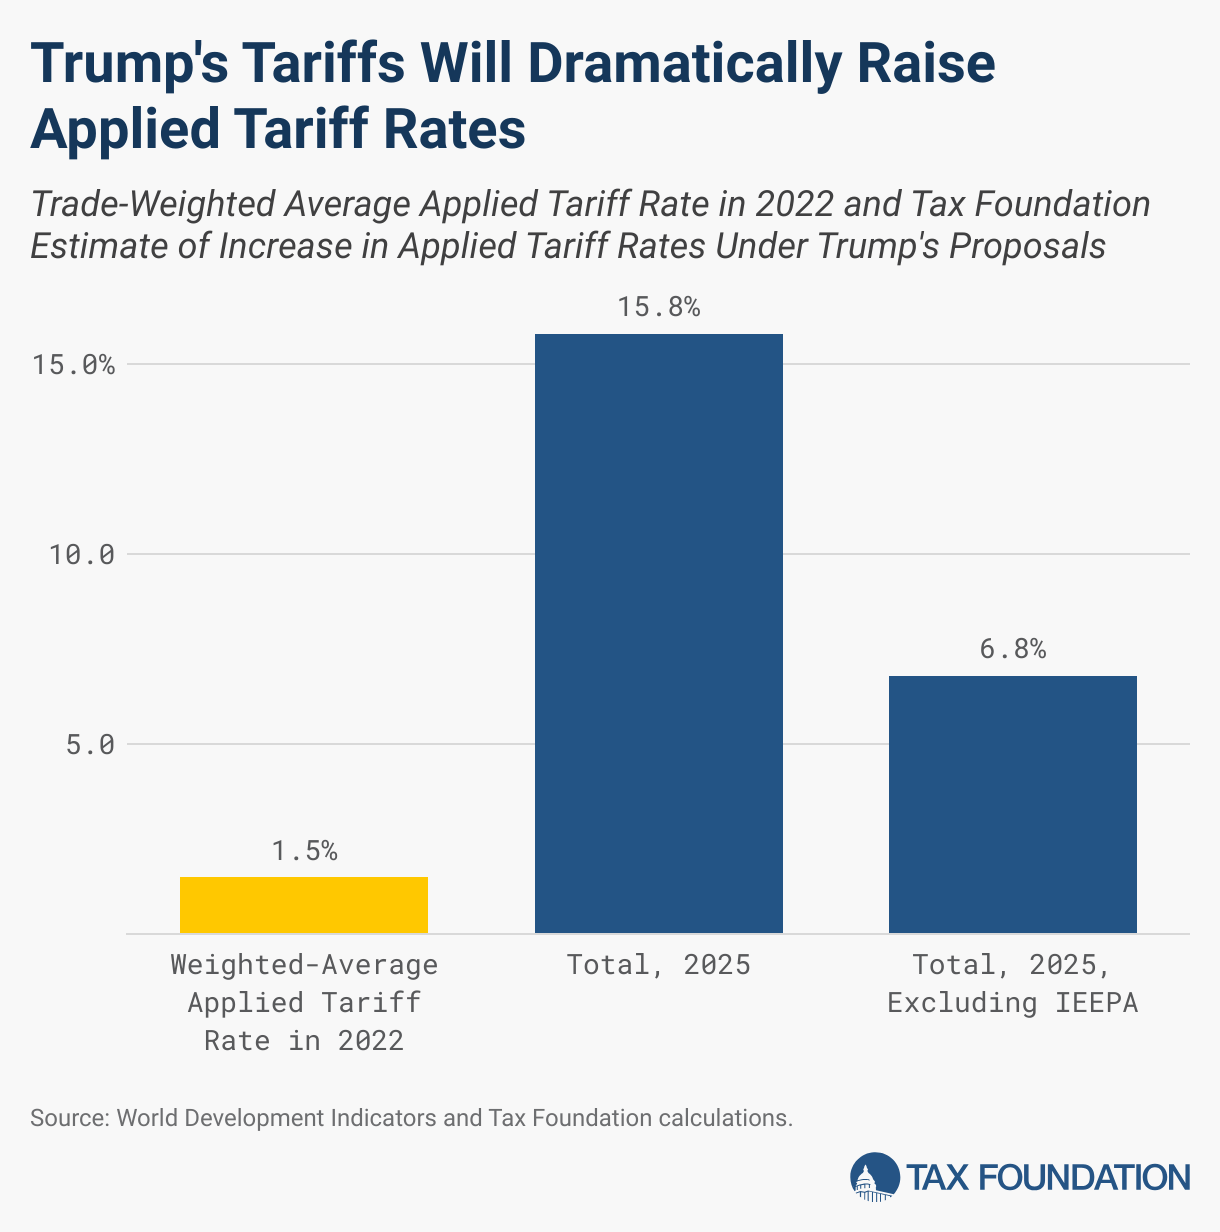
- We estimate the current tariffs will raise the applied tariff rate to 11.8 percent, up from 1.5 percent in 2022. We estimate the current tariffs will raise the effective tariff rate (reflecting revenues collected) to 7.2 percent for calendar year 2026.
- Altogether, we estimate the tariffs currently imposed and scheduled will raise $1.4 trillion for the US government from 2026 through 2035 on a conventional basis.
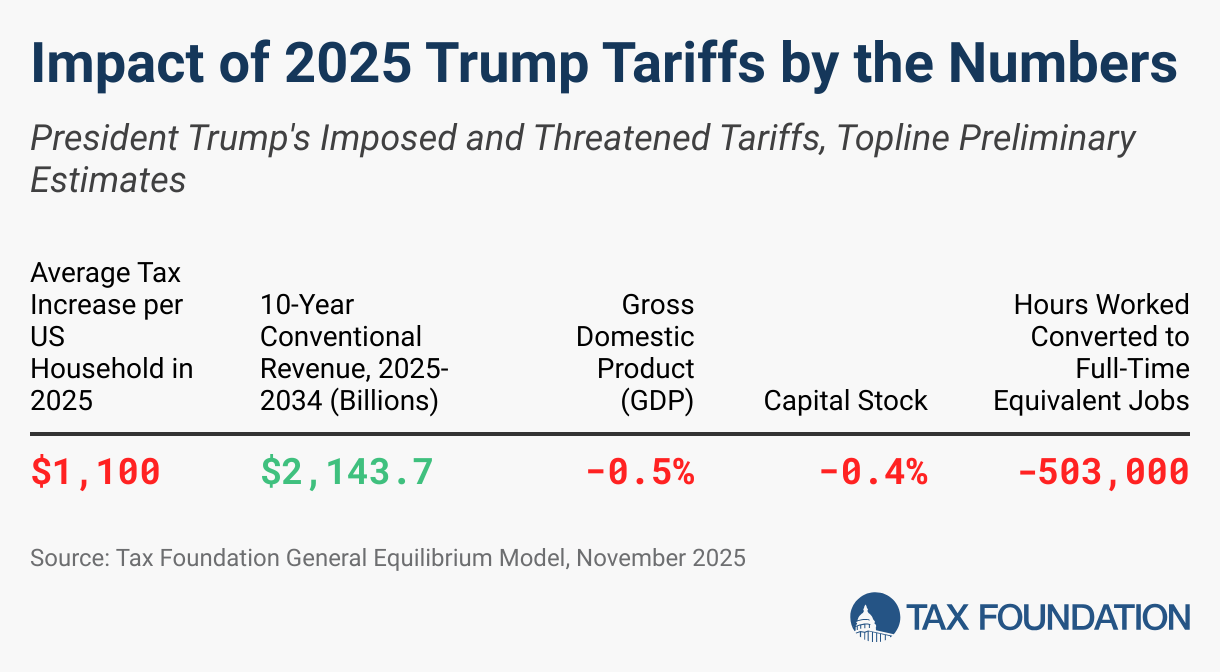
- We estimate the new tariffs will reduce long-run GDP by 0.4 percent, the capital stock by 0.3 percent, and hours worked by 338,000 full-time equivalent jobs.
- After accounting for the drop in GDP, we estimate the tariffs will raise $1 trillion over the budget window on a dynamic basis.
- We estimate the Trump tariffs increased taxes by an average of $1,000 per US household in 2025, before the Supreme Court ruling (Learning Resources) that struck down the IEEPA tariffs.
- In 2026, we estimate the tariffs will increase taxes by an average of $820 per US household, as the new tariffs have not fully replaced the struck-down IEEPA tariffs.
Latest Updates
- We updated the tracker to provide a breakout of direct customs duty collection estimates by tariff authority and to reflect changes in the Section 338 tariffs on Canada and the retaliatory tariffs.
- We updated the tracker to separate the Section 301 forced labor tariffs from the Section 301 Brazil tariffs. We estimate the Section 301 forced labor tariffs will raise $611.7 billion from 2026-2035 on a conventional basis net of offsets (the direct tariff revenue before offsets is higher, at $797 billion).
- We updated the tracker for new Section 232 tariffs on polysilicon and unmanned aircraft systems, as well as new Section 201 tariffs on quartz surface products. We fixed an issue with modeling tariff interactions. We also reorganized the page and archive.
- We updated estimates for the Section 232 tariffs on steel, aluminum, and copper to account for changes in June, the new Section 301 tariffs, and the new Section 338 tariff on Canada.
The Impact of US Tariffs
Tax Foundation’s Tariff Tracker analyzes how changes in US tariff policy affect the following outcomes:
Current Tariff Policy at a Glance
US tariff policy has changed more than 50 times since January 2025. Table 1 shows the tariffs struck down, expired, currently in effect, or scheduled to take effect, along with the relevant rates, beginning dates, and Tax Foundation’s estimate of the annualized tariff base in 2026 before behavioral changes. We estimate new tariffs affect 54 percent of US goods imports in 2026.

Table 1. New US Tariffs at a Glance
| Authority | Rate(s) | Estimated Annual Imports Affected Before Behavioral Changes (2026) | Dates |
|---|---|---|---|
| Section 232 Steel, Aluminum, Copper | 50%, lower rates for derivatives and certain trade deal partners | $320 billion | March 12, 2025 |
| Section 232 Auto, Heavy Trucks, Buses, and Parts | 25% on autos and heavy trucks, 10% on buses, lower rates for certain trade deal partners | $407 billion | April 3, 2025, for autos; May 3, 2025, for auto parts; November 1, 2025, for heavy trucks and buses |
| Section 232 Furniture and Lumber | 25% furniture, 10% lumber, lower rates for certain trade deal partners | $19 billion | October 14, 2025 |
| Section 232 Pharmaceuticals | 100% on patented drugs, 15% or 10% for certain trade deal partners, or lower rates for certain companies with onshoring or pricing agreements | $97 billion | July 31, 2026 |
| Section 232 Polysilicon | 15%, or 10% for the UK. Additional minimum import prices not modeled. | $12 billion | December 4, 2026 |
| Section 232 Unmanned Aircraft Systems | 100% on drones of certain size and capability, 25% on smaller drones without thermal imaging capability, lower rates for certain trade deal partners | $26 billion | Most effective September 2, 2026; some delayed until February 9, 2027 |
| Section 201 Quartz Surface Products | 25% in year 1, 23% in year 2, 21% in year 3, 19% in year 4; additional over-quota rates not modeled | $1.8 billion | August 15, 2026, through August 2029 |
| Section 301 Brazil | 25% | $16.2 billion | July 22, 2026 |
| Section 301 Forced Labor | 10% or 12.5% | $954 billion | July 24, 2026 |
| Section 338 Canada | 50% | $22 billion | Delayed to August 22, 2026, modified effective September 15, 2026 |
| International Emergency Economic Powers Act (IEEPA), Struck Down | Ranged from 10% to 50% on nearly all US trading partners | $1.2 trillion | Struck down by the Supreme Court on February 20, 2026, in Learning Resources, Inc. v. Trump |
| Section 122, Expired | 10% on nearly all US trading partners | $1 trillion | In effect February 24, 2026, through July 24, 2026 |
Source: Tax Foundation research and estimates.
Tariff Rates
We measure the tariff burden using two distinct rate measures:
- The applied tariff rate is a measure of the statutory tariff rate weighted by the value of imports affected before any behavioral impacts. It reflects the real-time rate imports face on a weighted average basis under the current tariffs.
- The effective tariff rate is a measure of customs duty revenue divided by total goods imports on an annualized basis. It is lower than the applied rate because of timing and behavioral responses.
Table 2. Applied and Effective Tariff Rates
| Pre-Trade War | Estimate for 2026 | |
|---|---|---|
| Applied Tariff Rate | 1.5% (2022, World Bank) | 11.8% |
| Effective Tariff Rate | 2.4% (2024, actual) | 7.2% |
The Applied Tariff Rate
According to the World Bank, the US’s weighted average applied tariff was 1.5 percent in 2022. We estimate that under the new US tariffs imposed and scheduled to take effect in 2026, the applied rate rises to 11.8 percent. In the days prior to the Supreme Court’s Learning Resources decision, we estimate the applied tariff rate was 14.8 percent, and that it fell to 10.8 percent under the temporary Section 122 replacement tariffs. The applied tariff rate under the current tariffs is below its peak reached prior to the Court decision.
The Effective Tariff Rate
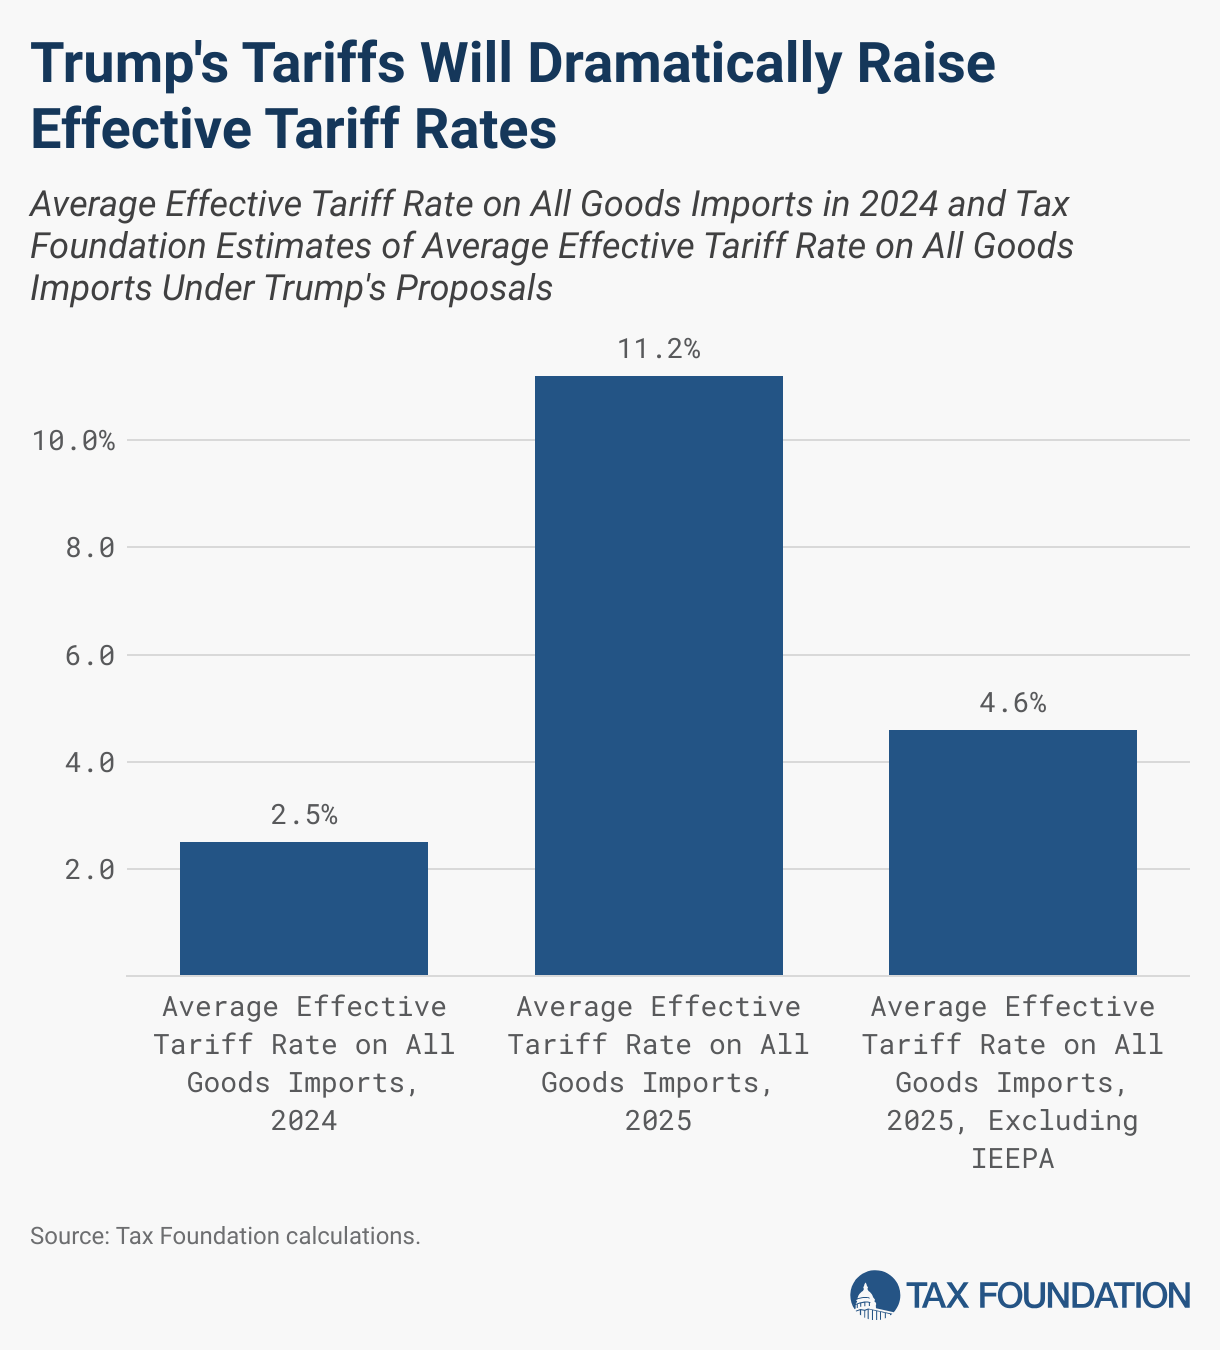
In 2024, the actual effective tariff rate on US goods imports was 2.4 percent, the result of the US collecting $78.9 billion of customs duties and importing $3.3 trillion of goods.
In 2025, the actual effective tariff rate climbed to 7.7 percent, the highest rate since 1947, as customs duties collections rose to $264 billion while goods imports totaled $3.4 trillion. Notably, many of the duties collected in 2025 must be refunded after they were struck down by the Supreme Court.
In 2026, excluding the impact of refunds for the illegally collected tariffs, we estimate the effective tariff rate will be 7.2 percent.

Trade Balance
One of President Trump’s stated goals of imposing tariffs is to shrink the US trade deficit. However, a country’s balance of trade is not solely driven by trade policy, but instead reflects broader macroeconomic balances between saving and investment and net lending and borrowing with the rest of the world.
In the United States, domestic investment outpaces domestic saving, requiring a capital inflow from the rest of the world to close the gap. The capital inflow represents net lending to the United States from the rest of the world to finance business investment as well as the government’s budget deficit. Because tariffs do not directly change the balance between domestic saving and investment, tariffs cannot permanently change the trade balance.

The last time the US ran a trade surplus was in 1975; every year since, the US has run a trade deficit. That the US has consistently run trade deficits for decades is not an imminent economic problem. Net imports, another term for a trade deficit, can reflect the strength of the US economy in attracting foreign investment and in serving as a safe, reliable haven for foreign capital. When net imports finance the capital stock, it allows the US to enjoy a higher level of productivity and growth than otherwise would occur.
In 2025, the trade deficit fell by just $2.1 billion compared to 2024. The reduction in the trade deficit was due to an increase in the trade surplus of services, as the goods deficit actually increased by $25.5 billion year over year.
Actual Customs Duties Revenue Collections
In calendar year 2024, the US federal government collected $79 billion in customs duties. Collections rose to $264 billion in calendar year 2025 after the Trump administration imposed several rounds of new tariffs. In February 2026, however, the Supreme Court struck down the IEEPA tariffs, and the illegally collected revenues (plus interest) were required to be returned to importers. Refunds of the illegally collected duties accelerated in May 2026, offsetting customs duties revenue collections such that the government refunded more than it brought in.
Tax Foundation Projections of Customs Duties Revenue
Tax Foundation estimates the new tariffs will increase direct collections of customs duties revenues by $151.5 billion in 2026 and by $2 trillion over the coming decade. These figures reflect our estimates for how much direct customs duty revenue will be collected under each tariff, which is distinct from how each tariff affects total revenue collections for the US government. Direct customs duty revenue is higher than the net revenue a tariff will generate for the federal government, because each dollar of tariff revenue collected reduces the tax base for income and payroll taxes and may interact with the base of other tariffs.
| Tariff Authority | 10-Year Direct Customs Duties Revenue Collections Before Offsets, in Billions |
|---|---|
| Section 232 Metals | $459.2 |
| Section 232 Autos, Trucks, and Buses | $508.7 |
| Section 232 Furniture/Lumber | $23.6 |
| Section 232 Solar/Polysilicon | $12.0 |
| Section 232 Pharma | $103.3 |
| Section 232 Aircraft/UAS | $28.9 |
| Section 122 | $28.2 |
| Section 301 Forced Labor | $805.6 |
| Section 301 Brazil | $17.7 |
| Section 338 | $30.3 |
| Section 201 Quartz | $0.6 |
| Total | $2,018.10 |
Source: Tax Foundation Tariff Model, September 2026.
Long-Run Macroeconomic Estimates
We estimate that the tariffs will reduce long-run GDP by imposing a wedge between the price a consumer pays and the price a producer receives, which ultimately reduces returns to labor. Lower returns to labor lead to fewer hours worked and lower total output. When output falls, the return to capital falls, reducing investment.
We simulate the long-run effects of the permanent tariffs: Section 232, Section 301, and Section 338. While temporary tariffs are in effect, they will create a drag on economic growth, but we do not capture temporary impacts here.
Altogether, we estimate the imposed and scheduled US tariffs will reduce long-run GDP in the US by 0.4 percent, the capital stock by 0.3 percent, and hours worked by 338,000 full-time equivalent jobs.
We estimate that the retaliatory tariffs on US exports imposed by China and Canada will reduce US long-run GDP by 0.1 percent, the capital stock by 0.1 percent, and hours worked by 131,000 full-time equivalent jobs
Table 3. Long-Run Macroeconomic Effects
Note: Totals may not sum due to rounding.
Long-Run GDP Long-Run Capital Stock Long-Run Hours Worked in Full-Time Equivalent Jobs
Total US Imposed and Scheduled Tariffs -0.4% -0.3% -338,000
232 Metals -0.1% -0.1% -84,000
232 Autos, Trucks, Buses, and Parts -0.1% -0.1% -84,000
Other 232s Under -0.05% Under -0.05% -39,000
Section 301 Forced Labor -0.1% -0.1% -123,000
Section 301 Brazil Under -0.05% Under -0.05% -4,000
Section 338 Under -0.05% Under -0.05% -8,000
Retaliation (Canada, China) -0.1% -0.1% -131,000
Source: Tax Foundation General Equilibrium Model, September 2026.
10-Year Tax Revenue Estimates
Tax Foundation’s conventional tariff revenue estimates incorporate behavioral responses for how imports will fall in response to tariffs, how higher tariff payments mechanically reduce the bases of the income and payroll taxes, and how tariffs, like any other type of tax, are subject to avoidance and evasion. Each line in the table reflects the net impact the tariff has on total US revenue collections, including its effect on the revenue collected by other tariffs and on other types of taxes.
We estimate the tariffs will generate nearly $109 billion in tax revenue in 2026 and $1.4 trillion over the 10-year budget window covering 2026 through 2035, before accounting for how they negatively affect the US economy. The negative economic impact of the tariffs lowers the 10-year revenue score by $382 billion to $1 trillion.
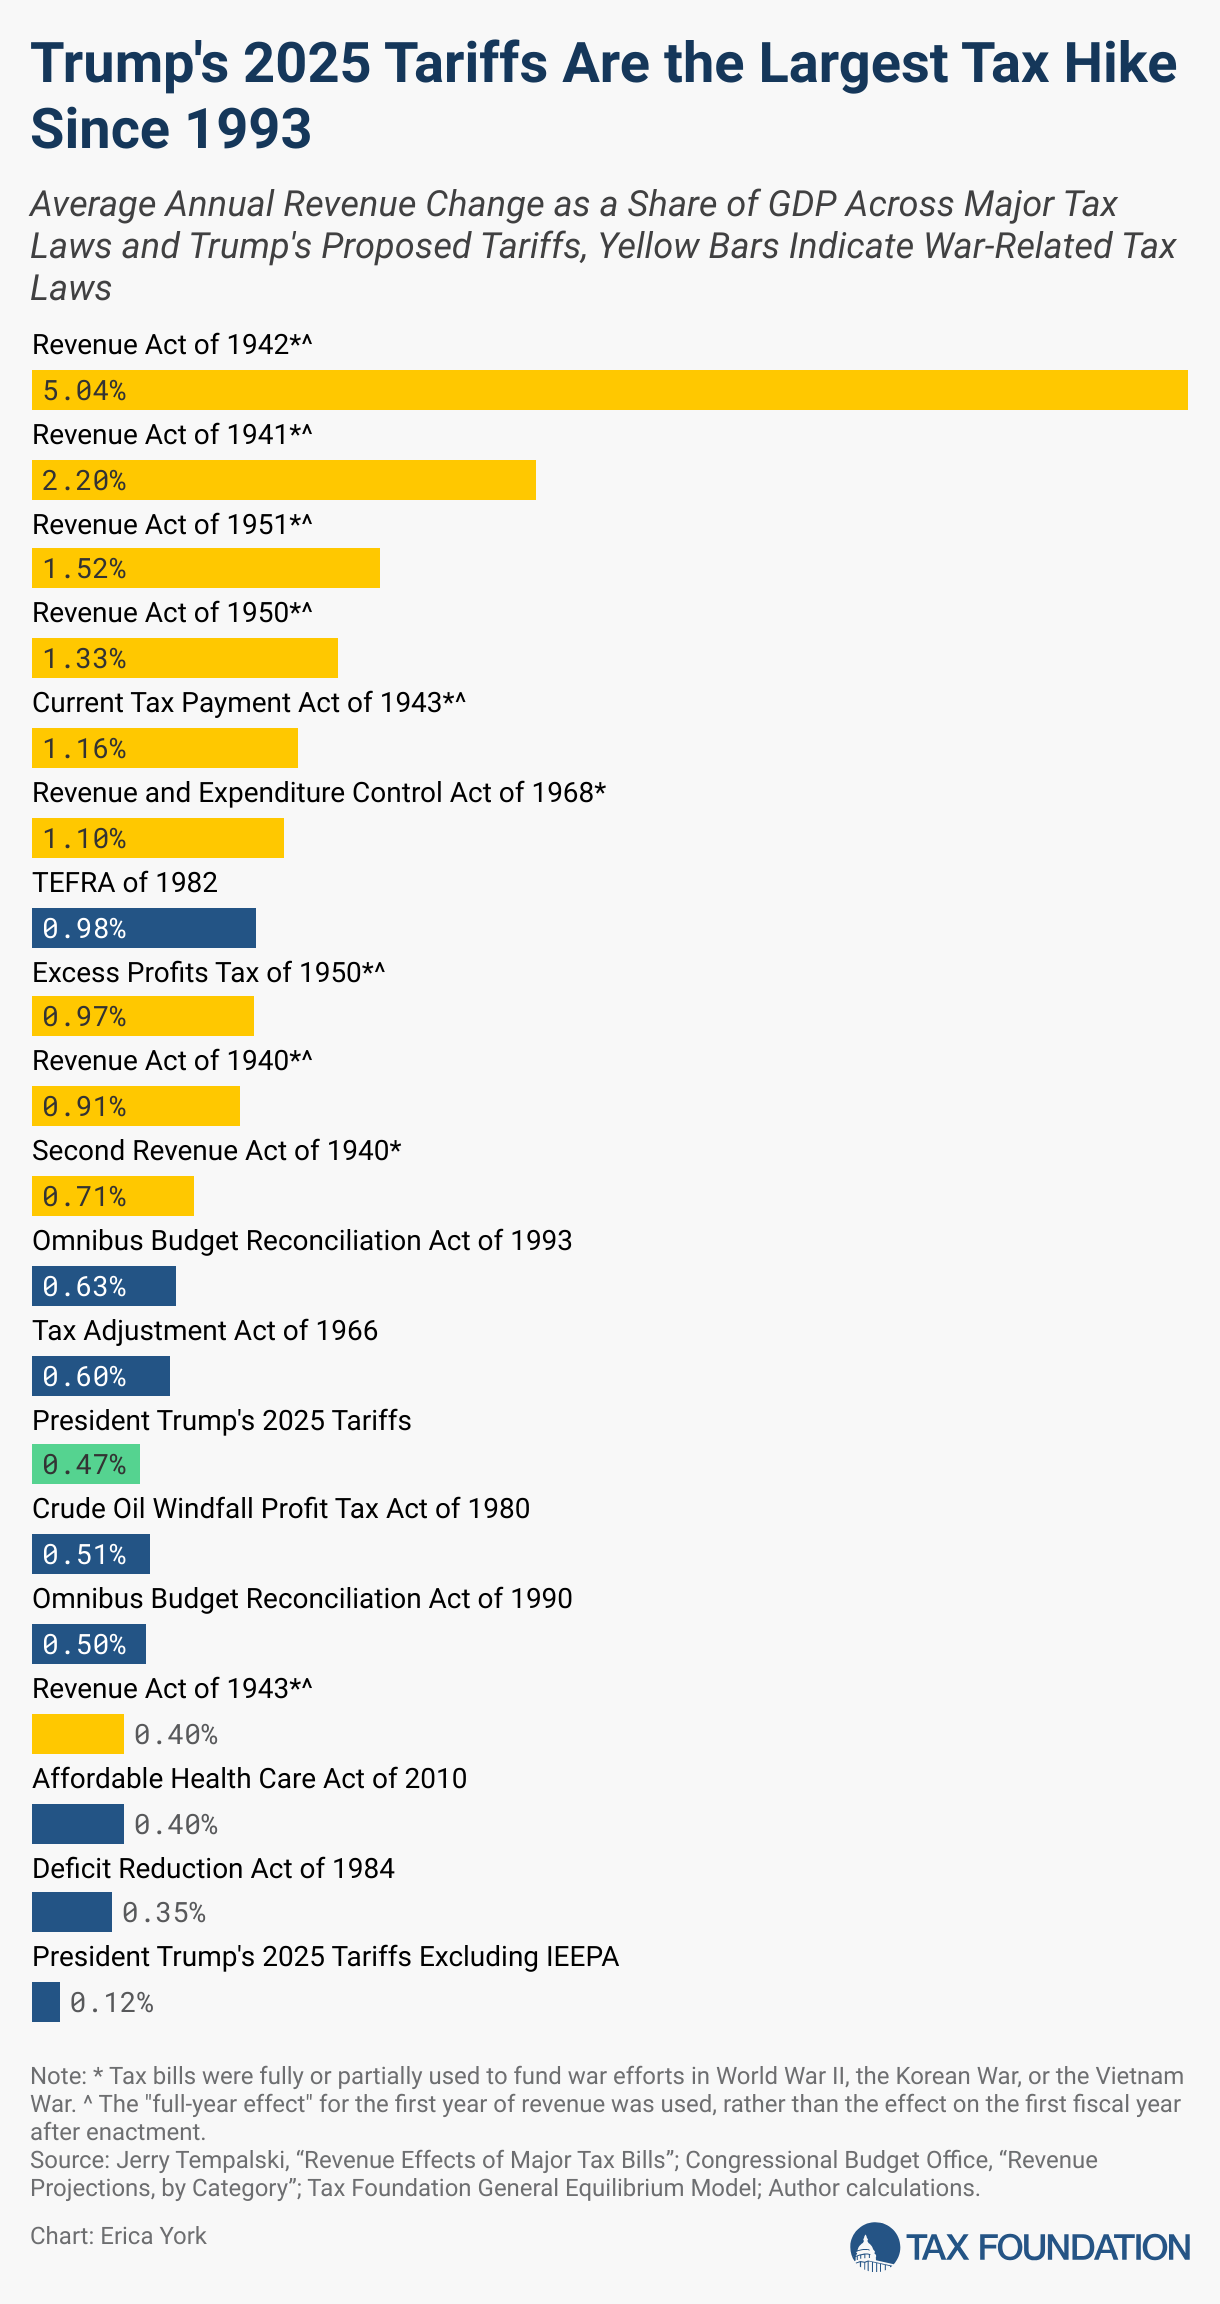
As a share of GDP, we estimate the new tariffs will increase tax revenues by 0.36 percent in 2026, placing the tariffs within the top 20 largest tax hikes as a share of GDP since 1940.
Table 4. Total Tariff Revenue Estimates
Conventional, in Billions Dynamic, in Billions
Calendar Year 2026 $108.5 $81.2
10-Year Budget Window, 2026-2035 $1,426.1 $1,043.9
Table 5. Detailed Tariff Revenue Estimates
| Conventional Revenue, 2026-2035 in Billions | Dynamic Revenue, 2026-2035 in Billions | |
|---|---|---|
| Total | $1,426.1 | $1,043.9 |
| Section 232 Metals | $311.0 | $213.4 |
| Section 232 Autos, Trucks, and Buses | $362.0 | $264.4 |
| Section 232 Other and 201 Quartz | $124.0 | $79.1 |
| Section 122 (Only in effect 150 days in 2026) | $20.5 | $18.7 |
| Section 301 Forced Labor | $571.6 | $440.5 |
| Section 301 Brazil | $16.1 | $16.0 |
| Section 338 | $20.8 | $11.7 |
Source: Tax Foundation Tariff Model and General Equilibrium Model, August 2026.
US Taxpayer and Household Burdens
We provide three estimates of how the new tariffs affect people in the US: percent change in after-tax income among tax units, nominal tax change among tax units, and overall average change in tax burden among US households. Our estimates do not capture additional costs people in the US may experience, such as higher-priced alternatives and reduced consumer choice.
In dollar terms, the tariff burden rises with income. For example, we estimate that in 2026, tax filers in the bottom quintile experience a $73 decline in after-tax income compared to $1,868 in the top quintile. As a percentage of income, however, tariffs impose a larger burden on lower-income groups, averaging a 0.7 percent decline in after-tax income in 2026, and the burden declines for taxpayers at the top, falling to 0.6 percent and 0.5 percent within the top 1 percent.
In 2025, we estimated the newly imposed tariffs amounted to an average tax increase of $1,000 per US household. In 2026, we estimate the tariffs will amount to an average tax increase of $820 per US household, as the tariffs struck down by the Supreme Court have not been fully replaced.
Table 6. Distributional Effects
Note: Market income includes adjusted gross income (AGI) plus 1) tax-exempt interest, 2) non-taxable Social Security income, 3) the employer share of payroll taxes, 4) imputed corporate tax liability, 5) employer-sponsored health insurance and other fringe benefits, 6) taxpayers’ imputed contributions to defined-contribution pension plans. Market income levels are adjusted for the number of exemptions reported on each return to make tax units more comparable. After-tax income is market income less: individual income tax, corporate income tax, payroll taxes, estate and gift tax, customs duties, and excise taxes. The 2026 income break points by percentile are: 20%-$17,735; 40%-$38,572; 60%-$73,905; 80%-$130,661; 90%-$188,849; 95%-$266,968; 99%-$611,194. Tax units with negative market income and non-filers are excluded from the percentile groups but included in the totals.
Market Income Percentile Percent Change in After-Tax Income Under the Tariffs, 2026 Nominal Tax Change, 2026
0% - 20% -0.7% $73
20% - 40% -0.7% $199
40% - 60% -0.7% $387
60% - 80% -0.7% $684
80% - 100% -0.7% $1,868
80% - 90% -0.7% $1,089
90% - 95% -0.7% $1,524
95% - 99% -0.7% $2,536
99% - 99.9% -0.6% $6,074
99.9% - 100% -0.5% $32,219
Source: Tax Foundation General Equilibrium Model, August 2026
Methodology
Tax Foundation’s Tariff Model and General Equilibrium Model
Tax Foundation uses its Tariff Model to simulate the conventional revenue effects of changes in US tariff policy. The model contains data at the HTS-10 level for imports from each US trading partner and selected trade programs (such as the United States-Mexico-Canada free trade agreement) from the US Census Bureau. We project that data across the 10-year budget baseline using forecasts from the Congressional Budget Office. When producing revenue estimates, the model applies a 10 percent non-compliance rate, an elasticity of -2, and income and payroll tax offsets obtained from Tax Foundation’s microsimulation model. The model also estimates changes in the applied tariff rate, the average tariff rate, the imports covered by tariff actions, and the average tariff burden per US household under a simulation.
Tax Foundation uses its General Equilibrium Model to simulate the macroeconomic effects and dynamic revenue feedback of tariffs. The model has three main components that work together to produce estimates.
The first component is a tax simulator, which produces estimates of marginal tax rates on different sources of personal and business income and produces estimates of income and payroll tax offsets. The second component of the model is a neoclassical production function, which estimates long-run changes in the level of output based on changes in the capital stock and labor force in response to policy. The third component of the model is an allocation model, which takes outputs from the tax and production models and combines them with aggregate accounting identities and saving responses to forecast the different components of GDP, the balance between saving and investment, the international account, wealth, and gross national product (GNP).
To model the macroeconomic effect of tariffs, we simulate how the tax wedge on labor introduced by tariffs reduces incentives to work. The resulting reduction in labor supply reduces economic output, which reduces returns to capital and leads to less capital investment and a smaller capital stock.
Some tariffs, namely those that apply to capital inputs, would have a direct effect on the cost of capital in the US. Additionally, in the long run, tariffs can further reduce productivity by reallocating workers and investment to less productive sectors of the economy. We do not incorporate either effect into our modeling, and so it is likely that we understate the negative economic impact of tariffs.
Tariffs in the Current Update
Section 232 Tariffs
- Steel
- Aluminum
- Copper
- Autos and auto parts
- Heavy trucks and buses
- Lumber and furniture
- Pharmaceuticals
- Polysilicon
- Unmanned aircraft systems
Section 201 tariffs
Section 301 Tariffs
- 60 trading partners, including the EU, related to forced labor investigation
- Brazil
Section 338 Tariffs
Archive of Updates to the Tariff Tracker
- September 10, 2026: We updated the tracker to provide a breakout of direct customs duty collection estimates by tariff authority and to reflect changes in the Section 338 tariffs on Canada and the retaliatory tariffs.
- September 2, 2026: We updated the tracker to separate the Section 301 forced labor tariffs from the Section 301 Brazil tariffs. We estimate the Section 301 forced labor tariffs will raise $611.7 billion from 2026-2035 on a conventional basis net of offsets (the direct tariff revenue before offsets is higher, at $797 billion).
- August 20, 2026: We updated the tracker for new Section 232 tariffs on polysilicon and unmanned aircraft systems, as well as new Section 201 tariffs on quartz surface products. We fixed an issue with modeling tariff interactions. We also reorganized the page and archive.
- July 24, 2026: We updated estimates for the Section 232 tariffs on steel, aluminum, and copper to account for changes in June, the new Section 301 tariffs, and the new Section 338 tariff on Canada.
- April 27, 2026: We updated estimates for the Section 232 tariffs on steel, aluminum, and copper; provided new estimates for Section 232 tariffs on pharmaceuticals; and updated the applied rate time series to reflect more detailed steel and aluminum tariff modeling.
- March 13, 2026: We added a distribution table for Section 122 tariff, revenue for de minimis, and timelines on new Section 301 investigations.
- February 24, 2026: The Section 122 tariffs took effect at 10 percent, not the threatened 15 percent.
- February 23, 2026: We included estimates of the new Section 122 tariff of 10 percent that applies to all countries and the increase of the Section 122 tariffs to 15 percent.
- February 20, 2026: The Supreme Court ruled the president cannot impose tariffs under IEEPA. We added the average tariff rate for 2025, a section on the trade deficit for 2025, and new estimates reflecting the recent Supreme Court ruling that the IEEPA tariffs are illegal.
- February 6, 2026: Economic and revenue estimates were updated to account for lower tariff rates on India, and the tariff timeline was updated with new threats on Canada and Mexico. New distributional details were added as well.
- January 23, 2026: Updated revenue estimates for 2035 were added, moving the tracker into the next 10-year revenue baseline. We updated economic and revenue estimates to account for lower tariff rates on Taiwan (from 20 percent to 15 percent) and certain South Korea Section 232 covered imports. Revenue estimates for Canada and Mexico were adjusted based on the latest trade data for USMCA imports. We also updated the timeline section for new proclamations related to the Section 232 investigations into imports of semiconductors and critical minerals.
- January 9, 2026: Updated economic and revenue estimates for the tariffs with new adjustments to income and payroll tax offsets.
- December 1, 2025: Includes updated estimates to account for new Brazil exemptions on certain food and agricultural products and adjustments to the IEEPA Canada and Mexico estimates to account for higher shares of USMCA-compliant imports. Based on 2024 import shares, 38 percent of imports from Canada and 49 percent of imports from Mexico were brought in under USMCA; more recent data, averaged from April through July of 2025, show USMCA shares had risen to 65 percent for Canada and 57 percent for Mexico.
- November 17, 2025: Includes updated estimates to account for new exemptions on certain food and agricultural products, valued at about $51.5 billion based on 2024 import levels, and a lowering of Switzerland’s reciprocal tariff rate from 39 percent to 15 percent.
- November 11, 2025: Includes updated estimate for Mexico tariffs to account for pause in tariff increase, incorporates a 10 percent tariff on buses, and adds a new exemptions list for Cambodia.
- October 31, 2025: Includes new estimates incorporating the lower IEEPA tariff rate on China, as well as other adjustments to tariff stacking.
- October 27, 2025: Includes new estimates for the IEEPA and Section 232 tariffs, including taking the 100 percent tariff on China off the table, adding another 10 percent tariff on Canada, and placing Section 232 tariffs on heavy trucks. All estimates now reflect new income and payroll tax offsets to account for the One Big Beautiful Bill Act and refined elasticity effects.
- October 17, 2025: Includes new estimates for the Section 232 tariffs on lumber, furniture, and cabinets, and a new estimate for the additional 100 percent tariff on China.
- October 10, 2025: Includes updated estimates for the reciprocal tariffs to account for new EU exemptions.
- October 3, 2025: Includes updated timeline for new Section 232 tariffs on pharmaceuticals, lumber, heavy trucks, and furniture.
- September 26, 2025: Includes updated Section 232 revenue estimates to account for the reduced rate applied to auto imports from Japan.
- September 12, 2025: Updated estimates for the reciprocal tariffs to account for new exemptions issued on September 5.
- September 5, 2025: Includes updated timeline with US Court of Appeals ruling on IEEPA tariffs, and new estimates for both the reciprocal tariffs and the retaliatory tariffs.
- August 22, 2025: Includes updated timeline with EU trade deal details and new tariffs on steel and aluminum derivatives.
- August 15, 2025: Includes updated revenue and economic estimates for the China reciprocal tariffs due to the extension of the 90-day pause.
- August 8, 2025: Includes updated revenue and economic estimates for the reciprocal tariffs, copper tariffs, and eliminating the de minimis exemption.
- August 1, 2025: Includes updated revenue and economic estimates for the reciprocal tariff revisions released on July 31.
- July 29, 2025: Includes updated revenue and economic estimates for the reciprocal tariffs following new deals with the EU, Japan, and other countries
- July 15, 2025: Includes updated revenue and economic estimates for the reciprocal tariffs and an update on the EU retaliatory tariffs.
- July 14, 2025: Updated revenue and economic estimates for the reciprocal tariffs and the Section 232 copper tariffs.
- July 9, 2025: Includes an update to the timeline on implementation of reciprocal tariffs, and updated revenue and economic estimates for those tariffs.
- July 3, 2025: Includes updated tariff revenue and economic growth estimates reflecting the US-UK trade deal, and new details for the timeline on the forthcoming US-Vietnam trade deal.
- June 17, 2025: Includes additional chart on monthly customs duties revenues.
- June 13, 2025: Includes details on court case developments, 90-day tariff pause for China trade deal, and a further expansion to steel tariffs.
- June 2, 2025: Includes doubling of Section 232 steel and aluminum tariffs from 25 percent to 50 percent.
- May 30, 2025: Adds to the timeline the injunction issued by the US Court of International Trade that declared the IEEPA tariffs unconstitutional and shows the economic, revenue, and distributional impacts if the decision is upheld.
- May 27, 2025: Includes new chart showing daily deposits of tariff and certain excise tax payments in calendar year 2025 compared to calendar year 2024.
- May 27, 2025: Includes delay for 50 percent "reciprocal" tariffs on all imports from the EU.
- May 23, 2025: Includes 50 percent “reciprocal” tariff on all imports from the EU in economic, revenue, and distributional estimates.
- May 12, 2025: Includes 90-day reduction in tariffs on imports from China in revenue estimates, separates economic and revenue estimates to display 10 percent baseline tariff separately from scheduled increases in tariffs, updates all economic, revenue, and distributional results to the latest version of Tax Foundation’s model.
- May 9, 2025: Adds information on the US-UK deal to eventually reduce auto tariffs and steel and aluminum tariffs.
- May 5, 2025: Incorporates new stacking order executive order so that only one of the Section 232 tariffs or IEEPA “fentanyl” tariffs on Canada or Mexico applies.
- April 18, 2025: Includes new exemption for electronics imports from the “reciprocal” tariffs.
- April 11, 2025: New chart on weighted average tariff rates and incorporates China’s higher retaliatory rate on US exports.
- April 10, 2025: Includes the 90-day pause of escalating the so-called reciprocal tariffs that apply to nearly all US trading partners and the increase to 125 percent reciprocal tariffs on China.
- April 9, 2025: Includes the additional 50 percent tariff on all imports from China.
- April 4, 2025: Includes new retaliatory tariffs announced by China and Canada.
- April 3, 2025: Reflects exemption list published on April 3 for the April 2 universal tariffs.
- April 3, 2025: Update reflects President Trump’s new April 2 tariffs related to a national economic emergency on 60 trading partners at specific rates, other trading partners at 10 percent, and non-USMCA Canada and Mexico imports at a 12 percent rate after IEEPA fentanyl tariffs end, and updated auto, steel, and aluminum tariffs.
- April 1, 2025: Timeline includes new details on Section 232 auto and auto part tariffs, and modeling includes new tariffs on auto imports, Venezuela, and trading partners that import oil from Venezuela.
- March 25, 2025: Updated timeline to add new “secondary” tariff threat on imports from Venezuela and countries that purchase oil or gas from Venezuela.
- March 21, 2025: Updated timeline for EU retaliation against US Section 232 tariffs.
- March 12, 2025: New revenue and economic estimates for changes to IEEPA tariffs and implementation of Section 232 steel and aluminum tariffs.
- March 7, 2025: Updates timeline for Canada, Mexico, and China tariffs. Tax Foundation is in the process of updating economic and revenue estimates for these developments.
- March 4, 2025: President Trump imposed new tariffs on three of the country's largest trading partners: Canada, Mexico, and China.
- March 3, 2025: Added threatened lumber and agricultural tariffs to timeline.
- February 27, 2025: New estimates for the proposed 25 percent tariff on EU imports and the increase in tariff rates on China. The update also incorporates the latest version of Tax Foundation’s General Equilibrium Model and updates to our tariff modeling to reflect the latest tax and economic data and a refinement to our tariff noncompliance assumption.
- February 19, 2025: Updated to include details around the 2025 trade war timeline and provide analysis of Trump's auto, steel, and aluminum tariffs.
- February 13, 2025: Updated to include analysis of Trump's expanded steel and aluminum tariffs.
- February 11, 2025: Updated to include new revenue collection data for the Trump-Biden tariffs.
- February 10, 2025: We rearranged the tracker and added an estimate of the value of US exports targeted by China’s retaliatory tariffs.
- February 6, 2025: Updated to include the revenue effects of ending duty-free de minimis treatment of imports from China.
- February 4, 2025: Updated to include additional distributional and historical analysis.
- February 1, 2025: Updated to include the 10 percent tariff on Canadian energy resources.
- January 31, 2025: Updated to include additional analysis of the proposed 25 percent tariffs on Canada and Mexico that could begin February 1, 2025.
- January 23, 2025: Updated to separate out 25 percent tariffs on Canada and Mexico given recent threats that these tariffs could begin February 1, 2025.
- November 26, 2024: The update contains modeling of President-elect Trump’s proposed 25 percent tariffs on Canada and Mexico and 10 percent tariff on China.
- June 26, 2024: The update adds import data through 2023, new data on tariff collections, and updated model results for imposed, retaliatory, and proposed tariffs. The modeling updates reflect President Biden’s tariff increases and former President Trump’s tariff proposals.
- September 19, 2023: The update adds a new column to the “Imports Affected by US Tariffs” table, reflecting import data for calendar year 2022, data updates for prior years, and tariff-rate quotas that took effect in 2022 for certain steel and aluminum imports.
- July 7, 2023: Tariffs on washing machines expired in February 2023 after an initial three-year period and a two-year extension. The Biden administration provided a two-year suspension of solar panel tariffs for four Southeast Asian nations beginning in 2022. The update adjusts the revenue and economic results for imposed tariffs.
- April 1, 2022: The Biden administration has reached deals to replace steel and aluminum tariffs with tariff rate quotas for the European Union and United Kingdom and steel tariffs with tariff-rate quotas for Japan. The deals also eliminate tariffs on derivative goods from the same jurisdictions and will bring an end to related retaliatory tariffs. The update adjusts revenue and economic estimates for imposed and retaliatory tariffs and adds a new table illustrating how import levels of affected goods have changed since 2017.
- October 19, 2021: Under President Biden, the US will suspend tariffs on aircraft and other goods from the EU under a five-year pause in the ongoing Boeing-Airbus dispute. We have reorganized the layout of the tracker.
- September 18, 2020: US to eliminate tariffs on $2.5 billion worth of Canadian aluminum that had been imposed on August 16, 2020, to avoid Canadian retaliatory tariffs.
- August 13, 2020: US to reimpose tariffs on $2.5 billion worth of Canadian aluminum on August 16, 2020, and Canada to impose retaliatory tariffs.
- February 14, 2020: US reduces tariffs on $120 billion of Chinese goods by half to 7.5 percent, and China reduces tariffs on approximately $75 billion of US goods in half to 2.5 percent and 5 percent.
- December 16, 2019: US postpones the scheduled tariff of 15 percent on $160 billion worth of goods from China indefinitely and announces plans to decrease the 15 percent tariff on $120 billion worth of goods from China to 7.5 percent (date unknown, will be included in the model when the decrease takes effect). China took corresponding measures and canceled its schedule tariff increase.
- December 5, 2019: US concludes Section 301 investigation into France's Digital Services Tax, threatens tariffs on $2.4 billion of French products. Our analysis now includes tariffs on solar panels and washing machines.
- October 18, 2019: US imposes 10 percent and 25 percent tariffs on $7.5 billion European Union goods under WTO ruling.
- October 15, 2019: US postpones scheduled tariff hike from 25 percent to 30 percent on $250 billion worth of goods from China.
- October 3, 2019: US announces 10 percent and 25 percent tariffs on $7.5 billion European Union goods under WTO ruling, with the authority to raise the tariffs to 100 percent.
- September 12, 2019: US delays tariff increase from 25 percent to 30 percent on $250 billion worth of Chinese goods from Oct. 1 until Oct. 15.
- August 26, 2019: US announces the 25 percent tariff on $250 billion of Chinese goods would increase to 30 percent, effective Oct. 1, after a comment period.
- August 23, 2019: China announces additional tariffs on $75 billion of US imports, from 5-10 percent, and will resume tariffs on US cars and car parts suspended earlier in 2019. Tariffs to begin Sep. 1 and end Dec. 15. US announces 10 percent tariff on $300 billion of Chinese goods to increase to 15 percent, some beginning Sep. 1, others on Dec. 15.
- August 13, 2019: US announces 10 percent tariff on $300 billion of Chinese goods would be delayed from Sep. 1 until Dec. 15.
- August 1, 2019: US announces 10 percent tariff on $300 billion of Chinese goods, to be levied on Sep. 1, lowered from the previously announced 25 percent on $325 billion.
- July 20, 2019: US confirms announced July 5 plans to impose tariffs on all Chinese imports, roughly $500 billion of goods, modeled as a 10 percent tariff.
- July 5, 2019: US again threatens additional tariffs on Chinese imports if China further retaliates, increasing threats from levies on $200 billion and another $200 billion to $200 billion and $300 billion.
- June 10, 2019: US “indefinitely suspended” previously announced tariffs against Mexican products, set to begin at a 5 percent rate in June and gradually rise to 25 percent.
- May 31, 2019: US threatens 5 percent tariff beginning June 10 on $346.5 billion of imports from Mexico until illegal immigration across the southern border stops. It would rise to 10 percent on July 1; 15 percent on Aug. 1; 20 percent on Sep. 1; and 25 percent on Oct. 1.
- May 22, 2019: US announces it will lift steel and aluminum tariffs on Canada and Mexico, and those nations will lift their retaliatory tariffs.
- May 10, 2019: US announces it will raise tariffs on $200 billion of imports from China from 10 percent to 25 percent, with threats to impose an additional 25 percent on $325 billion of goods.
- August 29, 2018: Tax Foundation separated our automobile tariff estimate to show auto imports from Canada, and made slight estimate adjustments to correct for rounding.
- August 16, 2018: US doubles the tariffs on steel and aluminum imports from Turkey, which responds by doubling its tariffs on 22 US products.
- August 8, 2018: US threatens a 10 percent tariff on $200 billion of Chinese goods if China retaliates for the previous 10 percent tariff, and that would extend to an additional $200 billion of goods. This would amount to a $40 billion tax increase.
- August 1, 2018: US considers increasing the proposed 10 percent tariff to 25 percent on $200 billion of Chinese imports. That would be a $30 billion tax increase.
- July 20, 2018: US reaffirms plans to impose tariffs on all Chinese imports (roughly $500 billion).
- July 13, 2018: Russia will begin placing tariffs on US goods, worth about $87.6 million. (Slight adjustments were made to our estimates to correct for rounding.)
- July 6, 2018: US announces readiness to target an additional $200 billion in Chinese imports, and an additional $300 billion after that—an increase of $100 billion from previous threats.
- June 28, 2018: Turkey will begin placing tariffs on US goods, worth about $266.5 million.
Featured Experts
Have a question about our tariffs and trade analysis above? Contact us to connect with a federal tax policy expert or click on the experts below to request them as a speaker at your upcoming event.
 Short Form