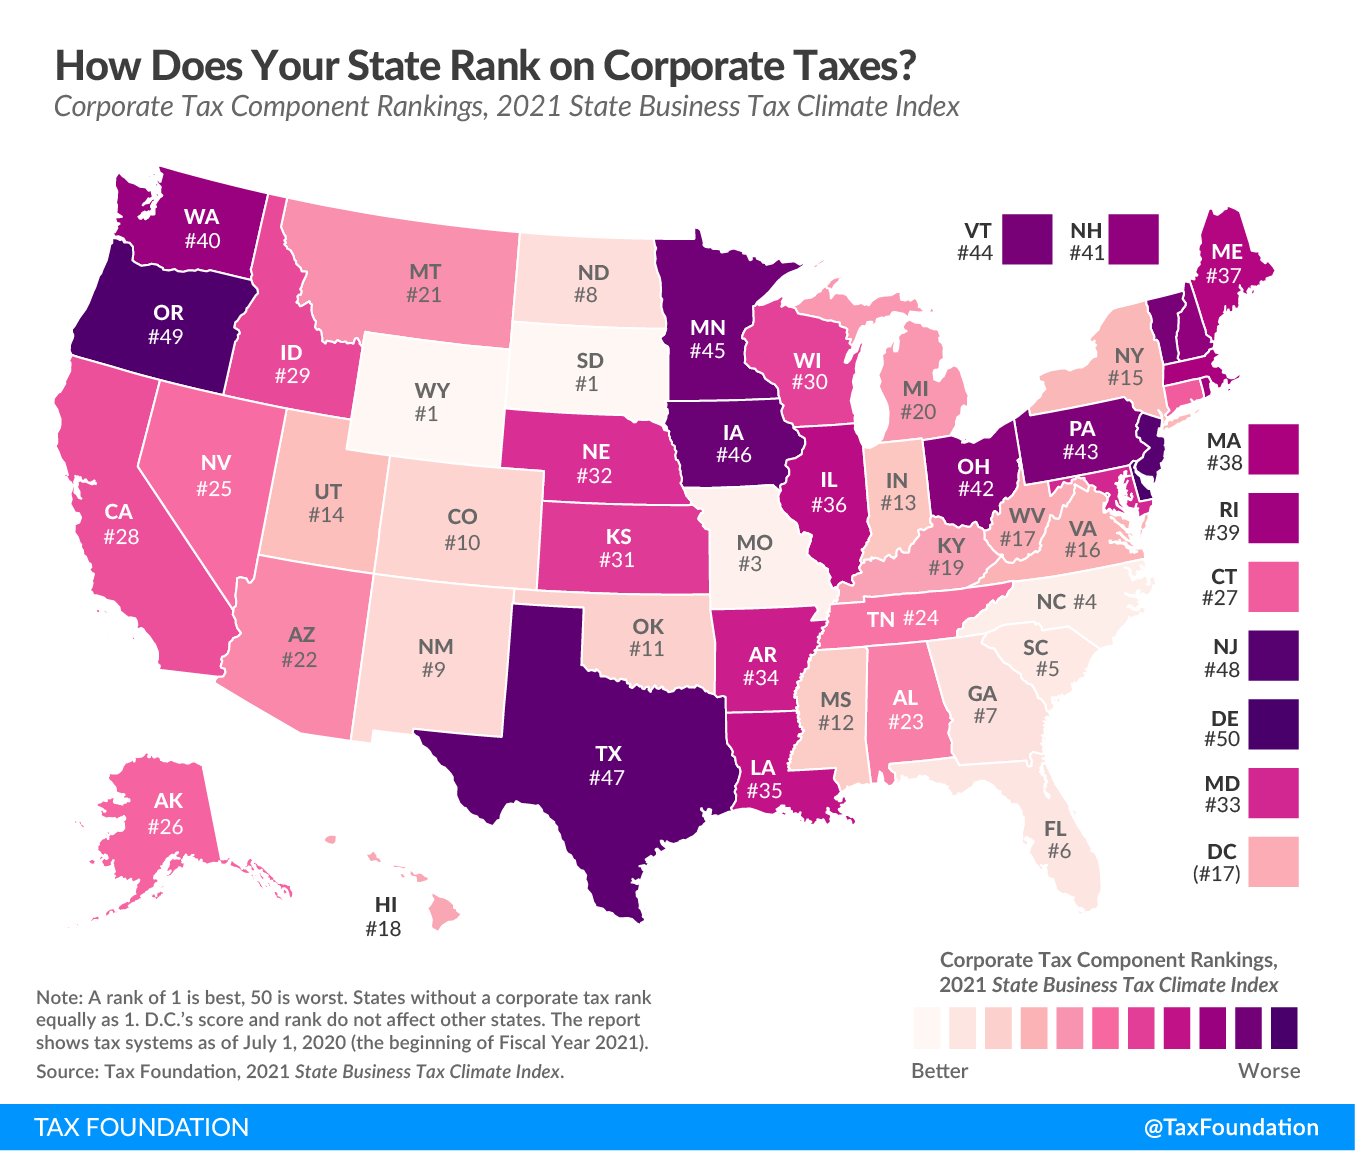
In the coming weeks, we will break down our recently released 2021 State Business Tax Climate Index with maps illustrating each of the five major components of the Index: corporate, individual, sales, property, and unemployment insurance taxes. Today we look at states’ rankings on the corporate tax component, which accounts for 20.8 percent of each state’s overall rank.
The corporate taxA tax is a mandatory payment or charge collected by local, state, and national governments from individuals or businesses to cover the costs of general government services, goods, and activities. component of our Index measures each state’s principal tax on business activities. Most states levy a corporate income taxA corporate income tax (CIT) is levied by federal and state governments on business profits. Many companies are not subject to the CIT because they are taxed as pass-through businesses, with income reportable under the individual income tax. on a company’s profits (receipts minus most business expenses, including compensation and the cost of goods sold), while some states levy gross receipts taxes, which allow few or no deductions for a company’s expenses.
Unlike other studies that look solely at tax burdens, the Index measures how well or poorly each state structures its tax system. It is concerned with the how, not the how much, of state revenue, because there are better and worse ways to levy taxes. Our corporate tax component, for example, scores states not just on their corporate tax rates and brackets, but also on how they handle net operating losses, whether they levy gross receipts-style taxes (which are more economically harmful than corporate income taxes), whether businesses can fully expense purchases of machinery and equipment, and whether states index their brackets for inflation, among other factors.
Click here to see an interactive version of states’ corporate tax rankings, and then click on your state for more information about how its tax system compares both regionally and nationally.
| State | 2018 Rank | 2019 Rank | 2020 Rank | 2021 Rank | Change from 2020 to 2021 |
|---|---|---|---|---|---|
| Alabama | 22 | 22 | 23 | 23 | 0 |
| Alaska | 26 | 25 | 26 | 26 | 0 |
| Arizona | 14 | 15 | 22 | 22 | 0 |
| Arkansas | 39 | 40 | 34 | 34 | 0 |
| California | 32 | 38 | 28 | 28 | 0 |
| Colorado | 18 | 5 | 7 | 10 | -3 |
| Connecticut | 31 | 34 | 27 | 27 | 0 |
| Delaware | 50 | 50 | 50 | 50 | 0 |
| Florida | 19 | 11 | 9 | 6 | 3 |
| Georgia | 10 | 8 | 6 | 7 | -1 |
| Hawaii | 11 | 12 | 16 | 18 | -2 |
| Idaho | 25 | 28 | 29 | 29 | 0 |
| Illinois | 36 | 37 | 36 | 36 | 0 |
| Indiana | 23 | 18 | 11 | 13 | -2 |
| Iowa | 48 | 47 | 48 | 46 | 2 |
| Kansas | 38 | 32 | 35 | 31 | 4 |
| Kentucky | 27 | 20 | 17 | 19 | -2 |
| Louisiana | 40 | 35 | 37 | 35 | 2 |
| Maine | 41 | 33 | 38 | 37 | 1 |
| Maryland | 20 | 26 | 32 | 33 | -1 |
| Massachusetts | 35 | 39 | 39 | 38 | 1 |
| Michigan | 8 | 13 | 18 | 20 | -2 |
| Minnesota | 43 | 44 | 46 | 45 | 1 |
| Mississippi | 12 | 14 | 10 | 12 | -2 |
| Missouri | 5 | 6 | 5 | 3 | 2 |
| Montana | 13 | 9 | 21 | 21 | 0 |
| Nebraska | 28 | 29 | 31 | 32 | -1 |
| Nevada | 33 | 21 | 25 | 25 | 0 |
| New Hampshire | 45 | 46 | 43 | 41 | 2 |
| New Jersey | 42 | 49 | 49 | 48 | 1 |
| New Mexico | 24 | 23 | 20 | 9 | 11 |
| New York | 7 | 17 | 13 | 15 | -2 |
| North Carolina | 3 | 3 | 3 | 4 | -1 |
| North Dakota | 16 | 16 | 19 | 8 | 11 |
| Ohio | 47 | 43 | 42 | 42 | 0 |
| Oklahoma | 9 | 19 | 8 | 11 | -3 |
| Oregon | 34 | 30 | 33 | 49 | -16 |
| Pennsylvania | 44 | 45 | 45 | 43 | 2 |
| Rhode Island | 30 | 36 | 40 | 39 | 1 |
| South Carolina | 15 | 4 | 4 | 5 | -1 |
| South Dakota | 1 | 1 | 1 | 1 | 0 |
| Tennessee | 21 | 27 | 24 | 24 | 0 |
| Texas | 49 | 48 | 47 | 47 | 0 |
| Utah | 4 | 7 | 12 | 14 | -2 |
| Vermont | 37 | 41 | 44 | 44 | 0 |
| Virginia | 6 | 10 | 14 | 16 | -2 |
| Washington | 46 | 42 | 41 | 40 | 1 |
| West Virginia | 17 | 24 | 15 | 17 | -2 |
| Wisconsin | 29 | 31 | 30 | 30 | 0 |
| Wyoming | 1 | 1 | 1 | 1 | 0 |
| District of Columbia | 26 | 24 | 15 | 17 | -2 |
|
Note: A rank of 1 is best, 50 is worst. All scores are for fiscal years. DC’s score and rank do not affect other states. Source: Tax Foundation. |
|||||
Note: This map is part of a series in which we will examine each of the five major components of our 2021 State Business Tax Climate Index.
Stay informed on the tax policies impacting you.
Subscribe to our free newsletter to get the latest tax data, news and analysis.
Subscribe