A video surfaced yesterday quoting presidential candidate Mitt Romney expressing concerns about a group he described as:
“… 47 percent who are with [President Obama], who are dependent upon government, who believe that they are victims, who believe the government has a responsibility to care for them, who believe that they are entitled to health care, to food, to housing, to you-name-it.”
Though much of the scrutiny Romney has received for the comments has focused on what he now describes as “inelegantly stated” opinions on government dependency, data does support the notion that increasingly few Americans pay federal taxes while the number receiving more in benefits than they pay in taxes is growing.
My colleague, William McBride, has already discussed the number of nonpayers of the federal income taxA tax is a mandatory payment or charge collected by local, state, and national governments from individuals or businesses to cover the costs of general government services, goods, and activities. —41 percent of those filing a tax return and 46-51 percent of the total population—and further details the growing income level of these nonpayers.
While many who pay no federal income tax still pay payroll taxes dedicated to Social Security and Medicare benefits, a significant number receive those tax payments back completely through refundable tax credits. A study by the Joint Committee on Taxation found that in 2009, 23 million nonpayers that filed an income tax return got a larger sum back in the form of refundable tax credits than they paid in the form of the employee share of the payroll taxA payroll tax is a tax paid on the wages and salaries of employees to finance social insurance programs like Social Security, Medicare, and unemployment insurance. Payroll taxes are social insurance taxes that comprise 24.8 percent of combined federal, state, and local government revenue, the second largest source of that combined tax revenue. (6.2% of income). 15.5 million nonpayers received refundable tax credits that exceeded the value of both the employee and employer share of the payroll tax (12.4% of income). More broadly, I laid out in a recent blog post that the bottom 20 percent of income earners paid zero federal taxes on average in 2008 and 2009, according to CBO data.*
Using that same CBO data set, one can examine how many Americans receive more in government transfer benefits than they pay in federal taxes. Greg Mankiw recently posted a blog displaying the 2009 results and in a forthcoming paper, I’ll be publishing these results from 1979-2009.** The chart below is a preview of the results of that paper. The chart shows total federal tax liability minus total government benefits received (federal, state, and local) as a percent of market income (income earned through work and savings). Because the bottom income quintile receives so much in benefits, the inclusion of that quintile substantially skews the chart. Below the top chart, we remove the bottom income quintile so the top four quintiles can be examined more closely.
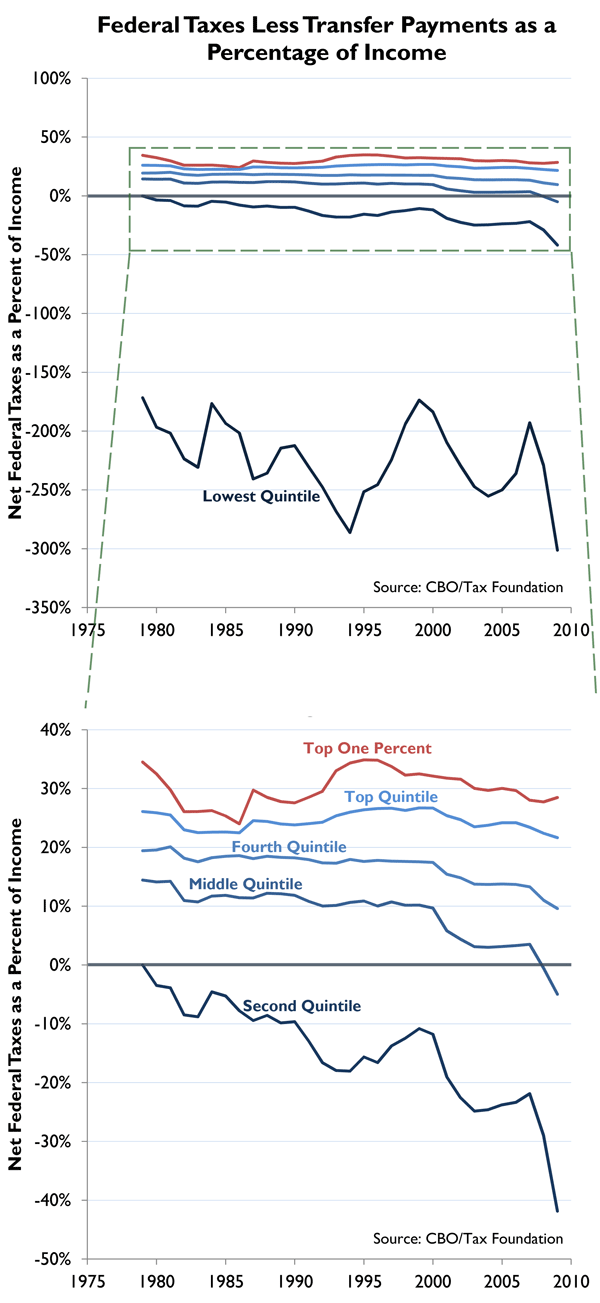
The key takeaway from these charts is that in 2008 and 2009 many taxpayers, particularly lower-income taxpayers, received more in total transfer benefits than they paid in all federal taxes, on average. Most notably, the middle income quintile now receives more in average benefits than it pays in average taxes, after paying net federal taxes (taxes minus transfer benefits) of at least 10% for all of the 1980s and 1990s. Though the low figures from 2008-2009 are the result of the recession, it’s unclear if or when these rates will again rise above zero.
Finally, when total federal spending (not just transfer benefits) is considered along with federal taxes, we similarly see that the bottom 60 percent of families received more in government benefits and services than the group paid in federal taxes. Specifically, these 60 percent of families were projected to receive $826 billion more in benefits from total federal spending than they were projected to pay in total federal taxes. Below, Chart 1 taken directly from our 2009 study, looks at federal taxes and spending in 2010.

So while Mitt Romney confuses many issues in his speech and offers up some controversial opinions on government dependence, he is right that many Americans don’t pay federal income tax (roughly 50 percent), don’t pay any total federal taxes (roughly 20 percent), and receive more in government benefits then they pay in federal taxes (roughly 60 percent).
*NOTE: This depends on how income is defined. As a percentage of market income, this group paid zero or negative taxes for the last two years. As a percentage of pre-tax income, which includes some government transfer payments that the income group has received, they paid closer to 1.5 percent in 2008 and 1 percent in 2009.
**NOTE: Since Mitt Romney’s remarks concern how federal tax and entitlement policy affects federal election outcomes, only federal taxes and federal benefits are relevant. Unfortunately the CBO data does not separate out federal benefits and state/local benefits, but since state benefits are only 6.2 percent of total benefits, they have minimal impact on this analysis.
Share this article